This application is designed to simplify voltage measurement and verification of the data using MAGICDAQ.
The project's introductory video describes how to use it.
- MAGICDAQ (docs)
- Oscilloscope (for verification of measurement data)
- An appropriate circuit (mainly electronic)
The following libraries and others are required. Please complete the installation before proceeding below.
- python
- pip
- magicdaq
- PyQt5
- numpy
- scipy
- matplotlib
If you run python -m pip list and they are installed correctly, you are done. It is recommended to use the latest version of each of them.
There are two ways of operation: from the Command Line and from the GUI(Graphical User Interface). GUI is strongly recommended for first-time users.
To launch the GUI, run python play.py.
There are tabs for Measure, Display.
Measure: Measure the voltage of the 8 analog input pins of the MAGICDAQ.
frequency: Set the frequency of the measurement.Time Duration: Set the measurement time.- The
'Choose File Location'button allows you to specify the directory where the data will be saved. File Name: Specify the name of the file to save. After execution, the date and time will be automatically added to the file name you set and saved. This generates unique data.
Once all necessary variables have been entered, the 'MEASURE' button can be pressed and the measurement can begin.
After the measurement, the measured data can be viewed in the GUI. Click on the 'View Graph' button. After clicking, a graph of the measured data will be displayed in a separate window.
Finally, you can choose whether or not to save the measured data.
Save: Saves the measured data. The file name for saving the data is as shown above.Dismiss: Delete the measurement data.
Press the 'Save' button or the 'Dismiss' button to take the measurement again.
You can simulate the measured data using an oscilloscope.
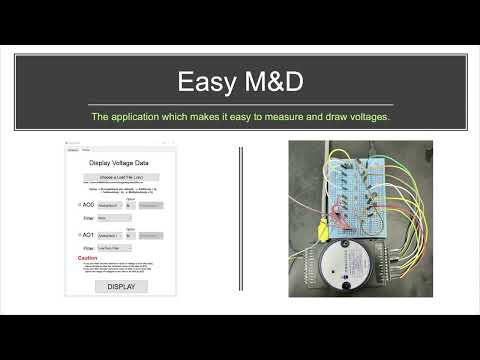
First select a file to get the data needed for the simulation. Only .csv files can be selected here.
Next, configure the pins to output: MAGICDAQ has two analog signal outputs (AO0, AO1). After properly connecting each of them to the oscilloscope (we recommend connecting CH1 for AO0 and CH2 for AO1), manipulate the parameters in the GUI. After selecting the checkboxes for the pins you need for output, let's move on to editing the parameters.
First, decide on the 'Option' parameter. This allows you to set whether the output should be a single data or an arithmetic calculation of two data. You can choose from the following
S(single): Outputs a single pin of data. This is the default setting.+(addition): Outputs the sum of the two selected measurement data as a single waveform (a + b).-(subtraction): performs subtraction using the two selected data and outputs the result as a single waveform (a - b).x(multiplication): Multiply two selected measurement data and output the result as a single waveform (a * b). (Note: If a parameter other than S is selected, the possible output range of 0-5[V] may be exceeded. If this happens, adjust the data so that it falls within the outputtable range. Specifically, values below 0[V] should be reset to 0[V] and values above 5[V] should be reset to 5[V]).
Finally, set the filter settings. You can apply a filter to the measured data to suppress noise. The contents of the selectable parameters are as follows.
None: No filter is applied.Low Pass Filter: Applies a low pass filter using a butter worth filter.High Pass Filter: Applies a high pass filter using a butter worth filter.
(Note: If you use filter and the minimum value of voltage is less than 0[V], adjust all data so that the minimum value of the data is 0[V]. If you use filter and the maximum value of data is more than 5[V], adjust the range of voltages in the data to be 0[V] to 5[V])
After making the above settings, the 'DISPLAY' button can be pressed. You can check the result immediately after clicking. (If the amount of data is large, it may take some time to compile.)
There are two main ways to do this from the command line.
-
To interact with the command, run
"python command.py". Follow the instructions given in the command. -
If you want to execute a command once, create a command according to the following configuration.
-m: measure mode-f 'value(int)': frequency(Hz), default:100-t 'value(int)': time duration(sec), default: 3-p 'value(int, array)': input pins array(format: [0,1,2,3,...]), default: 0 1-folder 'value(string)': location of folder (path or folder name), default: datas-file 'value(string)': file name, default: sample-v: view graph, default: False
-d: display mode-file 'value(string)': location of file, necessary-0 'value(single or formula)' 'value(filter)': AO0 output pin settings, filter default: none-1 'value(single or formula)' 'value(filter)': AO1 output pin settings, filter default: none
-m or -d is always required to determine whether measure or display is used. If this input is missing or both inputs are present, the operation will not execute correctly and will terminate.
Parameters with default values will be executed without input. However, if only key is entered, or if it is not an appropriate value, it will also be treated as a default value. Parameters are entered in no particular order.
The measured data is automatically saved.
Here are two examples.
python command.py -m -f 250 -file 250Hz
would start the measurement with the following settings:
- frequency:250Hz
- time duration: 3sec
- input pin: 0,1,2,3
- folder: 'data'
- file name: 'sample'
- view graph: off
(Caution: In terms of folder, this expression can be used if the corresponding directory exists directly below.)
python command.py -d -file .\datas\250Hz-2023-01-01-12-00-00.csv -0 0+2 none -1 4 high
would display data with the following settings:
- file location:
.\datas\250Hz-2023-01-01-12-00-00.csv - AO0: 'analog input 0' + 'analog input 2', filter(none)
- AO1; 'analog input 4' filter(high pass filter)
This project was developed during the activities of Research Internship in MAKinteract Lab, KAIST Republic of Korea(winter in 2022-2023)