Skip to content
New issue

Have a question about this project? Sign up for a free GitHub account to open an issue and contact its maintainers and the community.

By clicking “Sign up for GitHub”, you agree to our terms of service and privacy statement. We’ll occasionally send you account related emails.

Already on GitHub? Sign in to your account

How to change line color #8

Closed
dgana opened this issue Sep 25, 2017 · 7 comments
Closed

How to change line color #8

dgana opened this issue Sep 25, 2017 · 7 comments

Comments

@dgana
Copy link

dgana commented Sep 25, 2017

First of all thank you for the react chart. Help me a lot in my project. This is not really an issue i just want to know how to change the line color.

Thanks

@dgana
Copy link
Author

dgana commented Sep 25, 2017

Never mind i did not read the documentation in https://react-charts.js.org/#/story/custom-styles

@dgana dgana closed this as completed Sep 25, 2017
@dgana
Copy link
Author

dgana commented Sep 25, 2017

I just noticed that i cant change the default color is there any way to change it? for example in a pie chart with 1 Series and i want to change the default color..

@dgana dgana reopened this Sep 25, 2017
@dgana dgana closed this as completed Oct 24, 2017
@drydenwilliams
Copy link

drydenwilliams commented Jun 13, 2020

Here's how I added styled to my chart:

function MyChart({}) {
  const { data } = useChartConfig({
    height: 200,
    grouping: "primary",
    dataType: "ordinal",
  });

  const getSeriesStyle = React.useCallback((series) => {
    // Based off my chart bars
    const colorPalette = {
      series1: "#354657",
      series2: "#5597e2",
      series3: "#28A96C",
      series4: "#d44401",
      series5: "#ffe65b",
      series6: "#ffab1b",
    };

    return {
      fill: colorPalette[series.label],
    };
  }, []);

  return <Chart data={data} getSeriesStyle={getSeriesStyle} />;
}

I found the docs super confusing and over complicated so I hope this helps.

@jonnjasperejoc
Copy link

jonnjasperejoc commented Jan 15, 2021

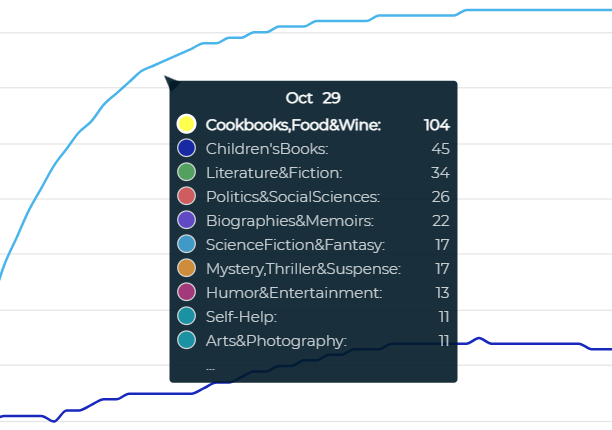
image

getSeriesStyle={getSeriesStyle}

Hello, I tried your code, it did changed the color of the Series (Yellow), but what I want is the line color, any idea?

@jonnjasperejoc
Copy link

jonnjasperejoc commented Jan 18, 2021

Okay so after spending a lot of time searching and experimenting with the chart because the Docs and API wasn't helping at all, I discovered a very simple way to change the default color of the line/column chart, without using the getSeriesStyle and getDatumStyle, just simple add the color property on your data.

const data = React.useMemo(
    () => [
      {
        label: 'Series 1',
        data: [
          { primary: 'Oct', secondary: 10 },
        ],
        color: '#1f77b4'
      },
      {
        label: 'Series 2',
        data: [
          { primary: 'Oct', secondary: 5 },
        ],
        color: '#ff7f0e'
      },
      {
        label: 'Series 3',
        data: [
          { primary: 'Oct', secondary: 7 },
        ],
        color: '#ffff4d'
      }
    ],
    []
  )

hope this helps.

@shramee
Copy link

shramee commented Oct 18, 2021

For those trying to do this in v3.0.0 with a bar graph or something you can use defaultColors option with array of colors like so...

<Chart
	options={{
		defaultColors: [ '#00ccff', '#008800', '#ddaacc', /*Array of colors*/ ],
		data,
		primaryAxis,
		secondaryAxes,
	}}
/>

@ibrahimrehman1
Copy link

For those trying to do this in v3.0.0 with a bar graph or something you can use defaultColors option with array of colors like so...

<Chart
	options={{
		defaultColors: [ '#00ccff', '#008800', '#ddaacc', /*Array of colors*/ ],
		data,
		primaryAxis,
		secondaryAxes,
	}}
/>

Can I use it with line or area charts? Also can you please tell which index represents which element? I want to set the fill, points, line colors

Sign up for free to join this conversation on GitHub. Already have an account? Sign in to comment
Labels
None yet
Projects
None yet
Development

No branches or pull requests

5 participants