Skip to content
New issue

Have a question about this project? Sign up for a free GitHub account to open an issue and contact its maintainers and the community.

By clicking “Sign up for GitHub”, you agree to our terms of service and privacy statement. We’ll occasionally send you account related emails.

Already on GitHub? Sign in to your account

Possible memory leak? #1567

Closed
wootwoot1234 opened this issue Dec 4, 2022 · 13 comments
Closed

Possible memory leak? #1567

wootwoot1234 opened this issue Dec 4, 2022 · 13 comments

Comments

@wootwoot1234
Copy link

We added an endpoint to track failures, etc. using uptimerobot.com. The code still needs tweaking but the general idea is working well but we are seeing what looks like a memory leak.

Here's a graph of the server memory after deploying the code below. We have about 50 endpoints that are called once every 5 min.

Screen Shot 2022-12-04 at 7 06 36 AM

Here is the endpoint code:

    app.get(
        "/queueStatus/:queue/:percentage/:quantity",
        wrapAsync<any, any, any, {queue: string; percentage: string; quantity: string}>(
            async (req, res) => {
                const {queue: queueName} = req.params;
                // accepted percentage = 80
                // quantity samples are 100 top jobs
                let {percentage = 80, quantity = 100} = req.params;

                quantity = Number(quantity);
                percentage = Number(percentage);

                assert(typeof percentage === "number", "percentage must be a number");
                assert(typeof quantity === "number", "quantity must be a number");

                const queue = await getQueue(queueName as QueueNames);
                let completedJobs = await queue.getJobs(["completed"], 0, quantity, false);
                let failedJobs = await queue.getJobs(["failed"], 0, quantity, false);
                const waitingJobs = await queue.getJobs(["waiting"], 0, quantity, false);
                // Remove jobs that finished more than 1 day ago
                completedJobs = completedJobs.filter(elem =>
                    moment().subtract(1, "day").isBefore(elem.finishedOn)
                );
                failedJobs = failedJobs.filter(elem =>
                    moment().subtract(1, "day").isBefore(elem.finishedOn)
                );
                const totalJobCount = completedJobs.length + failedJobs.length;
                const completedJobCount = completedJobs.length;
                const failedJobCount = failedJobs.length;

                const failures = [];
                let statusCode = 200;

                const jobWaitingFor1Hour = waitingJobs.filter(elem =>
                    moment(elem.timestamp).isBefore(moment().subtract(1, "hour"))
                );
                if (waitingJobs.length) {
                    statusCode = 580;
                    failures.push(`${waitingJobs.length}% jobs are waiting`);
                }
                if (jobWaitingFor1Hour.length) {
                    statusCode = 581;
                    failures.push(
                        `${jobWaitingFor1Hour.length} jobs have been waiting over 1 hour`
                    );
                }
                if (failedJobCount) {
                    const failedInPercentage = (failedJobCount / totalJobCount) * 100;
                    if (failedInPercentage > percentage) {
                        statusCode = 582;
                        failures.push(
                            `${failedInPercentage}% of failed jobs is greater than accepted percentage ${percentage}%`
                        );
                    }
                }
                const data = {completedJobCount, failedJobCount, totalJobCount};
                if (failures.length) {
                    return res.status(statusCode).json([...failures, data]);
                }
                return res.status(statusCode).json(data);
            }
        )
    );

We are running Redis version 6.2.6 and BullMQ 3.2.4

@manast
Copy link
Contributor

manast commented Dec 4, 2022

Where are you suggesting the memory leak is coming from?

@wootwoot1234
Copy link
Author

wootwoot1234 commented Dec 4, 2022

I'm not sure if there is a memory leak. I've disabled the calls to this part of the code to see if the memory increases still.

If the memory stops increasing, I would guess this code is causing the memory to increase:

    const queue = await getQueue(queueName as QueueNames);
    let completedJobs = await queue.getJobs(["completed"], 0, quantity, false);
    let failedJobs = await queue.getJobs(["failed"], 0, quantity, false);
    const waitingJobs = await queue.getJobs(["waiting"], 0, quantity, false);

@pruhstal
Copy link

pruhstal commented Dec 4, 2022

How much memory does the instance you're hosting it on have?

@wootwoot1234
Copy link
Author

This server is running with 2GB of memory

@manast
Copy link
Contributor

manast commented Dec 5, 2022

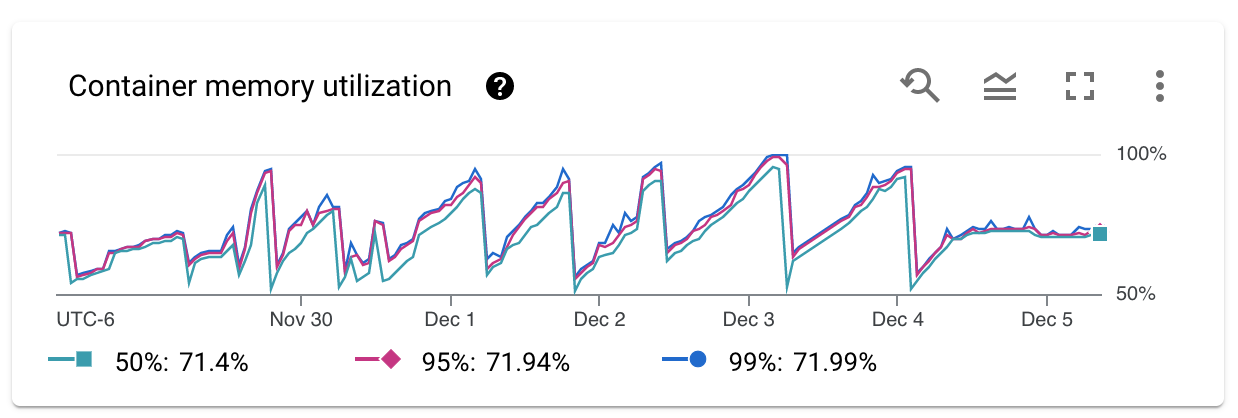
The graph you are showing above does not imply memory leaks. That's how memory looks like with a GC system like NodeJS. In fact it is very difficult to find memory leaks in Node unfortunately.

@manast
Copy link
Contributor

manast commented Dec 5, 2022

Particularly the BullMQ code that you are using in this example would be quite unlikely to have any memory leaks as it is just simple getters.

@wootwoot1234
Copy link
Author

Thanks for the help with this. I hope the issue is just something I'm doing unrelated to BullMQ.

@manast What do you mean by "That's how memory looks like with a GC system like NodeJS"?

I disabled uptimerobot so nothing has been calling the code above for the last day. This is the memory graph:

Screen Shot 2022-12-05 at 8 31 49 AM

It seems clear that this endpoint is likely causing the memory to increase.

I agree, it does seem odd that calling a few simple getters would cause this memory issue. I'll run another test.

First, I will re-enable the uptimerobot calls and see if the memory resumes (no code changes). If it does, I will remove the other code from the endpoint (see below) and see if it changes anything with the memory.

    app.get(
        "/queueStatus/:queue/:percentage/:quantity",
        wrapAsync<any, any, any, {queue: string; percentage: string; quantity: string}>(
            async (req, res) => {
                const {queue: queueName} = req.params;

                const quantity = 500;

                const queue = await getQueue(queueName as QueueNames);
                const completedJobs = await queue.getJobs(["completed"], 0, quantity, false);
                const failedJobs = await queue.getJobs(["failed"], 0, quantity, false);
                const waitingJobs = await queue.getJobs(["waiting"], 0, quantity, false);

                const totalJobCount = completedJobs.length + failedJobs.length;
                const completedJobCount = completedJobs.length;
                const failedJobCount = failedJobs.length;
                const waitingJobCount = waitingJobs.length;

                const statusCode = 200;
                const data = {
                    totalJobCount,
                    completedJobCount,
                    failedJobCount,
                    waitingJobCount
                };

                return res.status(statusCode).json(data);
            }
        )
    );

Let me know if you would like me to run any other tests.

I'll report back.

@manast
Copy link
Contributor

manast commented Dec 6, 2022

Basically, if you suspect there is a memory leak in BullMQ you should setup a test that is independent of third-party libraries such as express, etc. and the test must unequivocally show there is a memory leak. This is because determining if there really is a memory leak is very time-consuming so I need very clear proof that it is the case before I am going to look deeper into it.

@wootwoot1234
Copy link
Author

After doing more testing, I think the memory issue is caused by the server returning status code 500 errors and is unrelated to BullMQ. If I run the above code without 500 errors it works fine. Sorry for the false flag.

@wootwoot1234
Copy link
Author

@manast is it possible that not calling await queue.close() in and endpoint could cause memory issues?

@manast
Copy link
Contributor

manast commented Dec 10, 2022

queue.close() is normally used when you shut down the server since queue instances are normally alive during the lifetime of the server. The only case where it would create memory leaks is if you are instantiating new queues continuously and never closing them.

@wootwoot1234
Copy link
Author

I see. In my example above we call new Queue(...) in the getQueue(queueName as QueueNames); function.

This means that we create a new queue instance every time the endpoint is called. In this case, should we close the queue or maybe call new Queue(...) once on load and then reuse it every time the endpoint is called?

@manast
Copy link
Contributor

manast commented Dec 10, 2022

You should only call new Queue() once and not per call to the endpoint.

Sign up for free to join this conversation on GitHub. Already have an account? Sign in to comment
Labels
None yet
Projects
None yet
Development

No branches or pull requests

3 participants