Skip to content
New issue

Have a question about this project? Sign up for a free GitHub account to open an issue and contact its maintainers and the community.

By clicking “Sign up for GitHub”, you agree to our terms of service and privacy statement. We’ll occasionally send you account related emails.

Already on GitHub? Sign in to your account

How to put scalars in the same row in tensorboard in TF2.0? #2984

Closed
zhangjh915 opened this issue Nov 28, 2019 · 10 comments
Closed

How to put scalars in the same row in tensorboard in TF2.0? #2984

zhangjh915 opened this issue Nov 28, 2019 · 10 comments

Comments

@zhangjh915
Copy link

Please make sure that this is a feature request. As per our GitHub Policy, we only address code/doc bugs, performance issues, feature requests and build/installation issues on GitHub. tag:feature_template

System information

  • TensorFlow version (you are using): 2.0
  • Are you willing to contribute it (Yes/No): Yes

Describe the feature and the current behavior/state.

I did not see related arguments in the documentation. If there is such function, please let me know. :P

The following code produces a tensorboard with 3 different rows. How to put the first two in one row and the second in the other?

with summary_writer.as_default():
    tf.summary.scalar("training_loss", loss, step=batch_index)
    tf.summary.scalar("learning_rate", optimizer.learning_rate, step=batch_index)
with summary_writer.as_default():
    tf.summary.scalar("validation_loss", val_loss, step=batch_index)

Will this change the current api? How?
Probably
Who will benefit with this feature?

Any Other info.

@ravikyram ravikyram assigned ravikyram and rmothukuru and unassigned ravikyram Nov 29, 2019
@rmothukuru
Copy link

@zhangjh915,
Can you please refer the issue, 7089 and this Stack Overflow Issue and let us know if it helps. Thanks!

@zhangjh915
Copy link
Author

zhangjh915 commented Nov 29, 2019

@rmothukuru ,
Thanks for the quick reply. I read the solutions in the links you attached but they both seem to not be TF2.0. To my knowledge, there is neither "session.run" or "add_scalars" in TF2.0. To make my question clear, The the code I attached in the question produced the following tensorboard. But I want to put both learning rate and training loss into the same row (not to put learning rate and training loss in the same graph).
截屏2019-11-2915 03 38

@rmothukuru
Copy link

@zhangjh915,
Please refer this Tensorboard Link to migrate 1.x code to 2.0. Thanks!

@zhangjh915
Copy link
Author

@rmothukuru ,
Sorry but it does not help with my question. The solutions you attached is to plot different curves in the same graph, but what I want is to put different graphs in the same row of category. In the picture I attached above, I want to put the first two plots in the same row and set the row name to something like "training".

@nfelt
Copy link
Collaborator

nfelt commented Dec 3, 2019

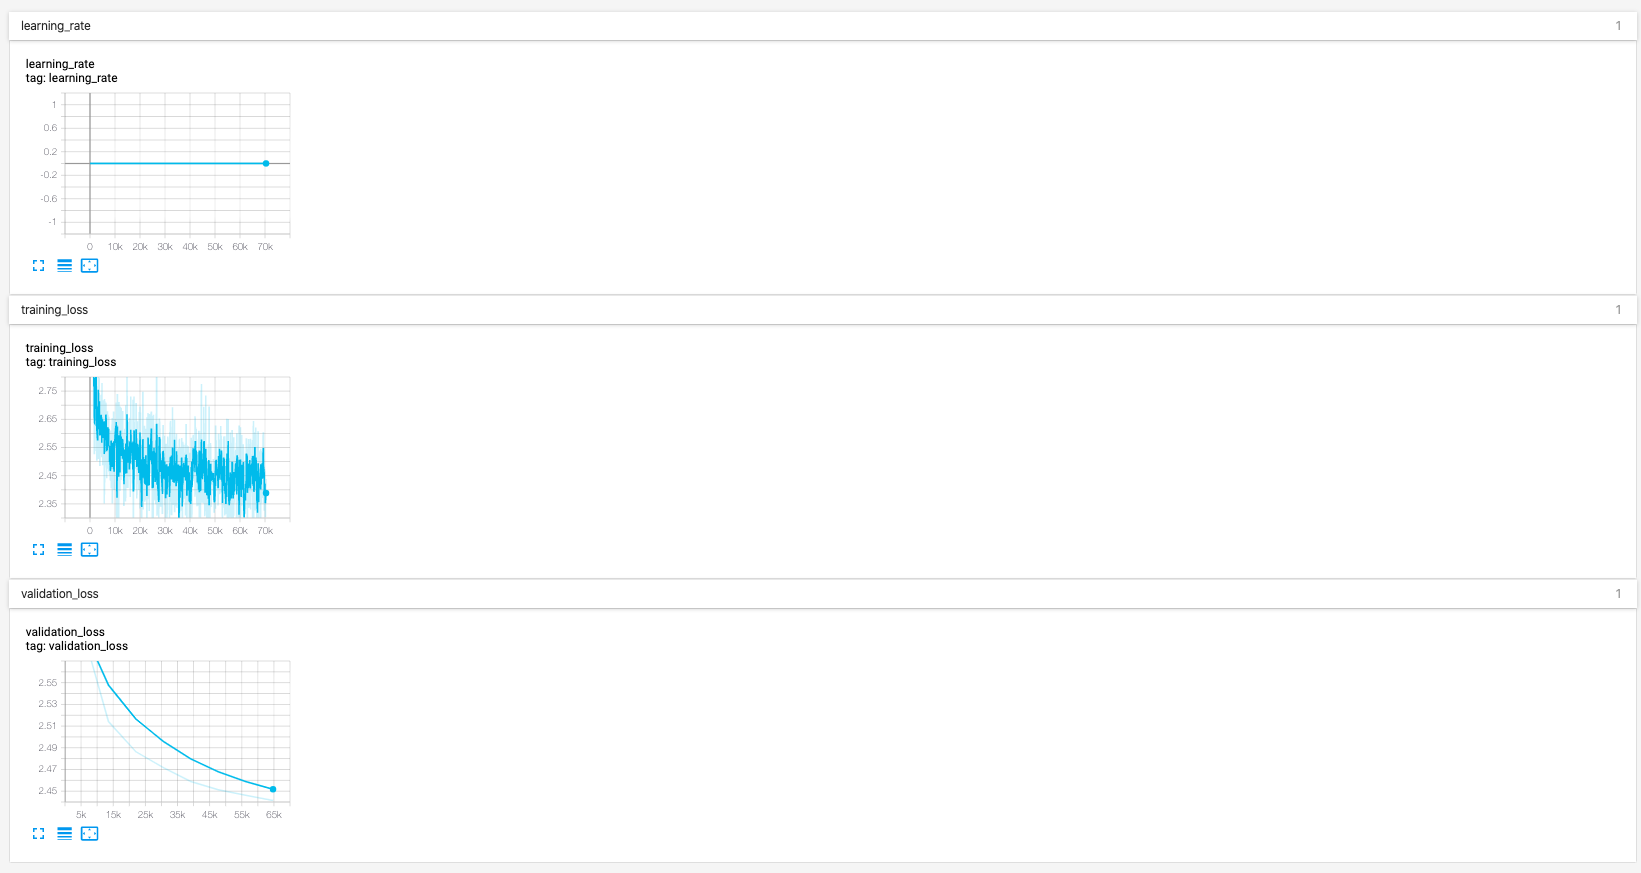
@zhangjh915 the categories are based on common prefixes in the tag names, delimited by slashes like a filename. So e.g. if you emit the summaries with the names tf.summary.scalar("training/training_loss", ...) and tf.summary.scalar("training/validation_loss", ...) it should do what you want.

You can also make this happen automatically by putting them inside a tf.name_scope() block like this:

with tf.name_scope("training"):
  tf.summary.scalar("training_loss", ...)
  tf.summary.scalar("validation_loss", ...)

@david-ngo-sixense
Copy link

Hello @nfelt ,

Do you know how to display two scalars on the same graph (for tensorflow 2.0) ?
I want to display train_accuracy/valid_accuracy on the same graph. (and train_loss/valid_loss)
Thank you very much.

@psybuzz
Copy link
Contributor

psybuzz commented May 4, 2021

Thanks for the question. Unfortunately, merging 2 line charts with 1 line each into 1 line chart with 2 lines is not currently supported in the Scalars dashboard. There is a separate, existing feature request for adding this, so I would suggest thumbs-up'ing and following the other thread if you are interested: see #597

@david-ngo-sixense
Copy link

Thanks @psybuzz for your answer.
But I don't really understand. If I use the function model.fit or model.fit_generator; I can easily display two line charts (train accuracy and validation accuracy) into the same chart (to check overfitting). But when I implement the training loops, I can't make it.
train_log_dir = logs_dir.joinpath('train/')
train_log_dir.mkdir(exist_ok=True)
valid_log_dir = logs_dir.joinpath('valid/')
valid_log_dir.mkdir(exist_ok=True)
train_summary_writer = tf.summary.create_file_writer(str(train_log_dir))
valid_summary_writer = tf.summary.create_file_writer(str(valid_log_dir))

with train_summary_writer.as_default():
with tf.name_scope("accuracy"):
tf.summary.scalar('train_acc', train_metrics[0].result(), step=epoch)
with valid_summary_writer.as_default():
with tf.name_scope("accuracy"):
tf.summary.scalar('valid_acc', val_metrics[0].result(), step=epoch)

It seems to me that we can do it in tensorflow 1.x

@psybuzz
Copy link
Contributor

psybuzz commented May 5, 2021

I see, in the example code, the train_summary_writer creates a run with a chart named "train_acc", while the valid_summary_writer creates a separate run with a chart named "valid_acc". If the intent is to compare the same "accuracy" metric across these 2 different runs, does changing the "tag name" of the scalar to the same name address the problem?

e.g.

with train_summary_writer.as_default():
  tf.summary.scalar('accuracy', train_metrics[0].result(), step=epoch)
with valid_summary_writer.as_default():
  tf.summary.scalar('accuracy', val_metrics[0].result(), step=epoch)

should produce 1 chart named "accuracy" with 2 lines on it.

@david-ngo-sixense
Copy link

Yes, it's working @psybuzz . Thanks very much.

Sign up for free to join this conversation on GitHub. Already have an account? Sign in to comment
Projects
None yet
Development

No branches or pull requests

7 participants