CityLab has unveiled a new model for understanding congressional districts in terms of density, the CityLab Congressional Density Index (CDI). This model classifies every congressional district by the density of its neighborhoods using a machine-learning algorithm.
I wrote about the takeaway from the model with Richard Florida here, including graphics and an interactive.
This article explains how we calculated the model. You can download our classification for each congressional district in simple and expanded forms (plus the column layout for the full data), and download the R code used to calculate the model here.
One simple way to categorize districts by density is to just calculate each district's overall density — total people or households divided by total area. We decided not not follow that route because many districts contain a wide variety of neighborhoods. A single district might contain both high-rise condos and rolling fields. Instead, we decided to start at the neighborhood level, using the U.S. Census's tracts — the smallest geographic level for which demographic data is available.
We classified each tract based on the number of households per square mile, based on previous research:
- Tracts with fewer than 102 households per square mile were classified as "very low density." This was based on research by Jed Kolko, which found that 102 households per square mile in a ZIP code was the cutoff at which people were likely to describe their neighborhoods as "rural."
- Tracts with more than 2,213 households per square mile were classified as "high density," again based on Kolko's findings that people living in neighborhoods above that density tended to describe them as "urban."
- The people in neighborhoods in between tended to describe where they live as "suburban." But that's a huge category with an estimated 182 million Americans, or 57 percent of the population. We added an additional dividing line at 800 households per square mile. Tracts below that level was classified as "low density"; above that level, tracts were "medium density."
The four categories all have significant shares of the American population, with the "low" and "medium" density tracts somewhat more common than the "high" and "very low" neighborhoods:
| Type of Tract | Estimated Population | Percentage of Country |
|---|---|---|
| Very low density | 71,182,763 | 22.35% |
| Low density | 89,918,057 | 28.24% |
| Medium density | 91,897,589 | 28.86% |
| High density | 65,425,961 | 20.55% |
Though most Census tracts are located within a single congressional district, around 5,000 of the country's more than 72,000 tracts are substantially split between two or more different districts. We used a file from the Missouri Census Data Center's MABLE/Geocorr14 tool that calculated the percentage of each tract's land area within each congressional district. Later on in the process, we multiply the tract's total population by this percent to calculate a rough estimate of the number of people in each congressional district by tract.
There was one problem with the MABLE/Geocorr14 database: it was based on congressional districts as drawn earlier in the decade. As such, it didn't account for the new congressional district boundaries in effect for 2018 in Pennsylvania. We used a custom R script to calculate similar percentages for the split tracts in Pennsylvania. The data here does account for Pennsylvania's new 2018 maps for its classifications, though incumbents and incumbent parties are identified based on who holds the district in its current boundaries.
At this point, we've categorized every Census tract by density, and have assigned each tract (or part of tract) to a congressional district, along with an estimate of the population living in each tract (or part of tract). The next step was simple: sum up this population by congressional district.
Now for each district, we had an estimate of the total number of people (and share of total population) living in each type of neighborhood. For example, Wisconsin's 1st District, currently held by House Speaker Paul Ryan, is 21.6 percent "very low density," 40.7 percent "low density," 28.1 percent "medium density" and 9.6 percent "high density."
We then plugged this density breakdown of each of the country's 435 congressional districts into a machine-learning algorithm called "fuzzy c-means clustering." Put simply, this groups a dataset into a certain number of clusters. Each cluster's data will tend to be more similar to each other than to members of different clusters. Running this algorithm immediately produced sensible results: Districts we knew to be rural tended to be clustered together, and similarly with districts we knew to be urban or suburban.
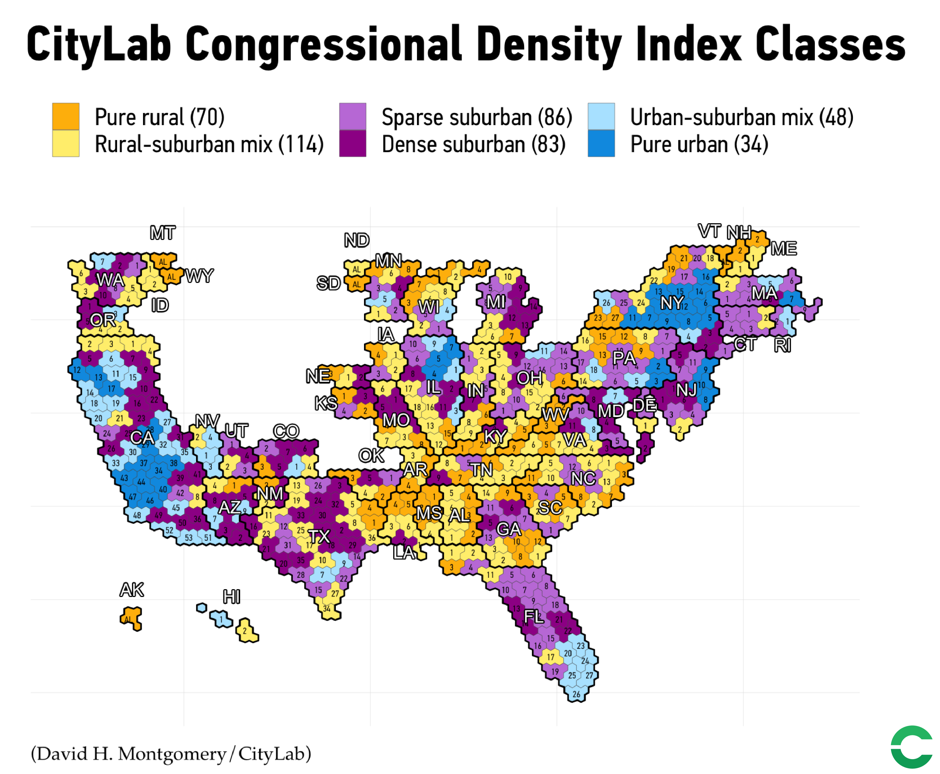
After experimenting with different numbers of clusters, we settled on six, because six clusters fit well with understandings of density and demographics as well with trends in politics. This is what a typical example of each cluster looked like in its neighborhood makeup:
| Neighborhood composition | |||||
|---|---|---|---|---|---|
| Cluster | Very low density | Low density | Medium density | High density | Number of Districts |
| Pure rural | 58.7% | 29.3% | 10.6% | 1.4% | 70 |
| Rural-suburban | 36.6% | 37.4% | 22.1% | 3.9% | 114 |
| Sparse suburban | 12.2% | 42.5% | 37.0% | 8.3% | 86 |
| Dense suburban | 5.2% | 21.0% | 51.4% | 22.4% | 83 |
| Urban-suburban | 2.6% | 12.1% | 34.5% | 50.8% | 48 |
| Pure urban | 0.3% | 1.8% | 8.0% | 90.0% | 34 |
Others were more ambiguous. Minnesota's 3rd District, for example, was categorized as "sparse suburban," but it had only a 52.5 percent resemblance. It also had a 26.5 percent resemblance to "dense suburban," plus minor odds for other district types. That's because Minnesota's 3rd District's abundance of medium-density neighborhoods matched other "dense suburban" districts — but its small share of high-density neighborhoods and moderate share of low-density neighborhoods were closer to "sparse suburban" districts.
Running the c-means clustering algorithm over and over again produced slightly different results for some districts on the edge between two different clusters. But the big picture was remarkably consistent.
We've chosen to report each district as belonging to a single category, as sorted by the c-means algorithm. But our full data contains each district's resemblance scores for each cluster, for those who want to be more attuned to uncertainty. (Reference the column layout as a guide.)
With every district now classified according to its density, we brought in data from a variety of sources about the politics of each seat: which party currently occupies it, the share of the vote that presidential and congressional candidates have received in that district, and how the election forecasters at FiveThirtyEight and the Cook Political Report rate the race's chances in the 2018 general election.
This enabled us to identify the thrust of our main story introducing the model: that Republican-held seats in predominantly suburban districts are disproportionately competitive this year.
But we also believe there are other insights that can be drawn from this way of looking at congressional districts. Some of those we hope to write ourselves over the next month here at CityLab. But we also hope other people will find this a useful tool for their own analyses. So take a look at the full data and code! If you have any questions, email me or reach out on Twitter.
The cartogram tiles used in our visualization were designed by Daniel Donner for Daily Kos Elections, and are used under a Creative Commons Attribution 4.0 International License. They can be downloaded here.