| title | author | date |
|---|---|---|
Introduction to KEGGlincs |
Shana White |
03/23/2017 |
by Shana White
Installation:
#Make sure that the following bioconductor packages are installed
source("http://bioconductor.org/biocLite.R")
biocLite(c("hgu133a.db", "KEGGgraph", "KEGGREST", "KOdata"))

#Download package
biocLite("KEGGlincs")

#Load/activate package for use
library(KEGGlincs)

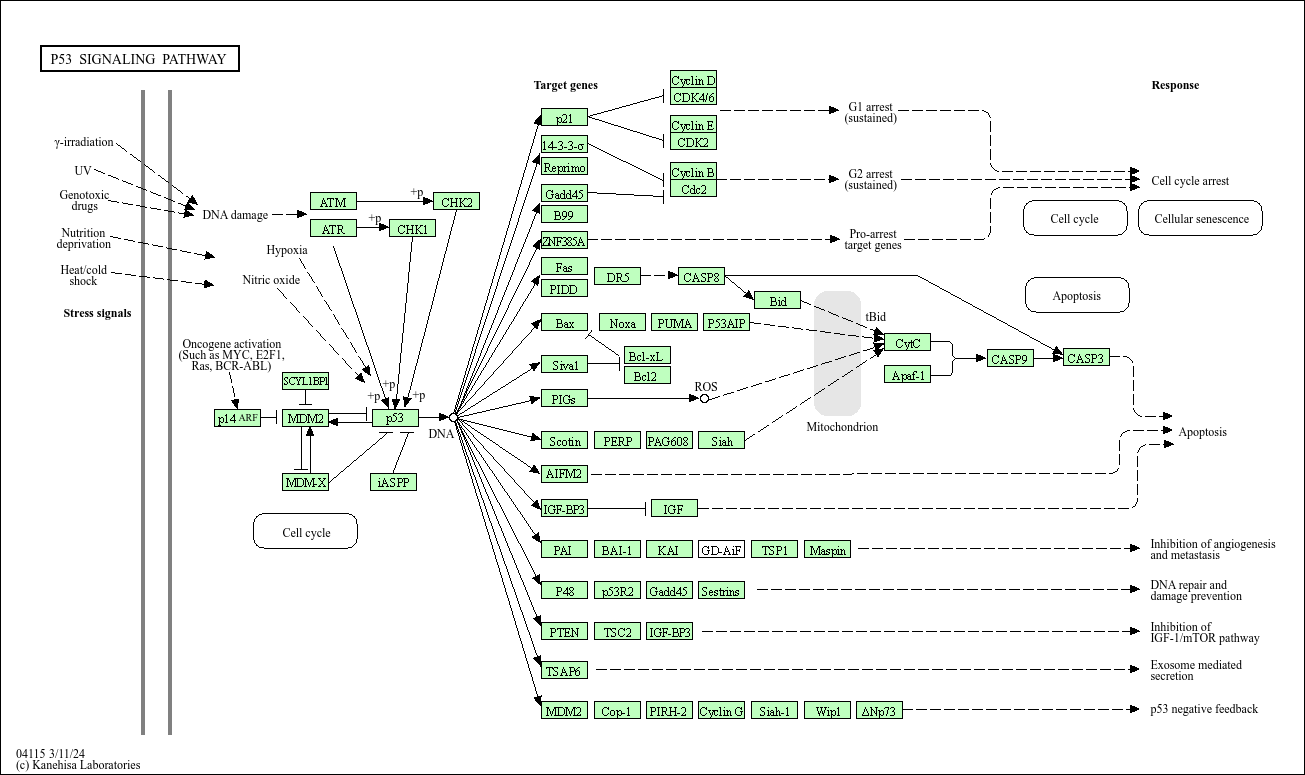
KEGGlincs is an R package that provides a seamless interface for viewing detailed versions of KEGG pathways in Cytoscape such that the exact relationships (edges) that exist between pathway elements (nodes) are visualized in a meaningful manner.
This package is intended to be used as a tool to accurately regenerate KEGG pathways with expanded edges that are marked-up (in terms of color or color+width) to portray specific edge attributes. Specifically,
- the edges are expanded to represent all relationships between genes encoded by the KGML file but not necessarily represented in the original [KEGG] pathway. This 'expansion' occurs either because:
- one node may represent many [often paralogous] genes.
- a node is of type 'group' and represents two or more genes that are part of the same functional complex.
- the edge attributes represented can be specified by the user as either:
- Functional - the exact type and [in some cases] subtype of the relationship defined by the KGML file.
- Data driven - based on quantitative experimental evidence for gene-gene relationships generated by experimental data. As an added feature and motivating example, this package gives users an opportunity to use LINCS L1000 knock-out data in order to analyze/visualize the pathway edges as they pertain to specific cell lines.
Aside from edge-specific annotation/mark-up, a unique feature of this package lies in the ability for users to generate graph objects in R and send them to Cytoscape for an interactive visualization experience via utilities developed by the cyREST team.
The following example showcases the ideas described above.
- Explicitly shows all documented edges
- Color-coded to easily interpret edge type (i.e. activation, inhibition, etc.)
- Edge color key:
- Edge color key:

Note: An open Cytoscape session is required for pathway visualization; i.e. make sure that Cytoscape is open before running the following commands
KEGG_lincs("hsa04115")

Pathway with edge attributes generated from LINCS L1000 knock-out data, refined by cell-line specific expression (default option, see below), and visualized in Cytoscape
- Explicitly shows all documented edges; edges that do not exist in the data appear but are not marked-up for interpretation [of significance].
- If baseline expression data is available for the selected cell-line, the pathway will be refined to only include edges between genes that are expressed in a given cell line. The nodes for unexpressed genes are colored gray.
- Widths: Magnitude of concordance for the edge in the selected cell-type
- Colors: Direction and significance for the edge in the selected cell-type (based on a modified odds-ratio score).
- Edge color key (+/- refers to direction of score; scores are considered significant if adjusted p-value is >= 0.05):
- Edge color key (+/- refers to direction of score; scores are considered significant if adjusted p-value is >= 0.05):

KEGG_lincs("hsa04115", "PC3")

KEGG_lincs("hsa04115", "HA1E")
