You signed in with another tab or window. Reload to refresh your session.You signed out in another tab or window. Reload to refresh your session.You switched accounts on another tab or window. Reload to refresh your session.Dismiss alert
digraph {
	node [shape=doublecircle, fontcolor=blue];
	edge [style=bold, color=blue];

	a b e;

	a -> b;

	node [shape=box3d];
	edge [style=dotted, color=red];

	a -> c ->d;
	c -> e;
}
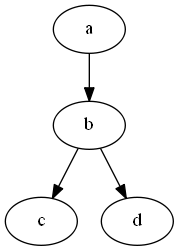
节点a、b和e获得了属性shape=doublecircle,而节点c和d的属性被覆盖为了shape=box3d,但是五个节点有相同的属性fontcolor=blue。可见shape属性被覆盖了。同理,连线a -> c -> d的属性style=bold也被style=dotted覆盖,而a -> b却没有变。
digraph {
	node [shape=doublecircle, fontcolor=blue];
	edge [style=bold, color=blue];

	a b e;

	a -> b;

	node [shape=box3d];
	edge [style=dotted, color=red];

	a -> c ->d;
	c -> e;
}
节点a、b和e获得了属性shape=doublecircle,而节点c和d的属性被覆盖为了shape=box3d,但是五个节点有相同的属性fontcolor=blue。可见shape属性被覆盖了。同理,连线a -> c -> d的属性style=bold也被style=dotted覆盖,而a -> b却没有变。

DOT语言学习笔记
介绍
之前上网瞎逛的时候,发现的一个挺好的自动布局绘图工具Graphviz。倒腾了一番,写下一些笔记,方便以后复习。
Graphviz全称Graph Visualization Software,最早出自AT&T实验室,是基于DOT语言脚本的自动绘图软件。是开源且免费的软件。
优点
相对于ms viso需要手动拖动图标,graphviz只需要通过DOT代码表达各节点的逻辑关系,然后自动布局和输出关系图。最小化复杂关系的连线交叉,增强可读性。
尤其在绘制非常复杂的逻辑关系、组织架构、模块组成、数据结构等图时,可以大大减少工作量,理清思路。
缺点
无法绘制需要自定义或者固定布局的图,比如时序图。
安装
Graphviz Download
官网提供安装包和源码包两种安装方式。安装完成后,最好是将graphviz安装目录下的bin目录设置到环境变量中,以便于随处使用dot命令行。
应用
扩展名
Graphviz支持两种文件扩展名:
*.gv和*.dot,使用*.gv是为了防止与早期的ms word的扩展名冲突。后文中的DOT文件即表示输入graphviz处理的文件。
输出格式
Graphviz支持的输出文件格式:
更多格式
编辑
DOT文件可以用任何文本编辑器编辑。但是graphviz自带一个及时输出图像的软件gvedit,软件打开DOT文件,然后按F5及时得到输出图像。这种“所见即所得”的编辑体验非常棒。
在命令行中输入
gvedit可打开这个编辑器。当然,有些Unix/Linux上可以使用的编辑器也支持graphviz及时编辑与输出,比如Emacs的graphviz dot mode和VI/VIM插件
布局器
Graphviz除了DOT语言用于描述图像,还有许多渲染生成工具 —— 布局器:
命令行
这里的
-Tv中的v可用graphviz支持的输出格式代替,如:-Tpng、-Tjpg等等。而
-Kv中的v可用布局器代替,如:-Kfdp、-Kcirco等等。dot是默认布局器,因此可以省略-Kv这部分参数。-O表示自动根据输入文件名来给输出文件命名。abc.gv即使输入的DOT文件可以通过
dot -h或dot -?来获得命令行帮助更多命令行
第一个graphviz图
保存为
abc.gv利用命令行以dot布局器(默认),输出同名的png格式图像
abc.gv.png三个示例快速入门
节点示例
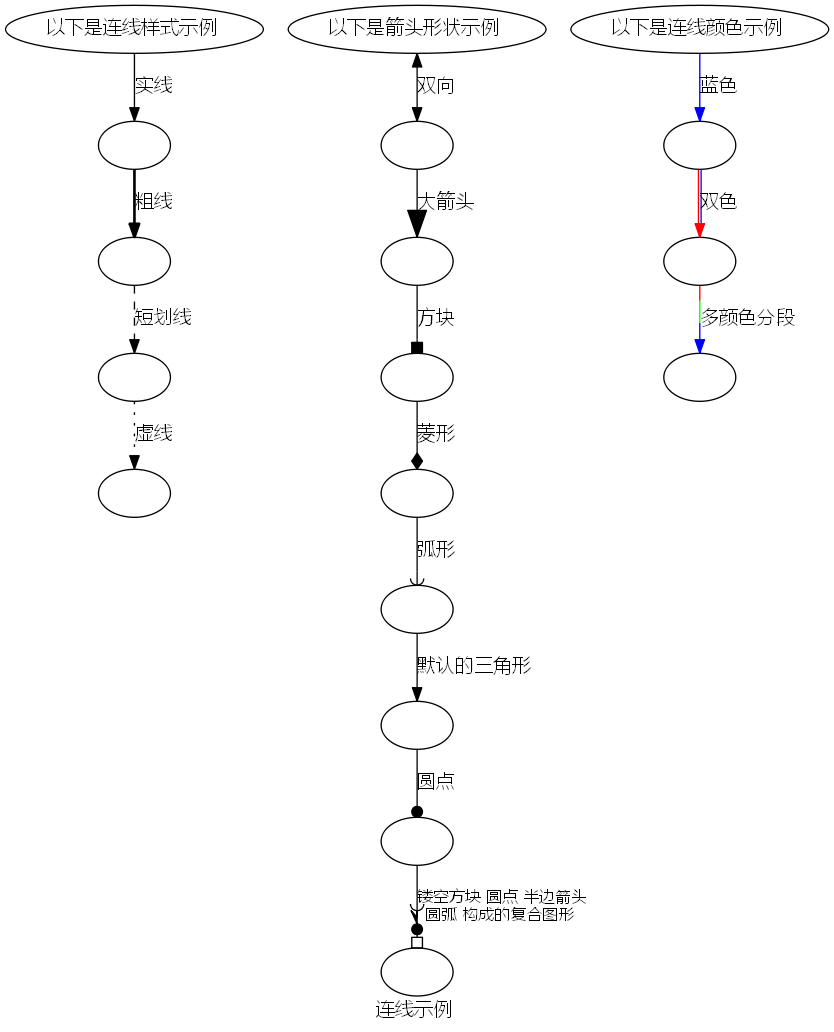
连线示例
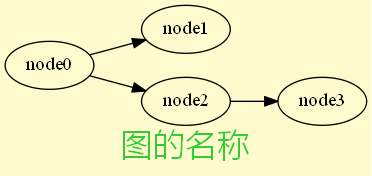
图示例
更多示例
【注意】后文中的示例大多需要通过命令行DOT或者gvedit输出图像,不再外加说明。
DOT语法
基础
DOT只有图graph、节点node和连线edge三个主要结构。
graph、node和edge三个关键字还能用于全局属性定义,后面细讲。图分为有向图和无向图。无向图声明的时候使用关键字
graph,有向图使用digraph。关键字
node:定义全局节点属性时使用edge:定义全局连线属性时使用graph:定义全局图属性,或声明一个无向图时使用digraph:声明一个有向图时使用subgraph:声明一个子图时使用,如果父图是有向图则子图是有向图,如果父图是无向图则子图也是无向图strict:用于防止相同的两个节点间使用重复的连线。ID有效字符
ID是编辑者自定义的字符串,相当于C语言中的标识符。
命名规则
[a-zA-Z\200-\377],下划线_,数字[0-9](但不能数字开头),如:Version_3;[-]?(.[0-9]+|[0-9]+(.[0-9]*)?),如:-.1或1.414;"...",字符串中的双引号需要转义\",如:"DOT language";<...>,如:<<b>Welcome</b> <u>to</u> <i>China.</i>>;实际上甚至可以插入表格。HTML-Like Labels使用
ID主要是作为图和节点的命名字符串
简单的DOT代码中的图名ID可以省略,这就有了匿名图
作为子图的图的ID一定要以
cluster开头命名,否则graphviz不识别。因为父图的图ID和子图的图ID,共享相同命名空间,父图和子图、子图与子图间的图的ID命名一定要不同。
【注意】如果ID中间包含空格一定要用双引号包裹。
注释
DOT支持类似C++的注释,单行注释
//,多行或部分注释/*和*/。字符串
分隔符
分号
;和逗号,都不是必须的,可以用空格替代。竖杠
|在节点的属性shape=record时,作为划分分组内部的分隔符。后面有举例字符串处理
长字符串换行,类似C语言,如:
DOT还支持拼接操作符
+,如:【注意】这里描述的字符串都是指以双引号
"包裹的转义与实体符号
字符串中的字符,只有双引号
\"和反斜杠\\需要转义。字符串支持还HTML式的实体符号,如:
&表示&,<表示<,β表示β。当节点的属性
shape=record时,竖杠\|、花括号\{\}、方括号\[\]和尖括号\<\>都需要转义。分组符号
前面介绍了两种包裹字符串的符号,双引号
"..."和<...>;另外还有两种包裹分组的符号:方括号
[...]和花括号{...}。方括号
用于属性定义,给图、节点和连线添加各种样式。如:
花括号
用法1,图的声明,,包括有向、无向图以及子图的声明
用法2,某个节点连接到多个节点时的简写方式
用法3,只有在节点的属性
shape=record时,包裹节点内部的分组结构声明
图
一个图的声明,需关键字
graphv或digraphv和{...}两部分另外,在关键字
graph或digraph前面可以添加一个空格隔开的关键字strict用来防止两节点间重复连线节点
节点可以不声明直接在连线声明时使用。
一般提前声明节点的情况有两种:
给节点定义属性
节点被分组到子图中
连线
连线的声明需要连接两个节点。
对于有向图,连线使用
->;无向图,连线使用--。两种连线都可以简写
等价于
属性
属性定义可以给节点、连线和图渲染上不同的样式,使得最终得到的关系图更加美观,提升可读性。
属性均是以名值对
attr=val的方式出现。属性值val,可用双引号或尖括号包裹,但是可选的;不过,如果属性值中间包含DOT无法直接解析的字符,就必须用双引号或尖括号包裹,甚至转义。全局属性
图
直接定义
使用关键字
graph节点
使用关键字
node连线
使用关键字
edge局部属性
局部设置属性,除了可以对一个一个的节点或者连线设置,也可以同时对多个节点或者多个连线进行设置
节点
连线
常用属性
label
可用于节点、连线和图的名称设置,如:
属性值的形式:
"val"、<val>和val。shape
用于节点的形状修改,如:
常用属性值:
box矩形、circle圆形、polygon多边形、ellipse默认的椭圆、record记录式、diamond菱形等等。其中
shape=polygon结合倾斜度属性skew=0.4可以将节点设置成平行四边形;shape=record可以将节点设置成记录表的样式。更多形状
style
用于节点样式和连线样式设置,如:
常用属性值:
filled填充节点背景色,需要结合填充色属性fillcolor;solid默认的实线、bold粗线、dashed短划线、dotted虚线。color
设置节点边框线颜色和连线颜色,如:
颜色值有3种形式:
redgreenblueyelloworangenavywhiteblack等等"#ff0000"等同于red,注意因为DOT不直接识别#,一定要用双引号或尖括号包裹"red:blue"和"red:green;0.4:blue",同样因为不直接识别:,需要包裹成字符串bgcolor
用于填充图的背景色,如:
属性值类似
color,但是渐变色只支持2种色构成的渐变。fillcolor
用于填充节点的背景色,用法同
bgcolorfontname
可设置节点、连线和图的ID的字体,相当于CSS中的
font-family。【注意】使用中文时,
fontname一定要设置系统支持的中文字体,否则graphviz输出图片的中文会乱码。而且,图的名称、连线的名称以及节点的名称只要使用了中文就都应该设置fontname属性,比如:fontname="Microsoft Yahei"。另外,最好是在中文字符后留有一个空格,防止乱码后,英文字符也被修改。fontsize
设置节点、连线和图的字体大小,属性值可以是纯数字或者是数字字符串
fontcolor
设置字体的颜色,用法类似
color,但是不支持渐变色rankdir
设置图的绘制方向,如:
属性值: 默认由上至下
TB、由下至上BT、由左至右LR和由右至左RLdir
设置连线的箭头方向,如:
属性值:向前
forward(有向图默认)、向后back、双向both以及无none(无向图默认)arrowhead
设置无向图或有向图的连线头部箭头形状,如:
属性值:箭头形状有很多变种,而且可以同时设置多个形状,基本组合是[是否镂空][左右边][基础形状]。字母
o决定箭头形状是否镂空open,l和r分别表示只出现左边left和右边right,基础形状有box、crow、curve、icurve、diamond、dot、inv、none、normal、tee以及vee。解读
teeoldiamond:第一个形状tee紧跟着第二个形状是镂空的o取左边的l钻石形状diamond。更多箭头形状
arrowtail
设置无向图或有向图的连线尾部箭头形状,与
arrowhead用法相同arrowsize
设置连线箭头大小
更多属性
端口
节点上的端口,类似于指针。在节点上确定端口以后,再连接两个节点时可以找到节点上准确的位置。
罗盘端口
罗盘也就是确定八个方位,罗盘端口就是方位端口。
方位端口是每个节点隐藏自带的,可以直接使用。
每个节点都有八个方位:北
n、东北ne、东e、东南se、南s、西南sw、西w和西北nw。利用方位可以指定连线从哪个位置连接节点,如:
不同于默认情况下的自动连线,利用方位可以手动指定连线的位置。
命名端口
命名端口需要在节点中手动设置端口,并且位置命名。
一般在节点的属性
shape=record时,对于节点内分组中的单元进行端口设置。struct1:next中的next和struct2:prev中的prev都是命名端口,通过这两个端口可以将节点struct1的* int单元与节点struct2的int单元连接起来。而struct1:head:s则即使用了命名端口head,又使用了罗盘端口s。以上可以看出,命名端口的设置出现在节点声明时,使用尖括号
<...>包裹,命名端口和罗盘端口都是在节点ID后面加冒号:来引用。属性叠层
继承
主要是指子图会从父图继承图、连线和节点的所有属性定义
覆盖
DOT中的属性可以多次定义,后面定义的会覆盖前面定义的。
但是要注意如果一个声明在两个属性定义之间,声明的节点或者连线只会获得前一个属性定义。
节点
a、b和e获得了属性shape=doublecircle,而节点c和d的属性被覆盖为了shape=box3d,但是五个节点有相同的属性fontcolor=blue。可见shape属性被覆盖了。同理,连线a -> c -> d的属性style=bold也被style=dotted覆盖,而a -> b却没有变。当然图的属性定义也能覆盖,不过是父图与子图之间
对比
cluster1和cluster2两个子图,前者把父图abc定义的图、连线和节点的属性全部覆盖了;而后者是继承自父图。另外,匿名子图还能够在视觉上不出现子图效果的情况下,覆盖父图定义的属性
很明显,这里的节点
b的shape属性被修改为了tripleoctagon,而节点c却没有被修改。总结
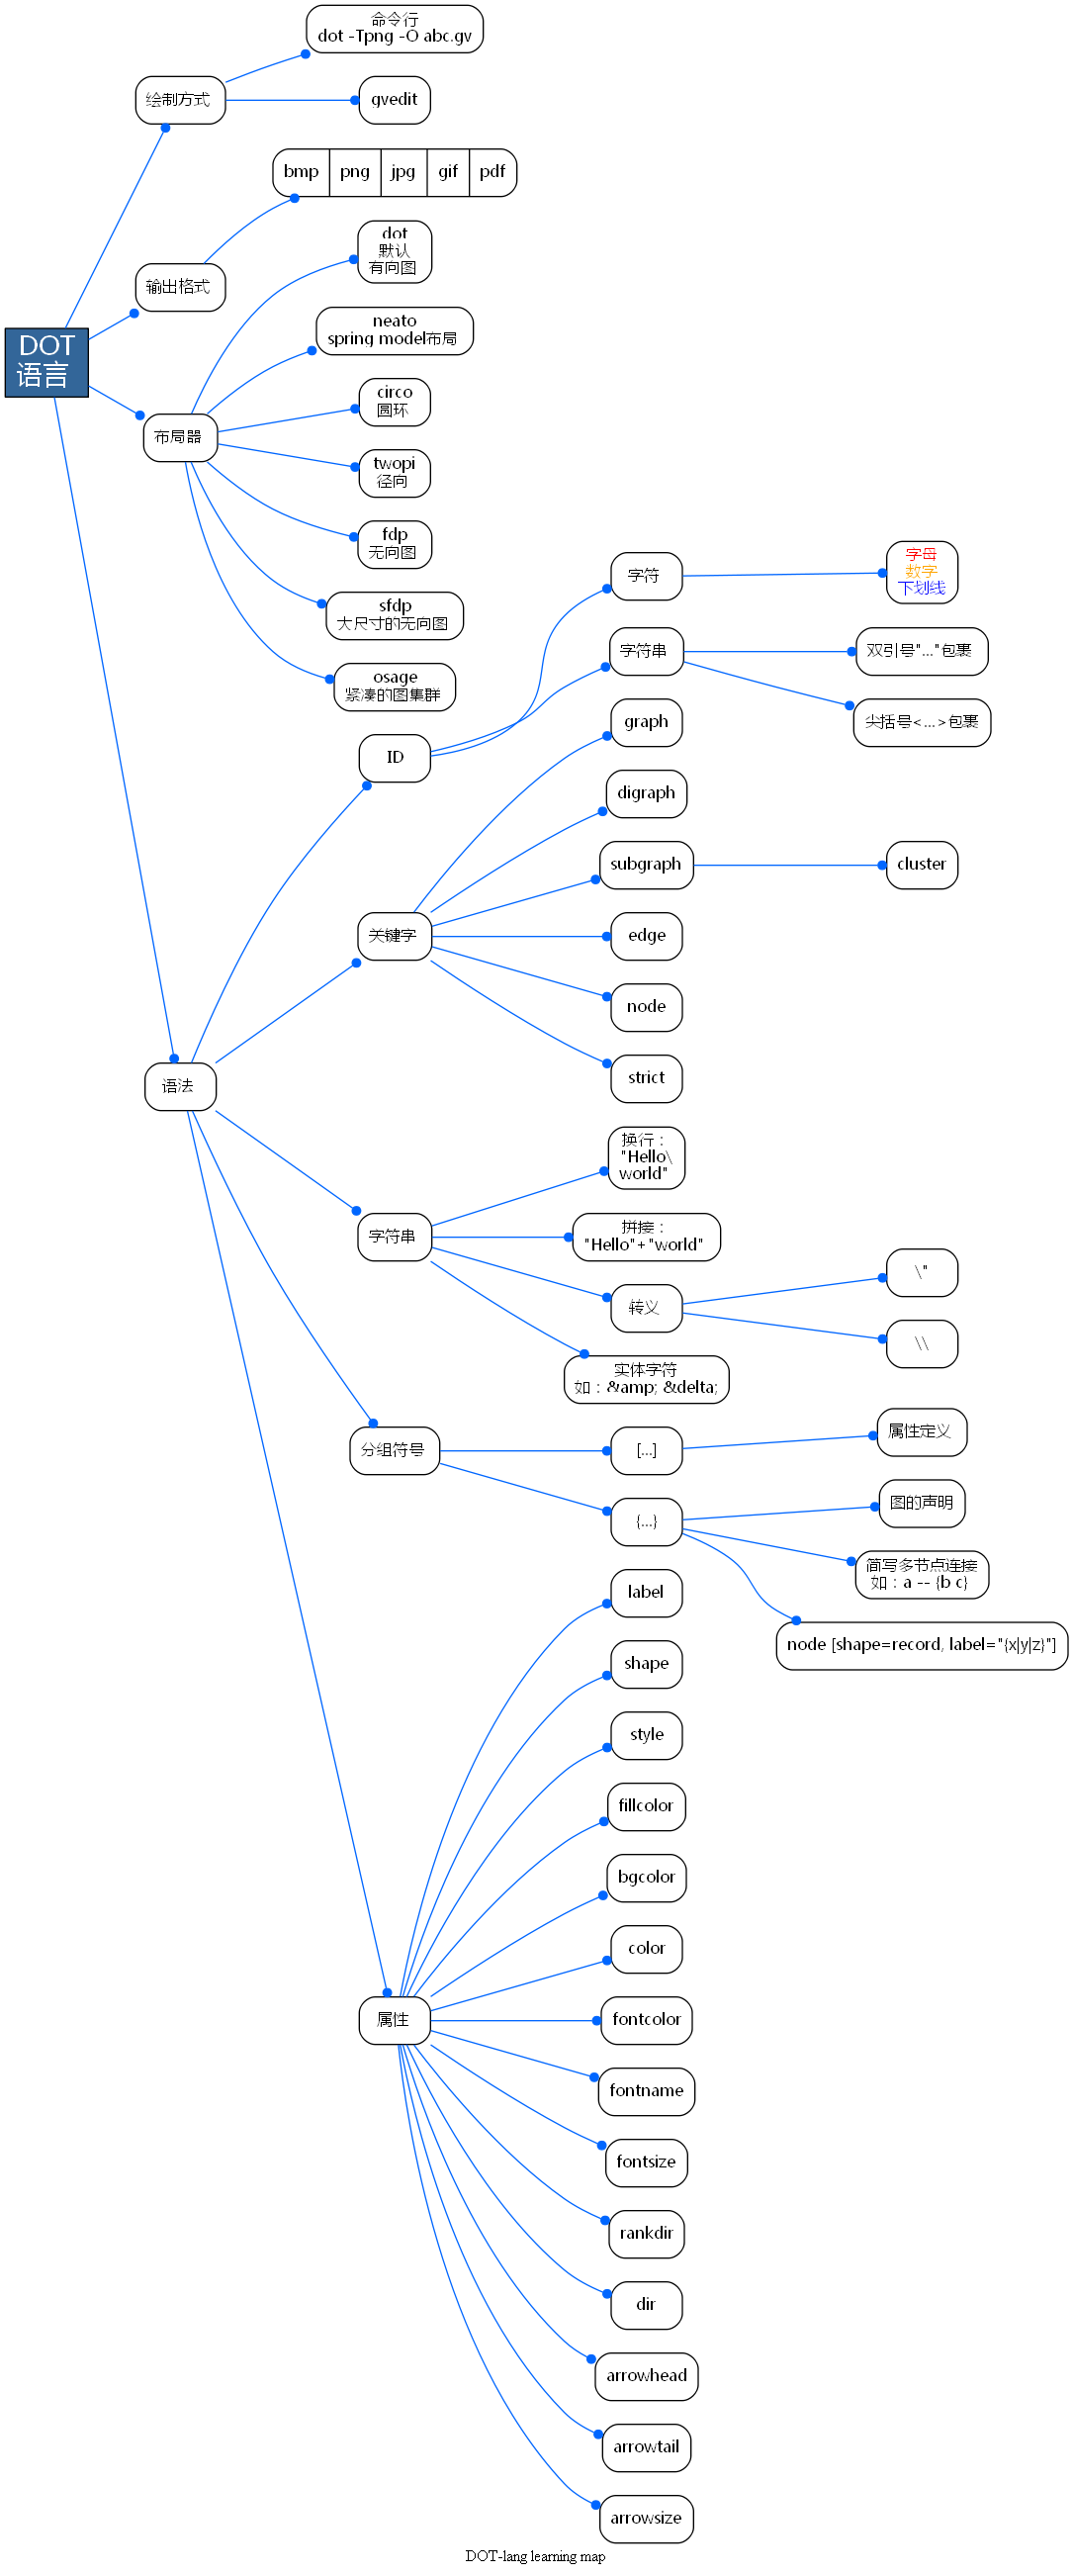
现学现卖,用Graphviz做个思维导图
参考资料
The text was updated successfully, but these errors were encountered: