Skip to content
New issue

Have a question about this project? Sign up for a free GitHub account to open an issue and contact its maintainers and the community.

By clicking “Sign up for GitHub”, you agree to our terms of service and privacy statement. We’ll occasionally send you account related emails.

Already on GitHub? Sign in to your account

Needs brush to resizes to the closest domain value #958

Closed
mo0om opened this issue Aug 4, 2017 · 3 comments
Closed

Needs brush to resizes to the closest domain value #958

mo0om opened this issue Aug 4, 2017 · 3 comments
Labels
question For general questions and clarifications

Comments

@mo0om
Copy link

mo0om commented Aug 4, 2017

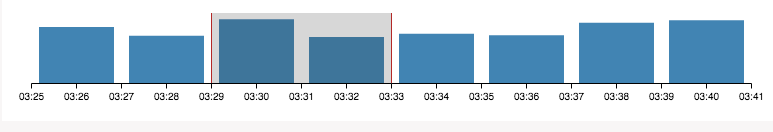
I'm trying to make the brush snaps to the closest domain value like on this example...
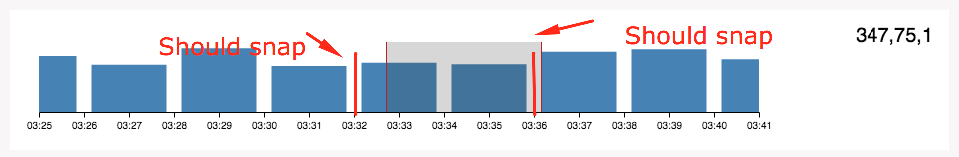
https://bl.ocks.org/mbostock/6232537
image
I believe I need to change the delta value onmouseup but I can't figure out how to pass the mouse x() value to the scale...

"scales": [
    {
      "name": "xband",
      "type": "band",
      "domain": {"data": "graph", "field": "x"},
      "range": "width",
      "padding": 0.05,
      "round": true
    }
  ],
 "signals": [
        {
          "name": "brush", "value": 0,
          "on": [
            {
              "events": "@overview:mousedown",
              "update": "[x(), x()]"
            },
            {
              "events": "[@overview:mousedown, window:mouseup] > window:mousemove!",
              "update": "[brush[0], clamp(x(), 0, width)]"
            },
            {
              "events": {"signal": "delta"},
              "update": "clampRange([anchor[0] + delta, anchor[1] + delta], 0, width)"
            }
          ]
        },
        {
          "name": "anchor", "value": null,
          "on": [{"events": "@brush:mousedown", "update": "slice(brush)"}]
        },
        {
          "name": "xdown", "value": 0,
          "on": [{"events": "@brush:mousedown", "update": "x()"}]
        },
        {
          "name": "delta", "value": 0,
          "on": [
            {
              "events": "[@brush:mousedown, window:mouseup] > window:mousemove!",
              "update": "x() - xdown"
            }
          ]
        },
        {
          "name": "detailDomain",
          "push": "outer",
          "on": [
            {
              "events": {"signal": "brush"},
              "update": "span(brush) ? invert('xOverview', brush) : null"
            }
          ]
        }
      ],
@jheer jheer added the question For general questions and clarifications label Aug 5, 2017
@jheer
Copy link
Member

jheer commented Aug 5, 2017

The linked D3 example uses the following strategy:

  1. Get the x-coordinate value.
  2. Run it through a scale inversion (x.invert) to map from pixel domain to data domain.
  3. Perform "snapping" by rounding / truncating values in the data domain.
  4. Re-apply the x scale to get the snapped pixel coordinate.

You can use the same strategy in Vega within signal expressions.

  • To invert the scale, you can use the invert expression function. For example invert('scaleName', x()).
  • Then perform whatever "rounding" you want to perform in the data domain. To snap to time values, you can apply one of the various datetime expression functions. For example to create a datetime value truncated to the previous day boundary: datetime(year(d), month(d), date(d)).
  • To map data values back to the pixel domain, use the scale expression function. For example scale('scaleName', value).

@mo0om
Copy link
Author

mo0om commented Aug 9, 2017

Thanks Jeffrey, I got it to work. I've pasted the code in case someone would need something similar.
image

{
  "$schema": "https://vega.github.io/schema/vega/v3.0.json",
  "width": 720,
  "height": 70,
  "padding": 5,

  "data": [
     {
      "name": "graph",
      "values":[
        {
          "label": "traffic-statistics.output-bytes",
          "x": 1500492300000,
          "y": 63.87579568625058
        },
        {
          "label": "traffic-statistics.output-bytes",
          "x": 1500492420000,
          "y": 54.14065294117647
        },
        {
          "label": "traffic-statistics.output-bytes",
          "x": 1500492540000,
          "y": 72.7588843137255
        },
        {
          "label": "traffic-statistics.output-bytes",
          "x": 1500492660000,
          "y": 52.708751372572955
        },
        {
          "label": "traffic-statistics.output-bytes",
          "x": 1500492780000,
          "y": 56.16350784313726
        },
        {
          "label": "traffic-statistics.output-bytes",
          "x": 1500492900000,
          "y": 54.5772635293998
        },
        {
          "label": "traffic-statistics.output-bytes",
          "x": 1500493020000,
          "y": 68.9301290195839
        },
        {
          "label": "traffic-statistics.output-bytes",
          "x": 1500493140000,
          "y": 71.75086470588235
        },
        {
          "label": "traffic-statistics.output-bytes",
          "x": 1500493260000,
          "y": 60.39008392160453
        }
      ]
    }
  ],
  "scales": [
    {
      "name": "xband",
      "type": "band",
      "domain": {"data": "graph", "field": "x"},
      "range": "width",
      "padding": 0.05,
      "round": true
    },
    {
      "name": "xOverview",
      "type": "time",
      "range": "width",
      "domain": {"data": "graph", "field": "x"}
    },
    {
      "name": "yOverview",
      "type": "linear",
      "range": [70, 0],
      "domain": {"data": "graph", "field": "y"},
      "nice": true, "zero": true
    }
  ],
  "signals": [
    {
      "name": "detailDomain"
    }
  ],

  "marks": [
    {
      "type": "group",
      "name": "overview",
      "encode": {
        "enter": {
          "x": {"value": 0},
          "y": {"value": 0},
          "height": {"value": 70},
          "width": {"value": 720},
          "fill": {"value": "transparent"}
        }
      },
      "signals": [
        {
          "name": "brush", "value": 0,
          "on": [
            {
              "events": "@overview:mousedown",
              "update": "[scale('xOverview', invert('xband', x()) ) - 8, scale('xOverview', invert('xband', x())) - 8]"
            },
            {
              "events": "[@overview:mousedown, window:mouseup] > window:mousemove!",
              "update": "[brush[0], clamp(scale('xOverview', invert('xband', x())) - 8, -8, width)]"
            },
            {
              "events": {"signal": "delta"},
              "update": "clampRange([anchor[0] + delta, anchor[1] + delta], 0, width)"
            }
          ]
        },
        {
          "name": "anchor", "value": null,
          "on": [{"events": "@brush:mousedown", "update": "slice(brush)"}]
        },
        {
          "name": "xdown", "value": 0,
          "on": [{"events": "@brush:mousedown", "update": "x()"}]
        },
        {
          "name": "delta", "value": 0,
          "on": [
            {
              "events": "[@brush:mousedown, window:mouseup] > window:mousemove!",
              "update": "x() - xdown"
            }
          ]
        },
        {
          "name": "detailDomain",
          "push": "outer",
          "on": [
            {
              "events": {"signal": "brush"},
              "update": "span(brush) ? invert('xOverview', brush) : null"
            }
          ]
        }
      ],
      "axes": [
        {"orient": "bottom", "scale": "xOverview", "position": -8}
      ],
      "marks": [     
         {"type": "group",
          "encode": {
            "enter": {
              "height": {"field": {"group": "height"}},
              "width": {"field": {"group": "width"}},
              "clip": {"value": true}
            }
          },
        "marks": [{
          "type": "rect",
          "from": {"data": "graph"},
          "interactive": false,
          "encode": {
            "update": {
              "x": {"scale": "xOverview", "field": "x"},
              "y": {"scale": "yOverview", "field": "y"},
              "y2": {"scale": "yOverview", "value": 0},
              "width": {"scale": "xband", "band": 1},
              "fill": {"value": "steelblue"}
            }
          }
        }]},
        {
          "type": "rect",
          "name": "brush",
          "interactive": false,
          "encode": {
            "enter": {
              "y": {"value": 0},
              "height": {"value": 70},
              "fill": {"value": "#333"},
              "fillOpacity": {"value": 0.2}
            },
            "update": {
              "x": {"signal": "brush[0]"},
              "x2": {"signal": "brush[1]"}
            }
          }
        },
        {
          "type": "rect",
          "interactive": false,
          "encode": {
            "enter": {
              "y": {"value": 0},
              "height": {"value": 70},
              "width": {"value": 1},
              "fill": {"value": "firebrick"}
            },
            "update": {
              "x": {"signal": "brush[0]"}
            }
          }
        },
        {
          "type": "rect",
          "interactive": false,
          "encode": {
            "enter": {
              "y": {"value": 0},
              "height": {"value": 70},
              "width": {"value": 1},
              "fill": {"value": "firebrick"}
            },
            "update": {
              "x": {"signal": "brush[1]"}
            }
          }
        }
      ]
    }
  ]
}

@jheer
Copy link
Member

jheer commented Aug 9, 2017

Glad it worked out. Thanks for sharing!

Sign up for free to join this conversation on GitHub. Already have an account? Sign in to comment
Labels
question For general questions and clarifications
Projects
None yet
Development

No branches or pull requests

2 participants