/
Intro-to-vosonSML.Rmd
1345 lines (1087 loc) · 59.7 KB
/
Intro-to-vosonSML.Rmd
1
2
3
4
5
6
7
8
9
10
11
12
13
14
15
16
17
18
19
20
21
22
23
24
25
26
27
28
29
30
31
32
33
34
35
36
37
38
39
40
41
42
43
44
45
46
47
48
49
50
51
52
53
54
55
56
57
58
59
60
61
62
63
64
65
66
67
68
69
70
71
72
73
74
75
76
77
78
79
80
81
82
83
84
85
86
87
88
89
90
91
92
93
94
95
96
97
98
99
100
101
102
103
104
105
106
107
108
109
110
111
112
113
114
115
116
117
118
119
120
121
122
123
124
125
126
127
128
129
130
131
132
133
134
135
136
137
138
139
140
141
142
143
144
145
146
147
148
149
150
151
152
153
154
155
156
157
158
159
160
161
162
163
164
165
166
167
168
169
170
171
172
173
174
175
176
177
178
179
180
181
182
183
184
185
186
187
188
189
190
191
192
193
194
195
196
197
198
199
200
201
202
203
204
205
206
207
208
209
210
211
212
213
214
215
216
217
218
219
220
221
222
223
224
225
226
227
228
229
230
231
232
233
234
235
236
237
238
239
240
241
242
243
244
245
246
247
248
249
250
251
252
253
254
255
256
257
258
259
260
261
262
263
264
265
266
267
268
269
270
271
272
273
274
275
276
277
278
279
280
281
282
283
284
285
286
287
288
289
290
291
292
293
294
295
296
297
298
299
300
301
302
303
304
305
306
307
308
309
310
311
312
313
314
315
316
317
318
319
320
321
322
323
324
325
326
327
328
329
330
331
332
333
334
335
336
337
338
339
340
341
342
343
344
345
346
347
348
349
350
351
352
353
354
355
356
357
358
359
360
361
362
363
364
365
366
367
368
369
370
371
372
373
374
375
376
377
378
379
380
381
382
383
384
385
386
387
388
389
390
391
392
393
394
395
396
397
398
399
400
401
402
403
404
405
406
407
408
409
410
411
412
413
414
415
416
417
418
419
420
421
422
423
424
425
426
427
428
429
430
431
432
433
434
435
436
437
438
439
440
441
442
443
444
445
446
447
448
449
450
451
452
453
454
455
456
457
458
459
460
461
462
463
464
465
466
467
468
469
470
471
472
473
474
475
476
477
478
479
480
481
482
483
484
485
486
487
488
489
490
491
492
493
494
495
496
497
498
499
500
501
502
503
504
505
506
507
508
509
510
511
512
513
514
515
516
517
518
519
520
521
522
523
524
525
526
527
528
529
530
531
532
533
534
535
536
537
538
539
540
541
542
543
544
545
546
547
548
549
550
551
552
553
554
555
556
557
558
559
560
561
562
563
564
565
566
567
568
569
570
571
572
573
574
575
576
577
578
579
580
581
582
583
584
585
586
587
588
589
590
591
592
593
594
595
596
597
598
599
600
601
602
603
604
605
606
607
608
609
610
611
612
613
614
615
616
617
618
619
620
621
622
623
624
625
626
627
628
629
630
631
632
633
634
635
636
637
638
639
640
641
642
643
644
645
646
647
648
649
650
651
652
653
654
655
656
657
658
659
660
661
662
663
664
665
666
667
668
669
670
671
672
673
674
675
676
677
678
679
680
681
682
683
684
685
686
687
688
689
690
691
692
693
694
695
696
697
698
699
700
701
702
703
704
705
706
707
708
709
710
711
712
713
714
715
716
717
718
719
720
721
722
723
724
725
726
727
728
729
730
731
732
733
734
735
736
737
738
739
740
741
742
743
744
745
746
747
748
749
750
751
752
753
754
755
756
757
758
759
760
761
762
763
764
765
766
767
768
769
770
771
772
773
774
775
776
777
778
779
780
781
782
783
784
785
786
787
788
789
790
791
792
793
794
795
796
797
798
799
800
801
802
803
804
805
806
807
808
809
810
811
812
813
814
815
816
817
818
819
820
821
822
823
824
825
826
827
828
829
830
831
832
833
834
835
836
837
838
839
840
841
842
843
844
845
846
847
848
849
850
851
852
853
854
855
856
857
858
859
860
861
862
863
864
865
866
867
868
869
870
871
872
873
874
875
876
877
878
879
880
881
882
883
884
885
886
887
888
889
890
891
892
893
894
895
896
897
898
899
900
901
902
903
904
905
906
907
908
909
910
911
912
913
914
915
916
917
918
919
920
921
922
923
924
925
926
927
928
929
930
931
932
933
934
935
936
937
938
939
940
941
942
943
944
945
946
947
948
949
950
951
952
953
954
955
956
957
958
959
960
961
962
963
964
965
966
967
968
969
970
971
972
973
974
975
976
977
978
979
980
981
982
983
984
985
986
987
988
989
990
991
992
993
994
995
996
997
998
999
1000
---
title: "Introduction to vosonSML"
subtitle: "VOSON Lab, Australian National University"
date: "`r format(Sys.time(), '%d %B, %Y')`"
author: Robert Ackland, Bryan Gertzel, Francisca Borquez
authors:
- name: Robert Ackland
affiliation: 1
- name: Bryan Gertzel
affiliation: 1
- name: Francisca Borquez
affiliation: 1
affiliations:
- name: VOSON Lab, Australian National University
index: 1
output: rmarkdown::html_vignette
vignette: >
%\VignetteEngine{knitr::rmarkdown}
%\VignetteIndexEntry{Introduction to vosonSML}
%\VignetteEncoding{UTF-8}
---
The following guide provides an introduction to using [vosonSML](https://github.com/vosonlab/vosonSML), which is
available both on GitHub and [CRAN](https://cran.r-project.org/package=vosonSML). More resources are available on the
VOSON Lab website ([vosonSML](http://vosonlab.net/socialmedialab) and [training
materials](http://vosonlab.net/resources_training)). For a full list of functions, please refer to the [reference
page](https://vosonlab.github.io/vosonSML/reference/index.html). The companion package to `vosonSML` is [VOSON
Dashboard](https://github.com/vosonlab/VOSONDash), which provides an R/Shiny graphical user interface for data
collection (via `vosonSML`), network and text analysis.
To use `vosonSML`, you first need to load it into the session:
```{r eval=FALSE}
library(vosonSML)
```
There are three steps involved in data collection and network creation using `vosonSML`. These are:
1. *Authenticate* with the platform API, using the function `Authenticate()`
2. *Collect* data from the API and store it for later use, using `Collect()`
3. *Create* networks from the collected data, using `Create()` and `Graph()`
# Twitter
## Authenticating with the Twitter API
The first step is to authorise access to the Twitter API. This requires completion of an application and approval for
[Twitter Developer access](https://developer.twitter.com/en/apply-for-access). Once the application has been approved
then the Twitter Developer Portal will become available and a new "Standalone App" can be created. Creation of an app
allows keys to be generated through which software such as `vosonSML` can access and collect data from the Twitter v1.1
API.
`vosonSML` is only concerned with reading Twitter data, so a full range of typical third-party app `user` or `bot`
functions are not required. The ideal type of authentication for read-only access is `application` based authentication
with a `bearer` token that can be generated and found under the `Authentication Tokens` section of a developers app
project on the Developer Portal. This type of token has higher tweet collection rate-limits than other methods but less
permissions. With a `bearer` token the Twitter authentication object can be set as follows:
```{r eval=FALSE}
twitterAuth <- Authenticate("twitter", bearerToken = "xxxxxxxxxxxx")
```
A `developer` access token can also be created by using all of the developer keys generated for an app. This type of
access is suited to automated software such as `bots` that are required to undertake a range of read and write Twitter
activities. A `developer` access token is not required for `vosonSML` but can be used if desired, it will however have
lower rate-limits than the `bearer` token:
```{r eval=FALSE}
twitterAuth <- Authenticate(
"twitter",
appName = "My App",
apiKey = "xxxxxxxx",
apiSecret = "xxxxxxxx",
accessToken = "xxxxxxxx",
accessTokenSecret = "xxxxxxxx"
)
```
There is also a `user` based access method available in which a Twitter user can permit an app to access the API on
their behalf. This is the method third-party Twitter clients use to allow users to perform Twitter functions such as
posting tweets with their software. When authorizing the software to their account the user will be informed of the
scope of permissions they are granting to the app. This method has the advantage of per-user rather than application
rate-limits. This method is currently only available to be used with `vosonSML` if the user has access to an app `API
key` and `API secret`:
```{r eval=FALSE}
twitterAuth <- Authenticate(
"twitter",
appName = "An App",
apiKey = "xxxxxxxxxxxx",
apiSecret = "xxxxxxxxxxxx"
)
```
In all cases, Twitter authentication creates an authentication object with access token that can be re-used in the
future by saving it to disk:
```{r eval=FALSE}
saveRDS(twitterAuth, file = "twitter_auth")
```
The following loads into the current session a previously-created authentication object:
```{r eval=FALSE}
twitterAuth <- readRDS("twitter_auth")
```
## Collecting Data from Twitter
The syntax for collecting Twitter data follow [Twitter's rules and filtering
documentation](https://developer.twitter.com/en/docs/twitter-api/tweets/search/integrate/build-a-query). It is possible
to collect tweets including particular terms (e.g. hashtags), and boolean searches (see
[standard search operators](https://developer.twitter.com/en/docs/twitter-api/v1/rules-and-filtering/search-operators))
are also possible. The collection may be filtered by, for example, type of Twitter activity (e.g. to include retweets
only), number of collected tweets, language of tweet. As an example, the following collects 1000 recent tweets
containing the '#auspol' hashtag (a prominent hashtag for Australian politics), with retweets not being collected.
```{r eval=FALSE}
twitterData <- twitterAuth |>
Collect(
searchTerm = "#auspol",
numTweets = 1000,
includeRetweets = FALSE,
writeToFile = TRUE,
verbose = TRUE
)
```
The `Collect()` function takes the following arguments (when used for collecting Twitter data): `credential` (object
generated from `Authenticate()` with class name "twitter"(above we pass this via the pipe), `searchTerm` (character
string that specifies a Twitter search term), `searchType` (character string indicating how to filter returned tweets
with options 'recent', 'mixed' or 'popular'; default type is 'recent'), `numTweets` (numeric vector that specifies how
many tweets to be collected; default is 100), `includeRetweets` (whether the search should filter out retweets or not;
default is TRUE), `retryOnRateLimit` (whether to automatically pause collection when the Twitter API rate limit is
reached, and then restart; default is FALSE.), `writeToFile` (whether to write the returned dataframe to disk as an
`.rds` file; default is FALSE), and `verbose` (whether to output information about the data collection; default is
FALSE).
The `Collect()` function returns a tibble (an enhanced dataframe which has features that can make working with the data
easier). We can view the data we just collected (the following has been modified to anonymise the data):
```{r eval=FALSE}
> twitterData$tweets
# A tibble: 999 x 90
user_id status_id created_at screen_name text source
<chr> <chr> <dttm> <chr> <chr> <chr>
1 xxxxxx… xxxxxxxx… 2020-01-09 12:02:13 xxxx "htt… Twitt…
2 xxxxxx… xxxxxxxx… 2020-01-09 12:01:32 xxxxxxxxx "Fir… Twitt…
3 xxxxxx… xxxxxxxx… 2020-01-09 12:00:44 xxxxxxxxxxx "Ser… Twitt…
[snip]
… with 989 more rows, and 84 more variables: display_text_width <dbl>,
...
```
### Importing Twitter Data
If you are reading a previously saved `writeToFile` Twitter dataframe from disk, you simply need to use the `readRDS`
function:
```{r eval=FALSE}
twitterData <- readRDS("2020-09-26_095354-TwitterData.rds")
```
As `vosonSML` uses `rtweet` for data collection you can also import `rtweet` tweet data from dataframe or `.RDS` file
using `ImportRtweet()`:
``` r
# from dataframe
tweets <- rtweet::search_tweets("#auspol", n = 100)
twitterData <- tweets |> ImportRtweet()
# or from file
twitterData <- ImportRtweet("rtweet_search_n100.rds")
```
## Creating Twitter Networks
It is currently possible to create four types of networks using Twitter data: (1) *actor network*; (2) *activity
network*; (3) *2-mode network* and (4) *semantic network*.
### Actor Network
In the Twitter *actor network*, nodes are users who have either tweeted using the target search terms (#auspol in the
above example) or else are mentioned or replied to in tweets featuring the search terms. Edges represent interactions
between Twitter users, and an edge attribute indicates whether the interaction is a mention, reply, retweet, quoted
retweet or self-loop. Self-loop edges are created in two situations: (1) a user authors a tweet and mentions or replies
to themself; (2) a user authors a tweet containing the search term, but does not mention or reply to any other user in
that tweet.
```{r eval=FALSE}
actorNetwork <- twitterData |>
Create("actor", writeToFile = TRUE, verbose = TRUE)
actorGraph <- actorNetwork |> Graph(writeToFile = TRUE, verbose = TRUE)
```
`Create("actor")` returns a named list containing two dataframes named "nodes" and "edges" (the following has been
modified to preserve anonymity):
```{r eval=FALSE}
> actorNetwork
$edges
# A tibble: 1,725 x 5
from to edge_type timestamp status_id
<fct> <fct> <fct> <fct> <fct>
1 xxxxxxxx xxxxxxxx quote 2020-01-09 12:00… xxxxxxxxxxxx…
2 xxxxxxxx xxxxxxxxx quote 2020-01-09 09:37… xxxxxxxxxxxx…
[snip]
# … with 1,715 more rows
$nodes
# A tibble: 1,158 x 2
user_id screen_name
<fct> <fct>
1 xxxxxxxx xxxx
2 xxxxxxxx xxxxxxxxx
[snip]
# … with 1,148 more rows
attr(,"class")
[1] "list" "network" "actor" "twitter"
```
This list is then passed to `Graph()`, which returns an `igraph` graph object, and in the above example, the
`writeToFile` parameter is used to write the graph to file in `GraphML` format. The following shows a summary of the
graph:
```{r eval=FALSE}
> actorGraph
IGRAPH bc177a6 DN-- 1158 1725 --
+ attr: type (g/c), name (v/c), screen_name (v/c), label (v/c),
| edge_type (e/c), timestamp (e/c), status_id (e/c)
+ edges from bc177a6 (vertex names):
[1] xxxxxxxx ->xxxxxxxx
[2] xxxxxxxx ->xxxxxxxxx
[snip]
+ ... omitted several edges
```
The Twitter actor network contains a graph attribute `type` which is set to "twitter" (this attribute is required for
`VOSON Dashboard`). The following node attributes are collected from the Twitter profile data: `name` (Twitter ID),
`screen_name` (Twitter handle or screen name) and `label` (a concatenation of the ID and screen name). The edge
attributes are: `edge_type` (whether the edge is a mention, reply, retweet, quoted retweet or self-loop), `timestamp`
(when the tweet that led to the creation of the edge was authored) and `status_id` (the Twitter ID for the tweet).
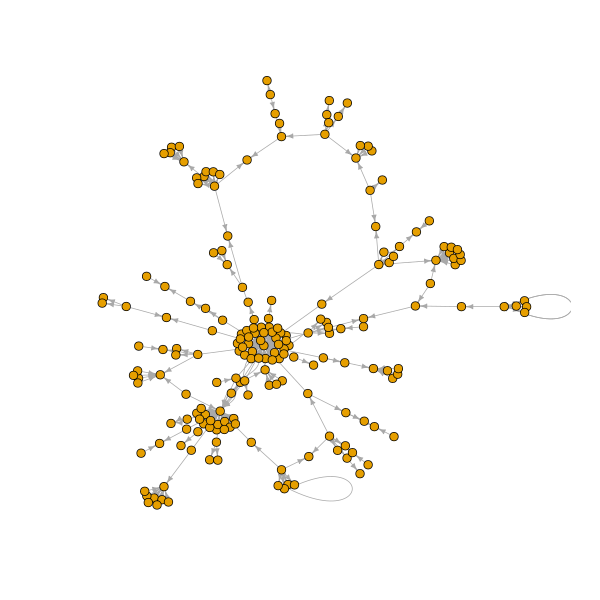
The example actor network contains 1158 nodes and 1725 edges. The following code uses `igraph` functions to: (1) remove
all edges other than reply edges; (2) construct a subnetwork consisting of the giant component (the largest set of
connected nodes); (3) plot this network.
```{r eval=FALSE}
library(igraph)
# remove edges that are not reply edges
g2 <- delete.edges(actorGraph, which(E(actorGraph)$edge_type != "reply"))
# get the giant component
cc <- clusters(g2)
g2 <- induced_subgraph(g2, which(cc$membership == which.max(cc$csize)))
# open and write plot to a png file
png("twitter_actor_reply_gc.png", width = 600, height = 600)
plot(g2, vertex.label = "", vertex.size = 4, edge.arrow.size = 0.5)
dev.off()
```
It is often useful to have the tweet text content in the network. This can be achieved by using the `status_id` edge
attribute to pull the tweet text content from the dataframe returned by `Collect()`, and store it as an edge attribute.
`vosonSML` makes this easy with the `AddText()` function, with the following example creating a graph with an edge
attribute `vosonTxt_tweet` which stores the tweet text content.
```{r eval=FALSE}
actorGraphWithText <- twitterData |>
Create("actor") |> AddText(twitterData) |> Graph()
```
Now we have tweet text content stored as an edge attribute, we can use it for text analysis or creating new node
attributes. As an example, the following creates a new node attribute `tweetedBushfires` which has the value "yes" if
the Twitter user authored at least one tweet containing the word "bushfire" and "no" otherwise.
```{r eval=FALSE}
# get the index of nodes or users who tweeted the word "bushfire"
ind <- tail_of(
actorGraphWithText,
grep("bushfire", tolower(E(actorGraphWithText)$vosonTxt_tweet))
)
# set node attribute
V(actorGraphWithText)$tweetedBushfires <- "no"
V(actorGraphWithText)$tweetedBushfires[ind] <- "yes"
```
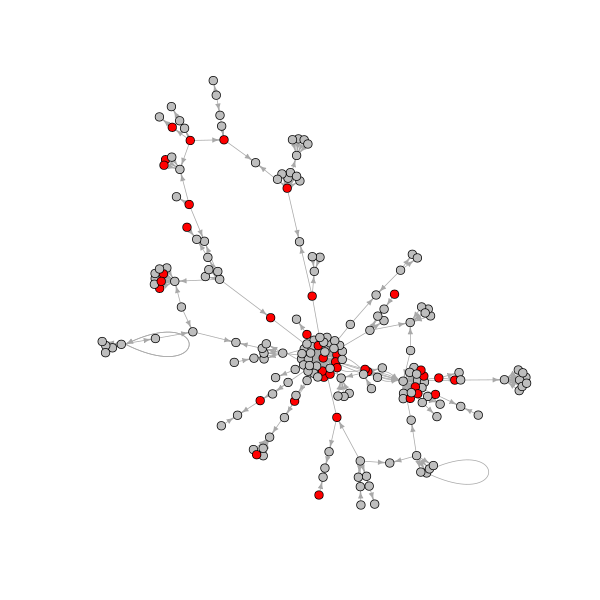
The following creates and plots the giant component in the reply network, with red nodes indicating those users who
tweeted using the term "bushfire".
```{r eval=FALSE}
# remove edges that are not reply edges
g3 <- delete.edges(
actorGraphWithText, which(E(actorGraphWithText)$edge_type != "reply")
)
# get the giant component
cc <- clusters(g3)
g3 <- induced_subgraph(g3, which(cc$membership == which.max(cc$csize)))
# set node colour based on tweeted bushfires attribute value
V(g3)$color <- ifelse(V(g3)$tweetedBushfires == "yes", "red", "grey")
# open and write plot to a png file
png("twitter_actor_reply_gc_bushfires.png", width = 600, height = 600)
plot(g3, vertex.label = "", vertex.size = 4, edge.arrow.size = 0.5)
dev.off()
```
The `igraph` graph object can then be saved to disk as a `GraphML` file using the `igraph` function `write.graph`, and
later imported into network analysis software such as `igraph`, `VOSON Dashboard` and [Gephi](https://gephi.org/):
```{r eval=FALSE}
# save the graph as a graphml file
write.graph(g3, "twitter_reply_gc_bushfires.graphml", format = "graphml")
```
Finally, the `AddUserData()` function can be used to create additional node attributes from the Twitter profile, for
example, number of followers and number of tweets authored by the user.
Note that by default, `vosonSML` will only collect Twitter profile data for those users who authored tweets that have
been collected. That is, in the above example, profile data will not be collected (by default) for a user who was
mentioned in a tweet that contained #auspol, but did not author such a tweet. The `lookupUsers` argument can be used to
make additional Twitter API calls and collect the profile data for mentioned users whose profile data is absent, so that
their additional profile attributes can also be added:
```{r eval=FALSE}
# create an actor network with user metadata
actorGraphWithUserAttr <- actorNetwork |>
AddUserData(twitterData, lookupUsers = TRUE, twitterAuth = twitterAuth) |>
Graph(writeToFile = TRUE)
```
### Activity Network
In the Twitter *activity network*, nodes represent tweets and edge types are: replies, retweets and quoted retweets.
```{r eval=FALSE}
# create an activity network with tweet text
activityNetwork <- twitterData |> Create("activity") |> AddText(twitterData)
activityGraph <- activityNetwork |> Graph(writeToFile = TRUE)
```
`Create("activity")` returns a named list containing two dataframes named "nodes" and "edges" (the following has been
modified to preserve anonymity):
```{r eval=FALSE}
> activityNetwork
$nodes
# A tibble: 1,408 x 5
status_id user_id screen_name created_at vosonTxt_tweet
<chr> <chr> <chr> <chr> <chr>
1 xxxxxxxxxxx… xxxxxxxx xxxx 2020-01-09 … "xxxxxxxxxxxxxxxxxxxxx…
2 xxxxxxxxxxx… xxxxxxxx xxxxxxxxx 2020-01-09 … "xxxxxxxxxxxxxxxxxxxxx…
[snip]
# … with 1,398 more rows
$edges
# A tibble: 662 x 3
from to edge_type
<chr> <chr> <chr>
1 xxxxxxxxxxxxxxxxxxx xxxxxxxxxxxxxxxxxxx quote
2 xxxxxxxxxxxxxxxxxxx xxxxxxxxxxxxxxxxxxx quote
[snip]
# … with 652 more rows
attr(,"class")
[1] "list" "network" "activity" "twitter" "voson_text"
```
Note that in the above, `AddText()` was used to add the comment text data to the network dataframe, stored as a node
attribute. This list is then passed to `Graph()`, which returns an `igraph` graph object (the following has been
anonymised):
```{r eval=FALSE}
> activityGraph
IGRAPH e60c486 DN-- 1408 662 --
+ attr: type (g/c), name (v/c), user_id (v/c), screen_name (v/c),
| created_at (v/c), vosonTxt_tweet (v/c), label (v/c), edge_type (e/c)
+ edges from e60c486 (vertex names):
[1] xxxx->xxxx
[2] xxxx->xxxx
[snip]
+ ... omitted several edges
```
The Twitter activity network contains a graph attribute `type` (set to "twitter"). The node attributes are: `name`
(Twitter ID for the tweet), `user_id` (Twitter ID for the user who authored the tweet), `screen_name` (Twitter handle or
screen name of the user who authored the tweet), `created_at` (timestamp when the tweet was authored), `vosonTxt_tweet`
(text content of the tweet) and `label` (a concatenation of `name` and `user_id`). The edge attribute is `edge_type`
which can have the value 'reply', 'retweet' or 'quote'.
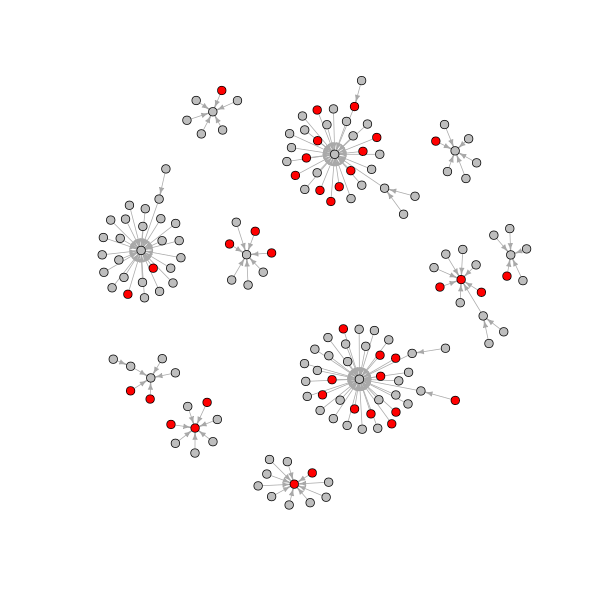
The example Twitter activity network contains 1408 nodes and 662 edges. The following is a visualization of the network,
where nodes are tweets and tweets mentioning bushfires are indicated in red.
```{r eval=FALSE}
# create a subgraph containing nodes of components that have more than 5 nodes
cc <- clusters(activityGraph)
g4 <- induced_subgraph(
activityGraph,
which(cc$membership %in% which(cc$csize > 5))
)
# set node colour based on if tweet contains the word "bushfire"
ind <- grep("bushfire", tolower(V(g4)$vosonTxt_tweet))
V(g4)$color <- "grey"
V(g4)$color[ind] <- "red"
# open and write plot to a png file
png("twitter_activity.png", width = 600, height = 600)
plot(g4, vertex.label = "", vertex.size = 4, edge.arrow.size = 0.5)
dev.off()
```
It should be noted that a limitation of the Twitter API is that retweet chains are not provided. This means that if user
*i* tweeted an original tweet, and then user *j* retweeted this tweet, and user *k* retweeted *j*'s retweet, the
activity network will show edges connecting the two retweets to the original tweet.
### 2-mode Network
In the Twitter *2-mode network*, the two types of nodes are actors (Twitter users) and hashtags. There is an edge from
user *i* to hashtag *j* if user *i* authored a tweet containing hashtag *j*.
```{r eval=FALSE}
# create a 2-mode network with the hashtag "#auspol" removed
twomodeNetwork <- twitterData |>
Create("twomode", removeTermsOrHashtags = c("#auspol"))
twomodeGraph <- twomodeNetwork |> Graph()
```
`Create("twomode")` returns a named list containing two dataframes named "nodes" and "edges" (the following has been
modified to preserve anonymity). Note that in this example, the `removeTermsOrHashtags` argument was used to exclude
'#auspol', since by construction all tweets contained this hashtag.
```{r eval=FALSE}
> twomodeNetwork
$nodes
# A tibble: 1,146 x 2
entity_id display_name
<chr> <chr>
1 xxxxxxxx xxxx
2 xxxxxxxx xxxxxxxxx
3 #auspol2020 #auspol2020
4 #australianbushfiredisaster #australianbushfiredisaster
[snip]
# … with 1,136 more rows
$edges
# A tibble: 1,675 x 5
from to edge_type timestamp status_id
<fct> <fct> <fct> <fct> <fct>
1 xxxxxxxx #auspol2020 hashtag 2020-01-09 12:0… xxxxxxxxxxxx…
2 xxxxxxxx #australianbushfiredis… hashtag 2020-01-09 12:0… xxxxxxxxxxxx…
[snip]
# … with 1,665 more rows
attr(,"class")
[1] "list" "network" "twomode" "twitter"
```
This list is then passed to `Graph()`, which returns an `igraph` graph object (this has been anonymised):
```{r eval=FALSE}
> twomodeGraph
IGRAPH 68bd240 DN-- 1146 1675 --
+ attr: type (g/c), name (v/c), display_name (v/c), label (v/c),
| edge_type (e/c), timestamp (e/c), status_id (e/c)
+ edges from 68bd240 (vertex names):
[1] xxxx -> #auspol2020
[2] xxxx -> #australianbushfiredisaster
[snip]
+ ... omitted several edges
```
The Twitter 2-model network has a graph attribute `type` (set to "twitter"). The node attributes are: `name` (hashtag or
Twitter user ID), `display_name` (hashtag or Twitter handle or screen name), `label` (for users, a concatenation of
`name` and `display_name`, while for hashtags it is `name`). The edge attributes are: `edge_type` ('hashtag'),
`timestamp` (timestamp of the tweet that led to the edge), `status_id` (Twitter ID of the tweet that led to the edge).
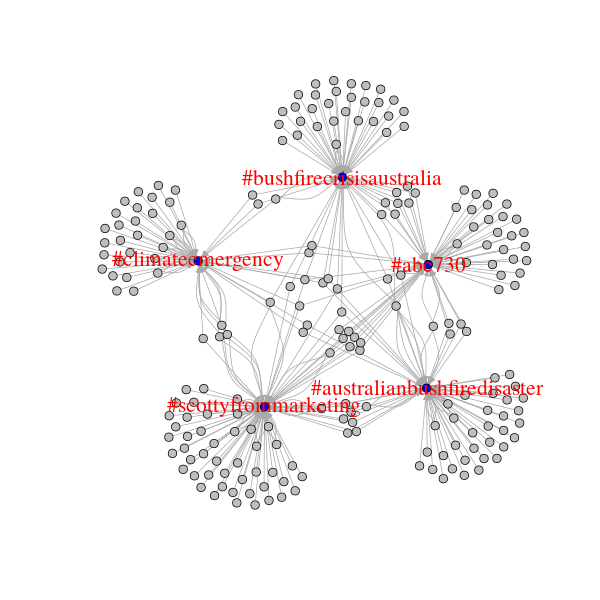
```{r eval=FALSE}
# get index of nodes that are in the top 5 by highest in-degree
# this is the top 5 used hashtags, as all users have 0 in-degree
# in this network
ind <- order(degree(twomodeGraph, mode = "in"), decreasing = TRUE)[1:5]
# get index of nodes with an edge directed to the top 5 hashtags
# this is users who have tweeted with these hashtags
ind2 <- unlist(
lapply(ind, function(x) neighbors(twomodeGraph, x, mode = "in"))
)
# create a subgraph containing only the top 5 used hashtags and related users
g5 <- induced_subgraph(twomodeGraph, c(ind, as.numeric(ind2)))
# set node colour and label based on in-degree
# only hashtag nodes are set to blue and with label attribute set
V(g5)$color <- "grey"
V(g5)$color[which(degree(g5, mode = "in") > 0)] <- "blue"
V(g5)$label2 <- ifelse(degree(g5, mode = "in") > 0, V(g5)$label, "")
# open and write plot to a png file
png("twitter_twomode.png", width = 600, height = 600)
plot(g5, vertex.label = V(g5)$label2, vertex.size = 4, edge.arrow.size = 0.5,
vertex.label.cex = 1.8, vertex.label.color = "red")
dev.off()
```
### Semantic Network
In the Twitter *semantic network*, nodes represent entities extracted from the tweet text: common words, hashtags and
usernames. Edges reflect co-occurrence i.e. there is an edge between entities *i* and *j* if they both occurred in the
same tweet.
```{r eval=FALSE}
# additional required packages for tokenization
install.packages("stopwords")
# create a semantic network with some common terms removed
# include only the top 5% occurring terms in the network
semanticNetwork <- twitterData |> Create(
"semantic",
removeTermsOrHashtags = c("#auspol", "auspol", "australia"),
termFreq = 5
)
# create an undirected graph
semanticGraph <- semanticNetwork |> Graph(directed = FALSE)
```
`Create("semantic")` returns a named list containing two dataframes named "nodes" and "edges":
```{r eval=FALSE}
> semanticNetwork
$nodes
# A tibble: 799 x 1
value
<fct>
1 just
2 one
3 fire
4 going
5 still
6 hard
7 trying
8 since
9 try
10 sick
# … with 789 more rows
$edges
# A tibble: 10,990 x 3
from to weight
<fct> <fct> <int>
1 #auspol2020 #australianbushfiredisaster 2
2 #auspol2020 government 2
3 #auspol2020 fire 4
4 #auspol2020 australian 2
5 #auspol2020 bushfire 2
6 #auspol2020 fires 4
7 #auspol2020 #australiafires 1
8 #auspol2020 #australianbushfiresdisaster 1
9 #auspol2020 #australia 4
10 #auspol2020 bushfires 2
# … with 10,980 more rows
attr(,"class")
[1] "list" "network" "semantic" "twitter"
```
The `removeTermsOrHashtags` argument is used to exclude terms that we can expect to occur frequently (e.g. because of
the parameters used for the data collection). The `termFreq` parameter is used to limit the network to the top 5 percent
most frequently occurring entities.
This list is then passed to `Graph()`, which returns an `igraph` graph object:
```{r eval=FALSE}
> semanticGraph
IGRAPH cb8c381 UNW- 799 10990 --
+ attr: type (g/c), name (v/c), label (v/c), weight (e/n)
+ edges from cb8c381 (vertex names):
[1] #australianbushfiredisaster --#auspol2020
[2] government --#auspol2020
[3] fire --#auspol2020
[4] australian --#auspol2020
[5] bushfire --#auspol2020
[6] fires --#auspol2020
[7] #australiafires --#auspol2020
[8] #australianbushfiresdisaster--#auspol2020
+ ... omitted several edges
```
The Twitter semantic network node contains a graph attribute `type` (set to "twitter"). The node attributes are: `name`
(the entity i.e. hashtag or word), `label` (same as `name`). The edge attribute is `weight` (how many tweets the two
entities co-occurred in).
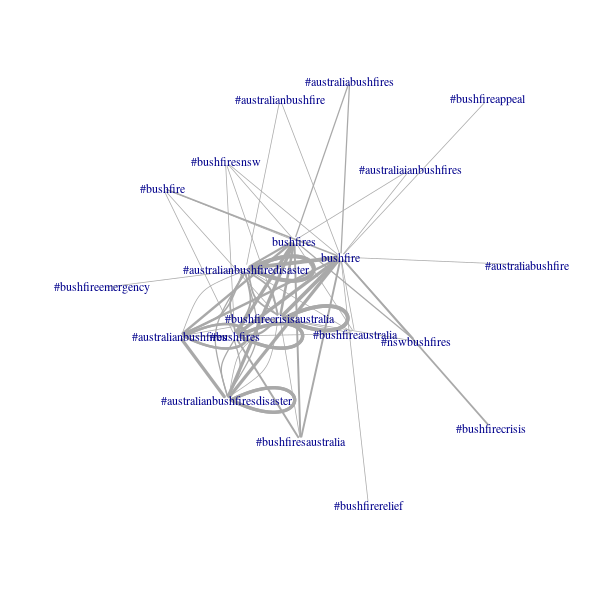
The example Twitter semantic network has 799 nodes and 10990 edges. The following produces a visualisation of
subnetwork of terms that contain the string "bushfire":
```{r eval=FALSE}
# get index of the nodes whose term contains "bushfire"
ind <- grep("bushfire", tolower(V(semanticGraph)$name))
# create a subgraph containing only bushfire terms
g6 <- induced_subgraph(semanticGraph, ind)
# open and write plot to a png file
# plotted with large-graph-layout algorithm and edge weights
png("twitter_semantic.png", width = 600, height = 600)
plot(g6, layout = layout_with_lgl(g6), vertex.shape = "none", vertex.size = 4,
edge.width = 1 + log(E(g2)$weight))
dev.off()
```
# YouTube
## Authenticating with the YouTube API
To collect YouTube data, it is necessary to first create a Google app with access to the YouTube Data API via the
[Google APIs console](https://console.developers.google.com/apis) and generate an associated API key. The following
shows the creation of a YouTube access token by passing a Google developer API key to the `Autnenticate()` function:
```{r eval=FALSE}
# create auth object with api key
youtubeAuth <- Authenticate("youtube", apiKey = "xxxxxxxx")
```
As with the Twitter example above, the YouTube access token can optionally be saved to disk for use in a later session.
## Collecting Data from YouTube
The YouTube video IDs (the part after "=" in the YouTube URL) are required in order to collect YouTube comment data.
These IDs can either be manually provided or automatically extracted from the URLs:
```{r eval=FALSE}
videoIDs <- c(
"xxxxxx",
"https://www.youtube.com/watch?v=xxxxxxxx",
"https://youtu.be/xxxxxxxx")
)
```
The character vector containing the YouTube video IDs or URLs is passed as a parameter to the `Collect()` function (the
following code also shows the YouTube access token being piped to `Collect()`). In the following example, we are
collecting comments from a YouTube video titled "Australia bushfires - a national catastrophe | DW News", which was
uploaded by the German Deutsche Welle news service on 5th January 2020. The comment data were collected on 10th January
2020: the total number of comments at that time was over 1100, but we are using the `maxComments` parameter to collect a
maximum of 500 top-level comments (and all the reply comments to these top-level comments).
```{r eval=FALSE}
videoID <- "https://www.youtube.com/watch?v=pJ_NyEYRkLQ"
youtubeData <- youtubeAuth |>
Collect(videoID, maxComments = 500, writeToFile = TRUE)
```
The `Collect()` function takes the following arguments (when used for collecting YouTube data): `credential` (object
generated from `Authenticate()` with class name "youtube" (above we pass this via the pipe), `videoIDs` (character
vector specifying one or more youtube video IDs), `maxComments` (numeric integer specifying how many top-level comments
to collect from each video), `writeToFile` (whether to write the returned dataframe to disk as an `.rds` file; default
is FALSE), and `verbose` (whether to output information about the data collection; default is FALSE).
`Collect()` returns an R dataframe with the following structure (data have been modified to preserve anonymity):
```{r eval=FALSE}
> str(youtubeData)
Classes ‘dataource’, ‘youtube’ and 'data.frame': 603 obs. of 12 variables:
$ Comment : chr "xxxxx"
$ AuthorDisplayName : chr "xx" "xx" "xx" "xx"
$ AuthorProfileImageUrl: chr "https://xx" "https://xx" "https://xx"
$ AuthorChannelUrl : chr "http://xx" "http://xx" "http://xx" "http://xx"
$ AuthorChannelID : chr "xx" "xx" "xx" "xx"
$ ReplyCount : chr "0" "0" "0" "0"
$ LikeCount : chr "0" "0" "0" "0"
$ PublishedAt : chr "2020-01-10T02:23:43" "2020-01-09T20:56:23"
"2020-01-09T20:44:00" "2020-01-09T19:31:32"
$ UpdatedAt : chr "2020-01-10T02:23:43" "2020-01-09T20:56:23"
"2020-01-09T20:44:00" "2020-01-09T19:31:32"
$ CommentID : chr "xx" "xx" "xx" "xx"
$ ParentID : chr NA NA NA NA
$ VideoID : chr "pJ_NyLQ" "pJ_NyLQ" "pJ_NyLQ" "pJ_NyLQ"
```
### Importing saved collection data from file
If you are reading a previously saved `writeToFile` YouTube dataframe from disk, you simply need to use the `readRDS`
function:
```{r eval=FALSE}
# read dataframe from file
youtubeData <- readRDS("2020-09-26_095354-YoutubeData.rds")
```
## Creating YouTube Networks
It is currently possible to create two types of networks using YouTube data: (1) *actor network* and (2) *activity
network*.
### Actor Network
In the YouTube *actor network* the nodes are users who have commented on videos (and the videos themselves are included
in the network as special nodes) and the edges are the interactions between users in the comments. We can distinguish a
*top-level comment*, which is a comment that is directed to a video from a *reply comment*, which is a comment directed
to a top-level comment. The YouTube user interface does not allow a user to direct a reply to another reply. However,
users can achieve the "reply to a reply" functionality by starting their comment with the username of the person that
they are replying to (and they often prepend the username with "@"). So there will be an edge from user *i* to user *j*
if *i* replied to a top-level comment authored by *j* or else *i* prepended their comment with *j*'s username.
```{r eval=FALSE}
actorNetwork <- youtubeData |> Create("actor") |> AddText(youtubeData)
actorGraph <- actorNetwork |> Graph(writeToFile = TRUE)
```
`Create("actor")` returns a named list containing two dataframes named "nodes" and "edges" (the following has been
modified to preserve anonymity):
```{r eval=FALSE}
> actorNetwork
$nodes
# A tibble: 522 x 3
id screen_name node_type
<chr> <chr> <chr>
1 xxxxxxxxxxxxxxxxxxxxxxxxx xxxxxxxxxxxxxx actor
2 xxxxxxxxxxxxxxxxxxxxxxxxx xxxxxxxxxxxxx actor
[snip]
# … with 512 more rows
$edges
# A tibble: 604 x 6
from to video_id comment_id edge_type vosonTxt_comment
<chr> <chr> <chr> <chr> <chr> <chr>
1 xxxxxxxx… VIDEOID… pJ_NyEY… xxxxxxxxxxx… comment "xxxxx"
2 xxxxxxxx… VIDEOID… pJ_NyEY… xxxxxxxxxxx… comment "xxxxx"
[snip]
# … with 594 more rows
attr(,"class")
[1] "list" "network" "actor" "youtube" "voson_text"
```
Note that in the above, `AddText()` was used to add the comment text data to the network dataframe, stored as an edge
attribute. Also, note that there is an optional parameter `replies_from_text` that can be passed to `AddText()` when
used with YouTube network creation, to extract the "reply to reply" comments.
This list is then passed to `Graph()`, which returns an `igraph` graph object. Remember that it is possible to achieve
the above using a single line of code:
```{r eval=FALSE}
actorGraph <- youtubeData |> Create("actor") |> AddText(youtubeData) |> Graph()
```
The following is an an annonymised summary of the `igraph` graph object.
```{r eval=FALSE}
> actorGraph
IGRAPH 79e5456 DN-- 522 604 --
+ attr: type (g/c), name (v/c), screen_name (v/c), node_type (v/c),
| label (v/c), video_id (e/c), comment_id (e/c), edge_type (e/c),
| vosonTxt_comment (e/c)
+ edges from 79e5456 (vertex names):
[1] xxxx->VIDEOID:pJ_NyEYRkLQ
[2] xxxx->VIDEOID:pJ_NyEYRkLQ
[snip]
+ ... omitted several edges
```
The YouTube actor network node contains a graph attribute `type` (set to "youtube"). The node attributes are: `name`
(Channel ID, which is YouTube's unique user ID), `screen_name` (the users displayed name), `node_type` ('actor' or
'video') and `label` (a concatenation of the ID and screen name). The edge attributes are: `video_id` (the ID of the
video for which the data have been collected), `comment_id` (the ID of the comment), `edge_type` (whether the edge is a
'comment' i.e. top-level comment, 'reply-comment' i.e. reply to top-level comment or reply to reply or 'self-loop',
which is a special edge connecting the video to itself, as a means of including text posted with the video). In the
above example, because of our earlier use of `AddText()`, there is also an edge attribute `vosonTxt_comment` which is
the text associated with the comment, reply or video.
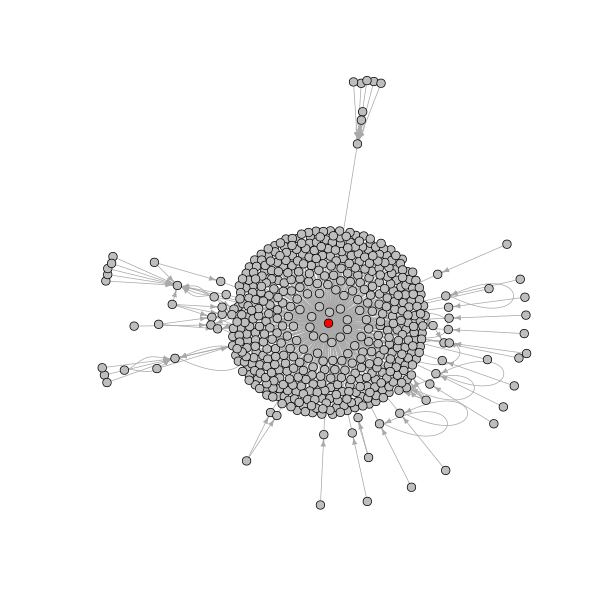
The example YouTube actor network contains 522 nodes and 604 edges. The following indicates that there were 500
top-level comments (we constrained the collection to this number), 103 replies to top-level comments (note: we did not
use `AddText()` to collect replies embedded within the text), and there is the single self-loop from the video to
itself.
```{r eval=FALSE}
> table(E(actorGraph)$edge_type)
comment reply-comment self-loop
500 103 1
```
We can visualize this network, using red to identify the video nodes.
```{r eval=FALSE}
# change color of nodes with type video to red and others grey
V(actorGraph)$color <- ifelse(
V(actorGraph)$node_type == "video", "red", "grey"
)
# open and write plot to a png file
png("youtube_actor.png", width = 600, height = 600)
plot(actorGraph, vertex.label = "", vertex.size = 4, edge.arrow.size = 0.5)
dev.off()
```
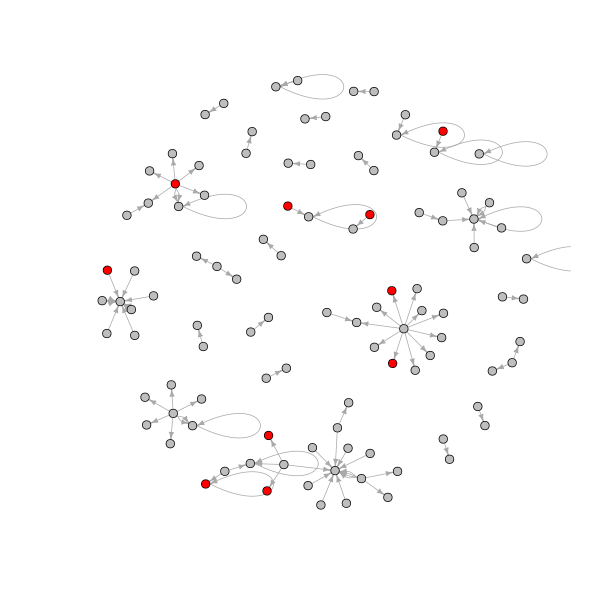
The following creates a sub-network containing only the replies to top-level comments. In removing the other edges
(top-level comments and the self-loop) we create a number isolate nodes (nodes with no connections) that we also remove.
We have also used red to indicate the people who have written comments containing particular terms that have been
present in the online commentary about the bushfires.
```{r eval=FALSE}
# removed edges that are not of type reply-comment
g2 <- delete.edges(
actorGraph, which(E(actorGraph)$edge_type != "reply-comment")
)
# check number of isolates
> length(which(degree(g2) == 0))
[1] 417
# remove isolates
g2 <- delete.vertices(g2, which(degree(g2) == 0))
# get node indexes for the tails of edges that have comments containing
# words of interest change the indexed node colors to red and others grey
V(g2)$color <- "grey"
ind <- tail_of(
actorGraph,
grep("arson|backburn|climate change", tolower(E(g2)$vosonTxt_comment))
)
V(g2)$color[ind] <- "red"
# open and write plot to a png file
png("youtube_actor_reply.png", width = 600, height = 600)
plot(g2, vertex.label = "", vertex.size = 4, edge.arrow.size = 0.5)
dev.off()
```
Finally, the `AddVideoData()` function supplements the network data with additional video information.
```{r eval=FALSE}
actorNetwork_withVideoInfo <- actorNetwork |> AddVideoData(youtubeAuth)
```
`AddVideoData()` returns a named list containing three dataframes named "nodes" (identical to the dataframe contained in
the list `actorNetwork` in the example able), "edges" (this has three additional columns: "video_title",
"video_description", "video_published_at") and a new dataframe "videos" (the following has been modified to preserve
anonymity):
```{r eval=FALSE}
> actorNetwork_withVideoInfo
$nodes
# A tibble: 522 x 3
id screen_name node_type
<chr> <chr> <chr>
1 xxxxxxxxxxxxxxxxxxxxxxxx xxxxxxxxxxxxx actor
2 xxxxxxxxxxxxxxxxxxxxxxxx xxxxxxxxxxxxx actor
[snip]
# … with 512 more rows
$edges
# A tibble: 604 x 9
from to video_id comment_id edge_type vosonTxt_comment video_title
<chr> <chr> <chr> <chr> <chr> <chr> <chr>
1 xxxx… xxxx… pJ_NyEY… xxxxxxxxx… comment xxxxxxxxxxxx … Australia …
2 xxxx… xxxx… pJ_NyEY… xxxxxxxxx… comment "xxxx" Australia …
[snip]
# … with 594 more rows, and 2 more variables: video_description <chr>,
# video_published_at <chr>
$videos
# A tibble: 1 x 6
VideoID VideoTitle VideoDescription VideoPublishedAt ChannelID ChannelTitle
<chr> <chr> <chr> <chr> <chr> <chr>
1 pJ_NyEY… Australia … "As Australia ba… 2020-01-05T12:3… UCknLrEd… DW News
attr(,"class")
[1] "list" "network" "actor" "youtube"
[5] "voson_text" "voson_video_data"
```
It should also be noted that `AddVideoData()` can optionally substitute references to the video ID in the "nodes" and
"edges" dataframes with the video publishers channel ID (this is done by setting the parameter `actorSubOnly` to TRUE.
### Activity Network
In the YouTube *activity network*, nodes are either comments or videos (videos represent a starting comment).
```{r eval=FALSE}
activityNetwork <- youtubeData |> Create("activity") |> AddText(youtubeData)
activityGraph <- activityNetwork |> Graph()
```
`Create("activity")` returns a named list containing two dataframes named "nodes" and "edges" (the following has been
modified to preserve anonymity).
```{r eval=FALSE}
> activityNetwork
$edges
# A tibble: 603 x 3
from to edge_type
<chr> <chr> <chr>
1 xxxxxxxxxxxxxxxxxxxxxxxxxx VIDEOID:pJ_NyEYRkLQ comment
2 xxxxxxxxxxxxxxxxxxxxxxxxxx VIDEOID:pJ_NyEYRkLQ comment
[snip]
# … with 593 more rows
$nodes
# A tibble: 604 x 8
id video_id published_at updated_at author_id screen_name node_type
<chr> <chr> <chr> <chr> <chr> <chr> <chr>
1 xxxx… pJ_NyEY… 2020-01-10T… 2020-01-1… xxxxxxxx… xxxxxxxxxx… comment
2 xxxx… pJ_NyEY… 2020-01-09T… 2020-01-0… xxxxxxxx… xxxxxxxxxx… comment
[snip]
# … with 594 more rows, and 1 more variable: vosonTxt_comment <chr>
attr(,"class")
[1] "list" "network" "activity" "youtube" "voson_text"
```
Note that in the above, `AddText()` was used to add the comment text data to the network dataframe, stored as a node
attribute. This list is then passed to `Graph()`, which returns an `igraph` graph object (this has been anonymised).
```{r eval=FALSE}
IGRAPH 02664d1 DN-- 604 603 --
+ attr: type (g/c), name (v/c), video_id (v/c), published_at (v/c),
| updated_at (v/c), author_id (v/c), screen_name (v/c), node_type
| (v/c), vosonTxt_comment (v/c), label (v/c), edge_type (e/c)
+ edges from 02664d1 (vertex names):
[1] xxxx->VIDEOID:pJ_NyEYRkLQ
[2] xxxx->VIDEOID:pJ_NyEYRkLQ
[3] xxxx->VIDEOID:pJ_NyEYRkLQ
[4] xxxx->VIDEOID:pJ_NyEYRkLQ
[5] xxxx->VIDEOID:pJ_NyEYRkLQ
[6] xxxx->VIDEOID:pJ_NyEYRkLQ
+ ... omitted several edges
```
The YouTube activity network contains a graph attribute `type` (set to "youtube"). The node attributes are: `name`
(character string ID number for the comment or video), `video_id` (character string ID of the video for which the
comments collected - in this example, "pJ_NyEYRkLQ"), `published_at` (timestamp of when the comment was published, this
is `NA` for the video itself), `updated_at` (timestamp of when a comment was updated), `author_id` (user's Channel ID),
`screen_name` (user's display name), `node_type` (whether the node is a 'comment' i.e. top-level comment,
'reply-comment' i.e. reply to top-level comment or reply to reply or 'video'), `vosonText_comment` (the comment text,
`NA` for the video), `label` (concatenation of `name` and `screen_name`). The edge attributes `edge_type` which is
'comment' for all edges connecting a top-level comment to the video, and 'reply-comment' for all other edges.
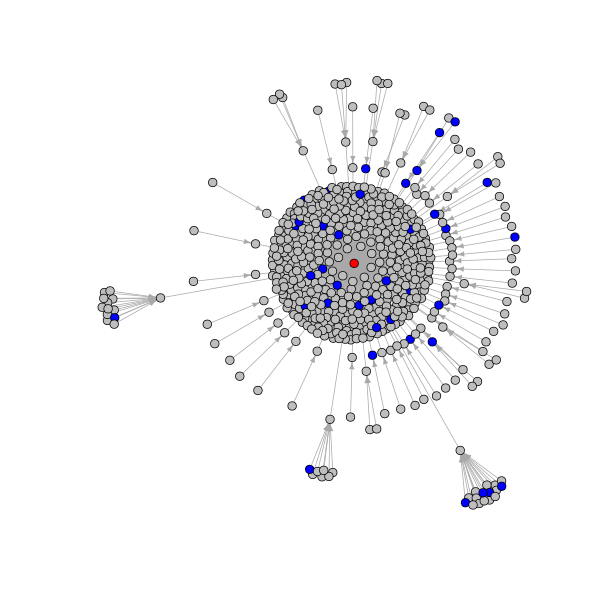
The example YouTube activity network contains 604 nodes and 603 edges. The following is an `igraph` visualization of the
network, where the video is indicated by a red node, and blue indicates comments that include one of the following
terms: "arson", "bakcburn", "climate change".
```{r eval=FALSE}
# set all video node colors to red and others to grey
V(activityGraph)$color <- "grey"
V(activityGraph)$color[which(V(activityGraph)$node_type == "video")] <- "red"
# get node indexes of comments that contain terms of interest
# set their node colors to blue
ind <- grep(
"arson|backburn|climate change", tolower(V(activityGraph)$vosonTxt_comment)
)
V(activityGraph)$color[ind] <- "blue"
# open and write plot to a png file
png("youtube_activity.png", width = 600, height = 600)
plot(activityGraph, vertex.label = "", vertex.size = 4, edge.arrow.size = 0.5)
dev.off()
```
# Reddit
The Reddit collection in `vosonSML` is based on the approach used in the
[RedditExtractoR](https://cran.r-project.org/package=RedditExtractoR) package.
## Authenticating with the Reddit API
The `vosonSML` does not require Reddit API credentials to be provided. However, to keep the workflow consistent with the
other data sources, we still need to create a "dummy" access token, using the `Authenticate()` function (see below).
## Collecting Data from Reddit
To collect Reddit comment data, first construct a character vector containing the post URL(s).
```{r eval=FALSE}
myThreadUrls <- c(
"https://www.reddit.com/r/xxxxxx/comments/xxxxxx/x_xxxx_xxxxxxxxx/",