This example shows how to use @opentelemetry/exporter-collector to instrument a simple Node.js application.
This example will export spans data simultaneously using Exporter Collector and grpc. It will use proto format.
# from this directory
npm install-
Run docker
# from this directory npm run docker:start -
Run tracing app
# from this directory npm start:tracing -
Run metrics app
# from this directory npm start:metrics -
Open page at http://localhost:9411/zipkin/ - you should be able to see the spans in zipkin


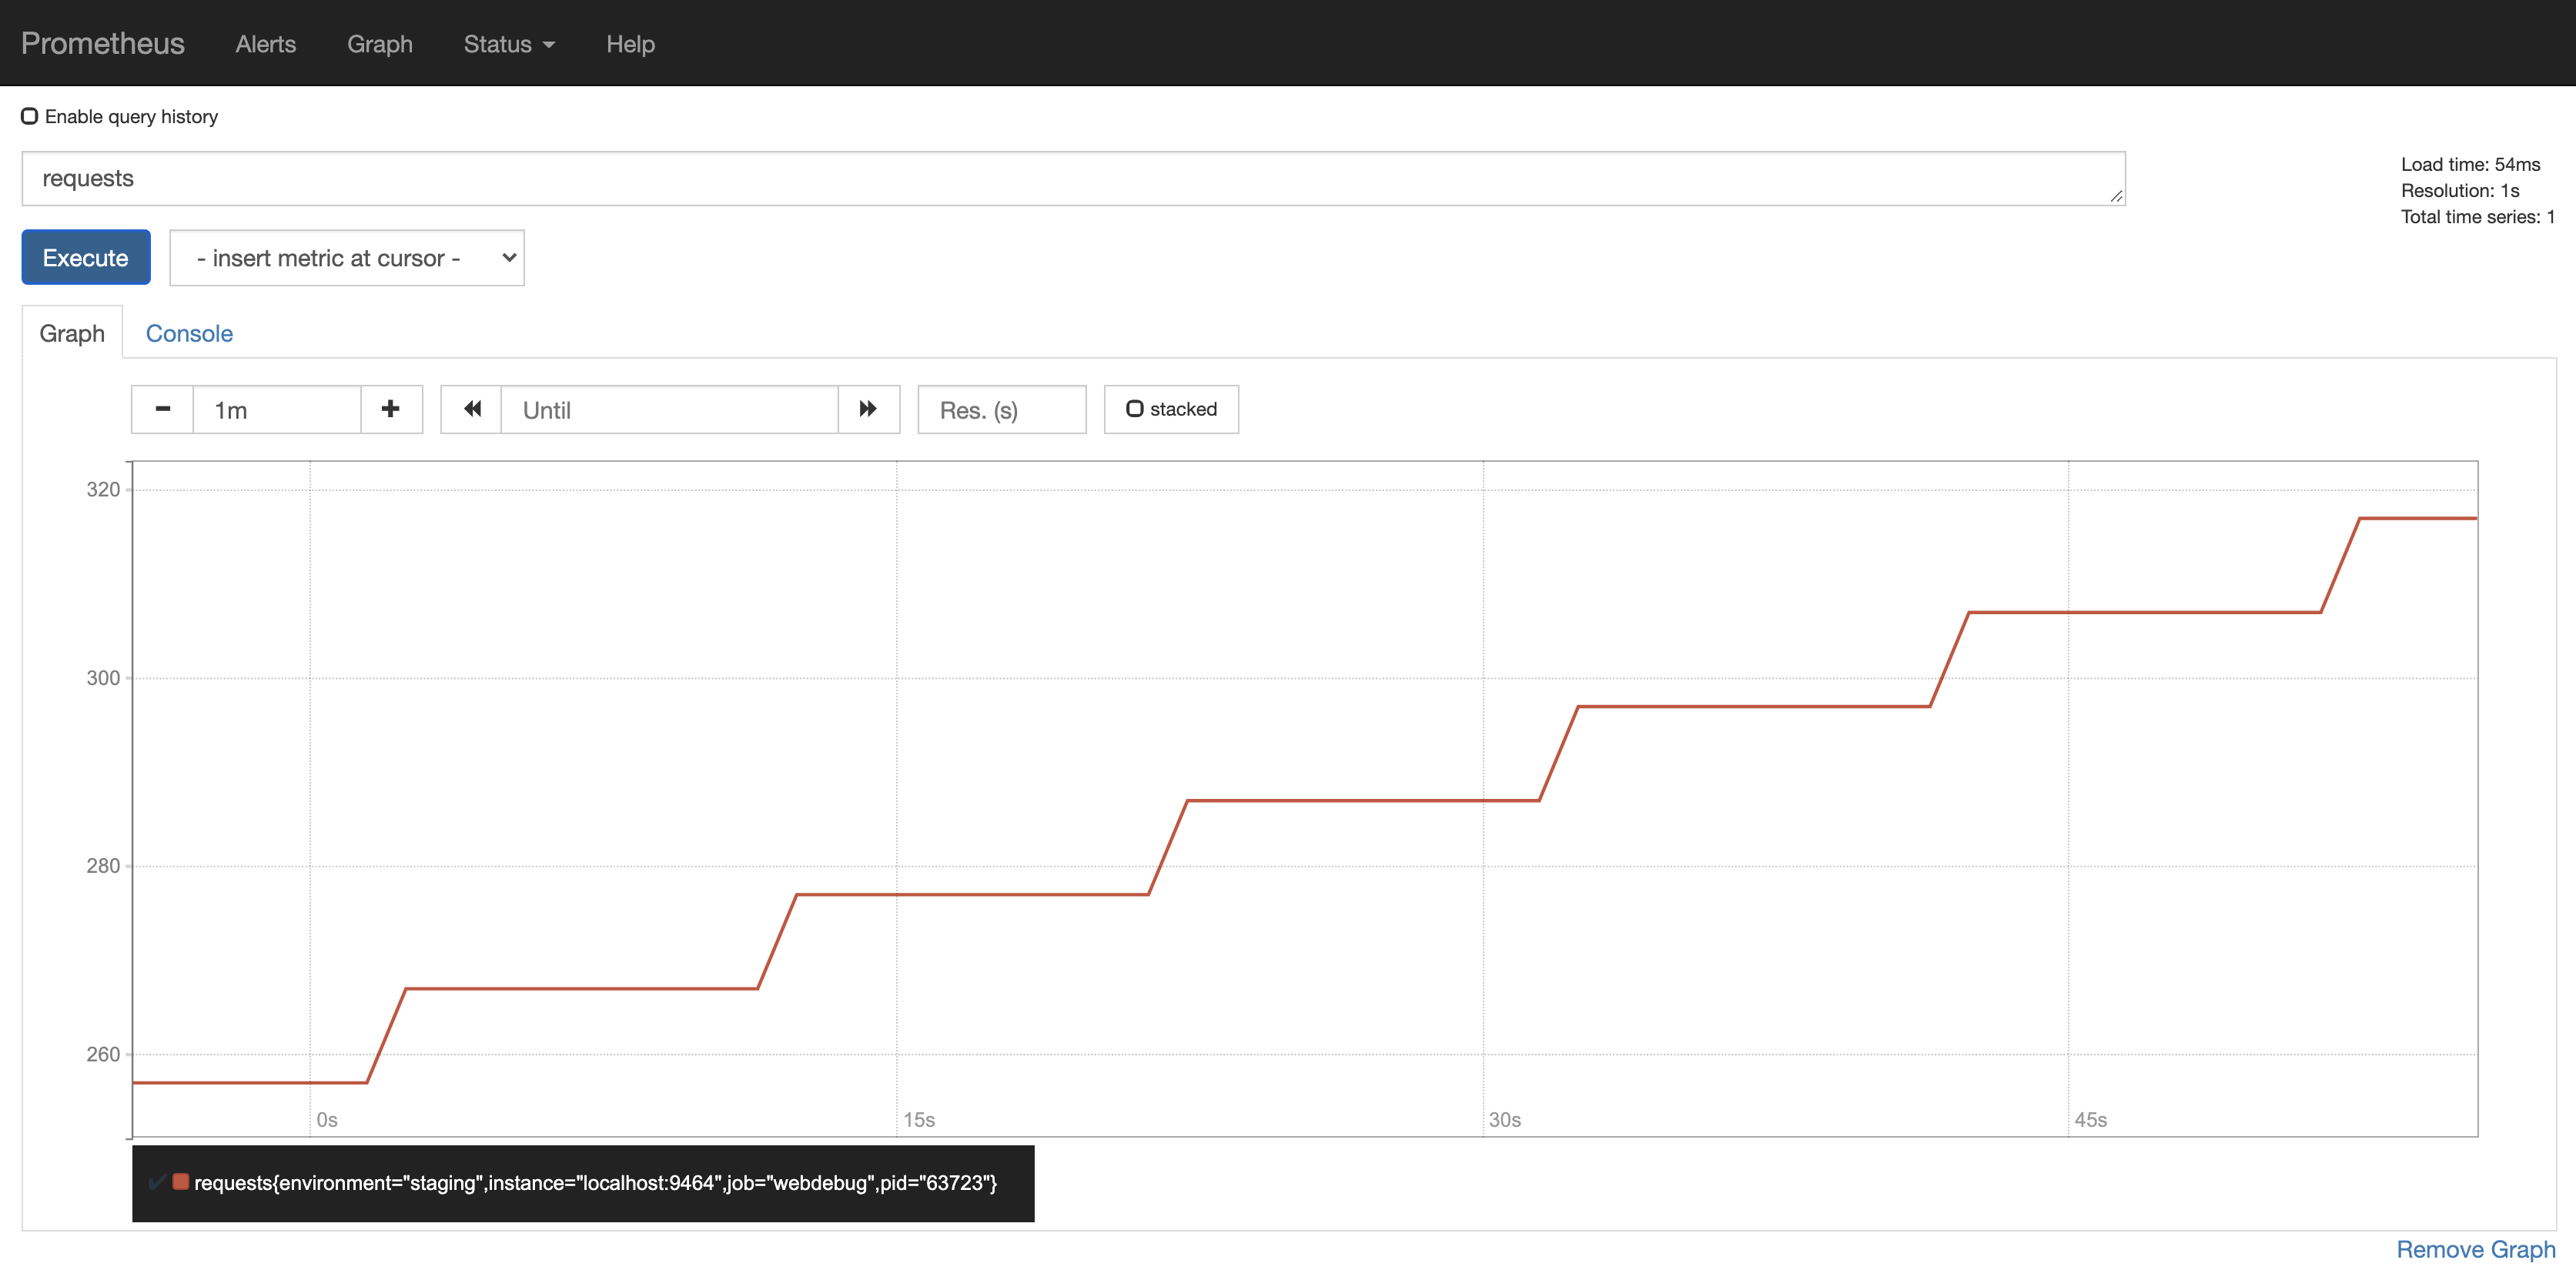
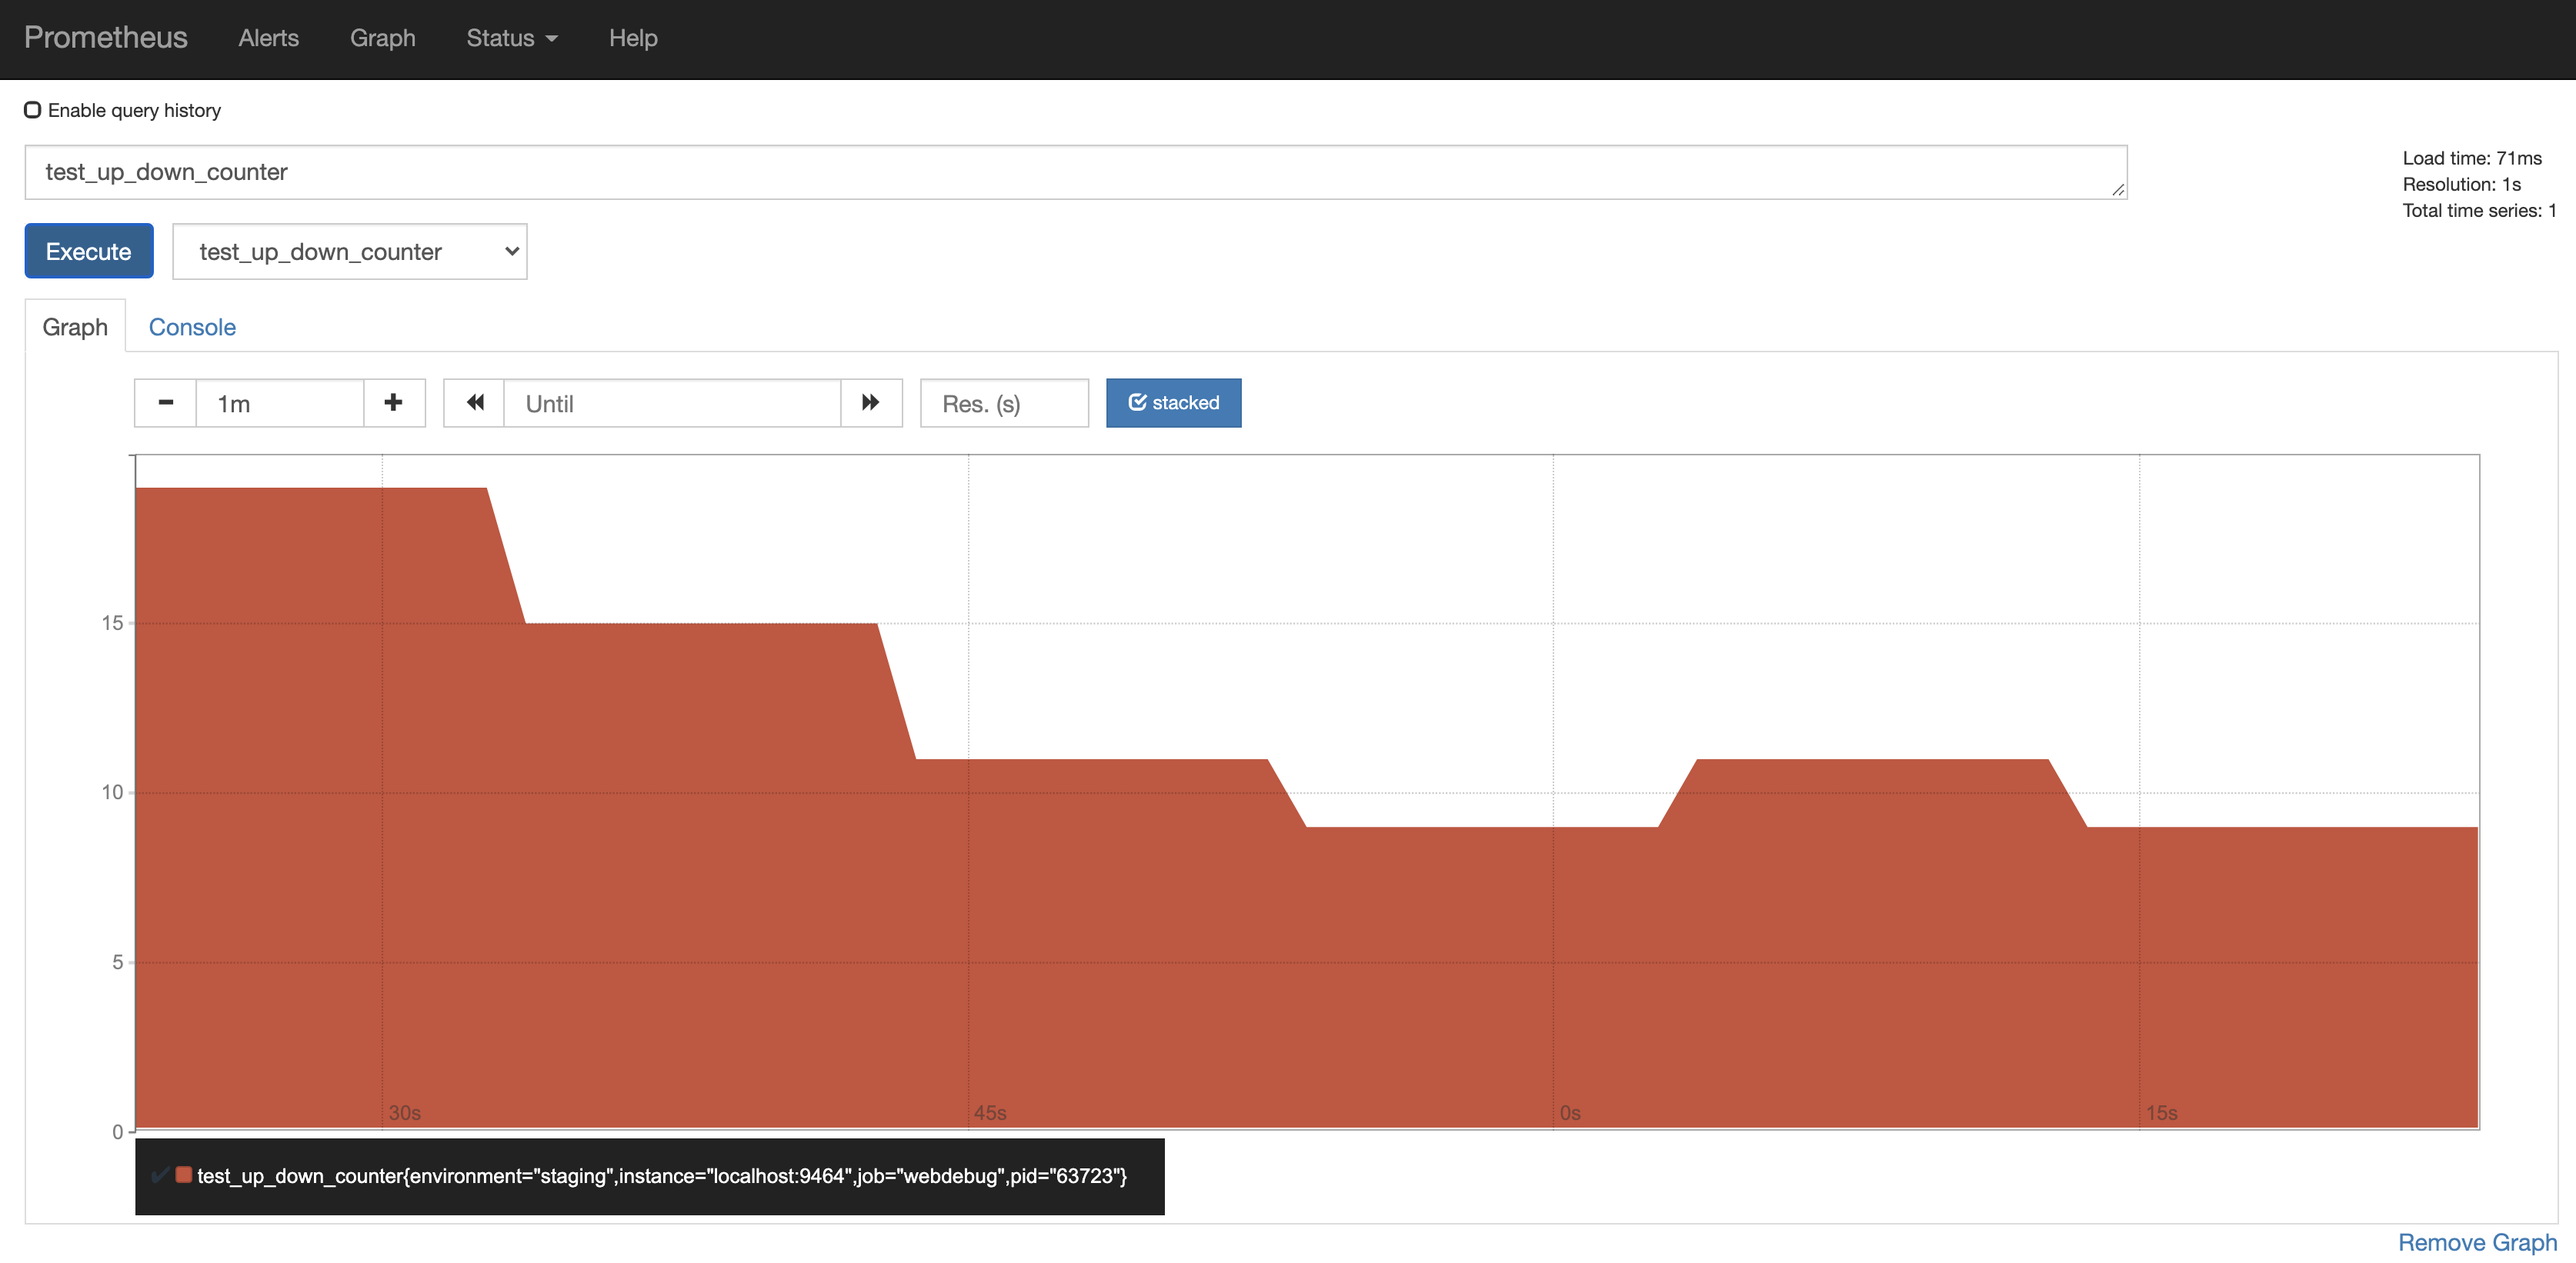
The prometheus client will be available at http://localhost:9090.
Note: It may take some time for the application metrics to appear on the Prometheus dashboard.
- For more information on OpenTelemetry, visit: https://opentelemetry.io/
- For more information on tracing, visit: https://github.com/open-telemetry/opentelemetry-js/tree/main/packages/opentelemetry-tracing
Apache License 2.0