You signed in with another tab or window. Reload to refresh your session.You signed out in another tab or window. Reload to refresh your session.You switched accounts on another tab or window. Reload to refresh your session.Dismiss alert
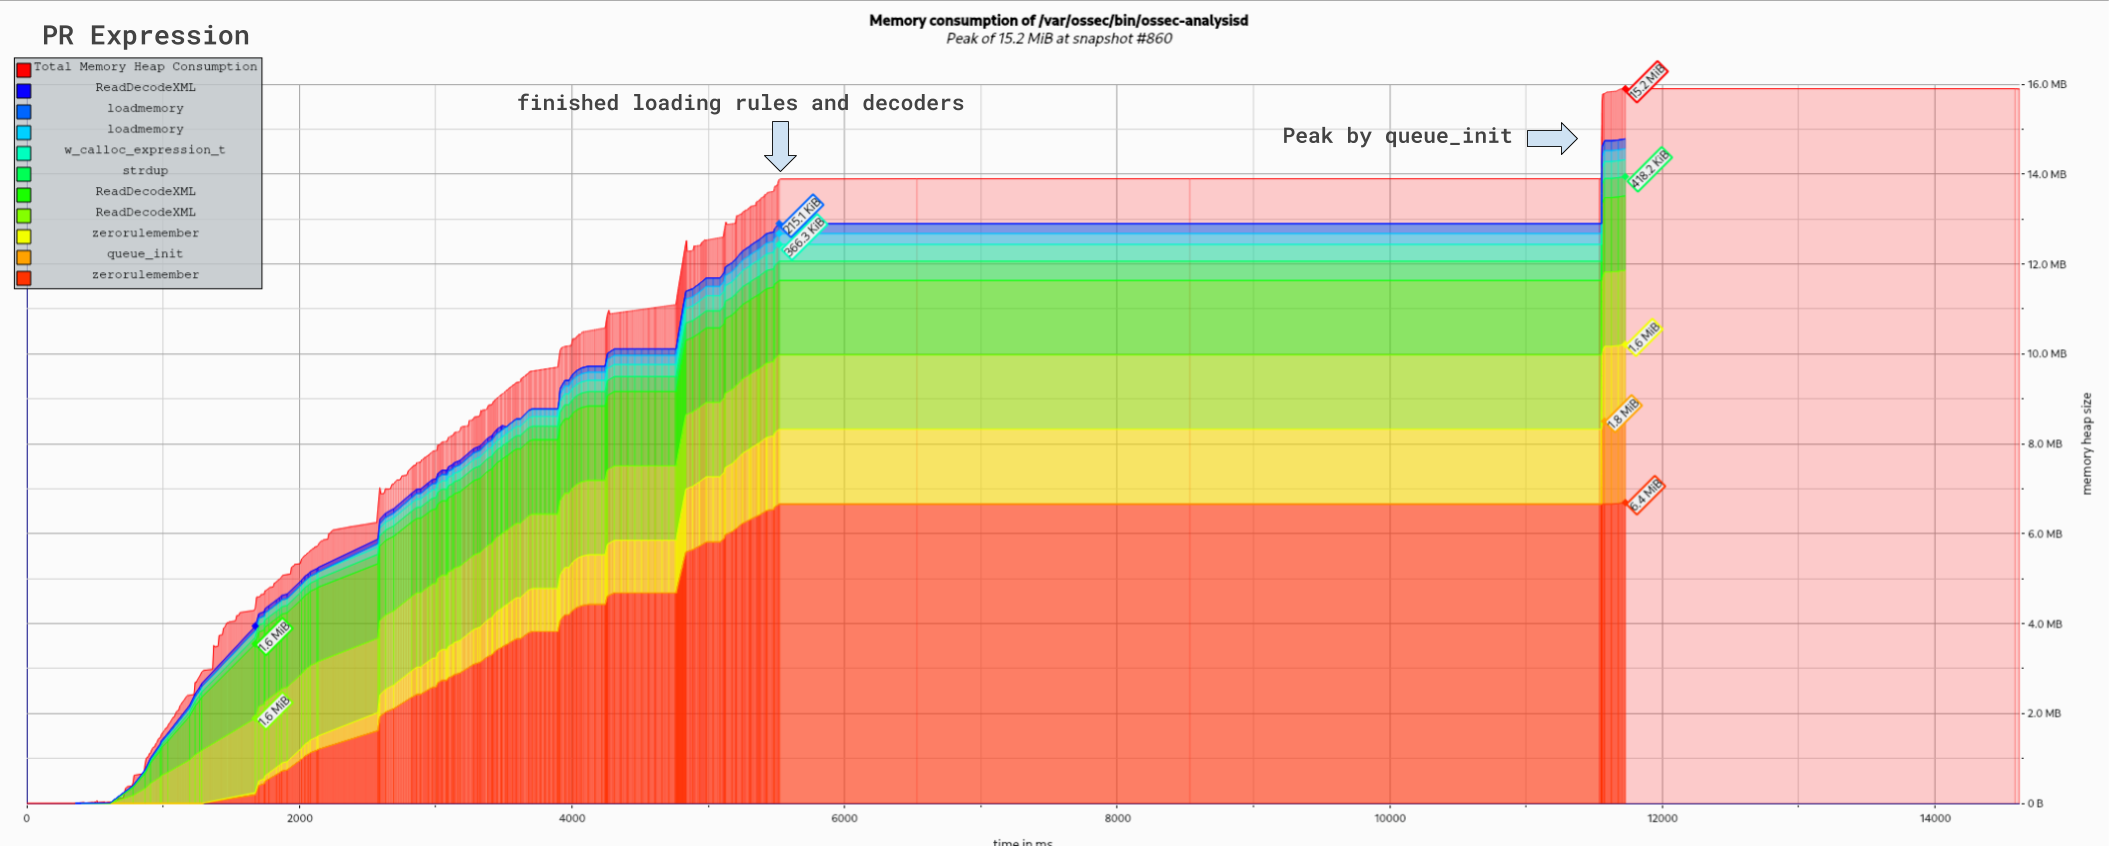
Analyzing the memory snapshot obtained with massif, after loading rules and decoders (and before the initialization of the queue) we have the following use of heap:
PR Expression: 13.24 MBytes (13887085 B) - snapshot=668
Master: 13.19 MBytes (13835574 B) - snapshot=668
The memory cost of supporting PCRE2 is approximately 0.37% (50.3 Kbytes). After starting the queues this represents 0.33%. It is worth clarifying that this is due to the new structure where all types of regex are stored and depends on the number of regexs, but the memory footprint is small.
Callgrind allows estimating the impact based on the number of instructions, this means that file load times, memory searches, cache misses, etc. are not taken into account, but the results may vary depending on the architecture, compiler, and optimization flags.
Column description: - Incl: the total instructions performed by this function and all functions it calls beneath it. x100 / total instructions - Self: The instructions performed exclusively by this function. This counter only tracks instructions used by this function, not any instruction used by functions that are called by this function. - Called: Number of times the function was called
the w_expression_compile and w_calloc_expression functions, their impact is so small that they do not reach 0.00%, although it was to be expected because they are simply a swtich.
Most of the CPU time is caused by parsing and memory allocation of XML files, accounting for 87% of startup cost
Profiling - AnalysisD: 4.0.0 vs 4.0 with PCRE2 support
Brief
An analysis of the heap memory and the impact on the loading of rules and decoders was performed after the implementation of PCRE2.
Test environment
HEAP analysis:
Data obtained with massif:
Analyzing the memory snapshot obtained with massif, after loading rules and decoders (and before the initialization of the queue) we have the following use of heap:
PR Expression:
13.24 MBytes (13887085 B) - snapshot=668Master:
13.19 MBytes (13835574 B) - snapshot=668The memory cost of supporting PCRE2 is approximately 0.37% (50.3 Kbytes). After starting the queues this represents 0.33%. It is worth clarifying that this is due to the new structure where all types of regex are stored and depends on the number of regexs, but the memory footprint is small.
without PCRE2
with PCRE2
Performance at startup
Data obtained with callgrind:
Callgrind allows estimating the impact based on the number of instructions, this means that file load times, memory searches, cache misses, etc. are not taken into account, but the results may vary depending on the architecture, compiler, and optimization flags.
Column description:
- Incl: the total instructions performed by this function and all functions it calls beneath it. x100 / total instructions
- Self: The instructions performed exclusively by this function. This counter only tracks instructions used by this function, not any instruction used by functions that are called by this function.
- Called: Number of times the function was called
the
w_expression_compileandw_calloc_expressionfunctions, their impact is so small that they do not reach 0.00%, although it was to be expected because they are simply a swtich.Most of the CPU time is caused by parsing and memory allocation of XML files, accounting for 87% of startup cost

Attached test results.
Regards,
Julian
callgrind_205-regex-pcre2.zip
callgrind_master.zip
massif.out.zip
The text was updated successfully, but these errors were encountered: