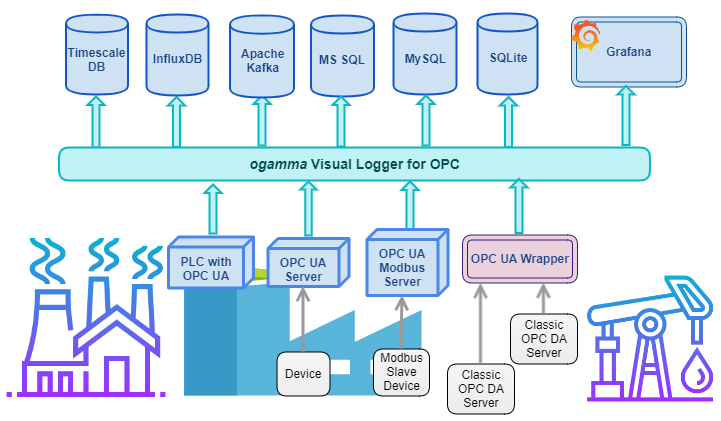
Integration tool, which performs 2 tasks:
- Collects data from OPC UA Servers and stores it in PostgreSQL database (which might have TimescaleDB extension installed).
- Acts as a back-end for Grafana SimpleJson data source plugin.
-
Windows PC. If you would like to try it on other OS, please contact me at the address ravil at onewayautomation.com, or create feature request issue here in GitHub.
-
Install Visual C++ 2017 redistributables (64 bit version): Latest downloads are available at https://support.microsoft.com/en-ca/help/2977003/the-latest-supported-visual-c-downloads
Direct link: https://aka.ms/vs/15/release/vc_redist.x64.exe
-
Install Visual C++ 2013 redistributables (required by PostgreSQL library), can be downloaded from Microsoft web site: http://download.microsoft.com/download/0/5/6/056dcda9-d667-4e27-8001-8a0c6971d6b1/vcredist_x64.exe
-
Install / Configure PostgreSQL database:
- Download page: https://www.postgresql.org/download/windows/
- Create a user which will be used to access the database from OPC UA Data Logger. Default user name/password in the OPC UA Data Logger's configuration file are uarest/uarest.
- Create database (default name is test); and assign user uarest as its owner. When OPC UA Data Logger starts first time, it will create required tables in this database. Note that user credentials and database connection parameters can be changed later in the config.json file.
- Download zip file from https://onewayautomation.com/opcua-binaries/opcua-logger-0.2.4.zip and unzip.
- If required, modify settings in the config.json file: http port number (default number is 8989), and settings to connect to the PostgreSQL database.
Open Windows comman line console, navigate to the folder where OPC UA Data Logger files are unzipped, and start application OpcUaLogger.exe. Please note that at the very first start it might take some time to generate OPC UA Application Instance Certificate. At the first start, it will also create tables in the PostgreSQL database. The application has built-in web server to support web based GUI to configure it, so it will listen to http port. Windows operating system will pop-up dialog window to asking for permission to listen on the port, you will need allow it.
Configuration of connections to OPC UA Servers and selection of OPC UA variables to monitor (log into the database).
Open web browser (Google Chrome is only tested browser currently), and navigate to address http://localhost:8989
In the left side panel, click on Add button and add new connection. Note that currently web page needs to be refreshed in order to refresh the Address Space tree.
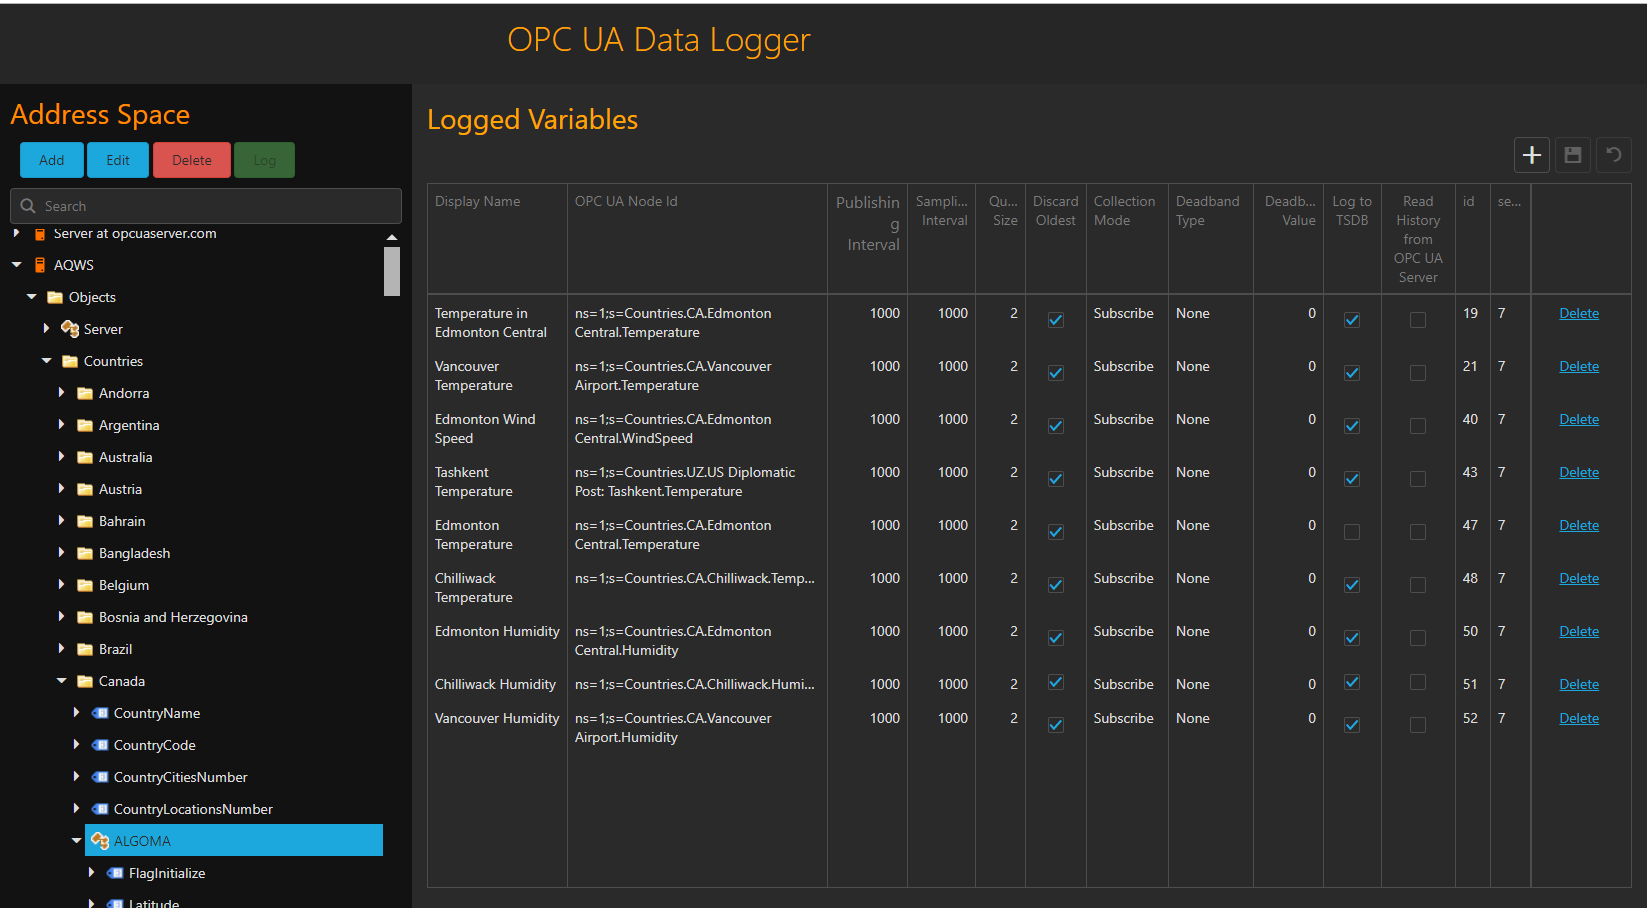
Browse OPC UA Server's address space and select one or more OPC UA Variable nodes which has numeric data type (those, for which value can be converted into float data type, for example, Byte, Int16, Int32, float, double).
Once one or more OPC UA Variables are selected, the button Log will be enabled. If you click on it, selected nodes will be used to create new records in the right side grid table. If a record has field Active checked and the field Historize unchecked, then its value will be monitored by OPC UA Data Logger, and written (logged) into the PostgreSQL database. If a record has option Historize set to true, then OPC UA Data Logger will not log it. When historical data is requested via REST API for those variables, historical values for it will be read from OPC UA Server.
The following below screenshot illustrates typical GUI:
- Install Grafana from https://grafana.com/
- Instructions on Grafana web page suggest to use wget tool to download the installer. If you don't have wget tool installed, then you can download it from here: https://eternallybored.org/misc/wget/
- Install SimpleJson data source plugin (instructions are available at https://grafana.com/plugins/grafana-simple-json-datasource/installation)
- Add data source of SimpleJson type, and configure it to connect to the OPC UA Data Logger endpoint (http://localhost:8989/grafana)
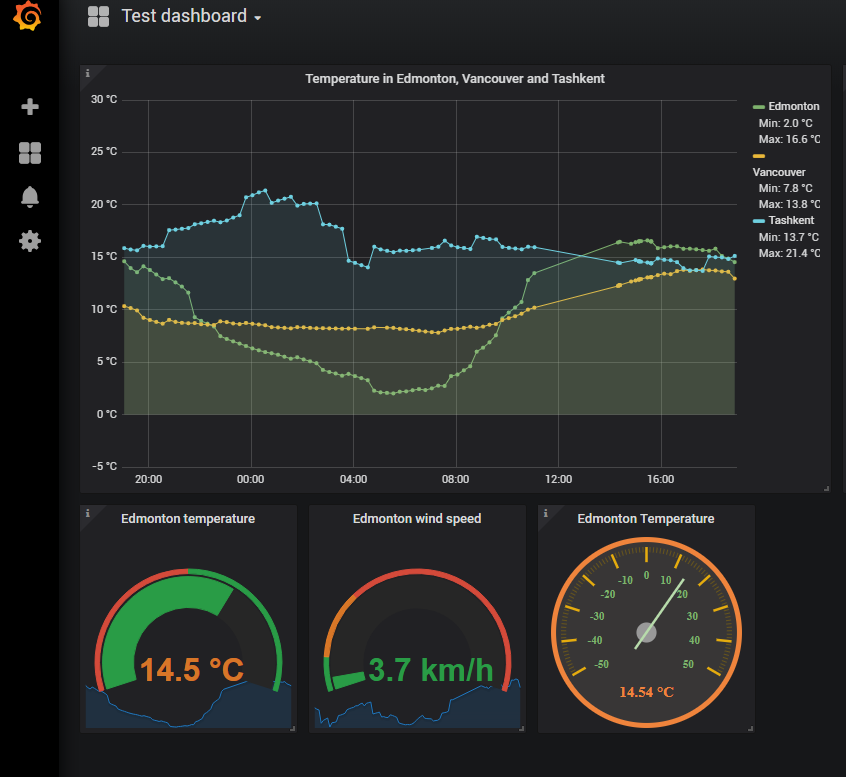
- Add new dashboard.
- Add panels to the created dashboard, and configure to get timeseries data from added SimpleJson data source.
It is possible also to get logged data values from PostgreSQL database directly, using PostgreSQL data source plugin for Grafana (installation is not required, included into Grafana by default). Example of the SQL quesry can be found below:
SELECT $__time(time), value FROM values WHERE $__timeFilter(time) and sourceid='1'
Here time, value and sourceid are column names in the values table. You can figure out corresponding to the OPC UA variable sourceid from Logged Variables data grid on the configuration GUI.
Soon the video with more detailed instructions will be posted on youtube.