Skip to content
New issue

Have a question about this project? Sign up for a free GitHub account to open an issue and contact its maintainers and the community.

By clicking “Sign up for GitHub”, you agree to our terms of service and privacy statement. We’ll occasionally send you account related emails.

Already on GitHub? Sign in to your account

Debugging is pausing on breakpoints that I didn't add #629

Closed
daveromsey opened this issue Aug 9, 2021 · 11 comments
Closed

Debugging is pausing on breakpoints that I didn't add #629

daveromsey opened this issue Aug 9, 2021 · 11 comments
Assignees

Comments

@daveromsey
Copy link

daveromsey commented Aug 9, 2021

I've been running into a problem where PHP Debug sets an "invisible" breakpoint, which I have to Continue over in order to get to my actual breakpoint. I noticed this after updating VS Code. The issue does not happen with my older VS Code setup.

Note: I previously noted this issue in another ticket, but created this new issue to keep things tidy.

Expected breakpoint:
image

Unexpected Breakpoint once page is loaded:
Note there are also multiple Requests, which I think might be caused by the WP Heartbeat API, which is a separate issue that is being discussed in the original thread linked above.
image

Environment:

PHP: 7.4.1
Xdebug: v2.9.0 (I'm using Local by Flywheel v5.10.4)
OS: Windows 10 Pro

Old Setup (works, but it's old :) )

VS Code: v1.44.2
PHP Debug (Felix Becker): v1.14.0

New Setup (Has issues, documented below):

VS Code: v1.59.0-insider
PHP Debug (Felix Becker): v1.17.0

XDebug info from php.ini

[xdebug]
zend_extension = php_xdebug.dll
xdebug.remote_enable=1
xdebug.remote_connect_back=Off
xdebug.remote_port="9000"
xdebug.profiler_enable=0
xdebug.remote_autostart=0
xdebug.log=1

I'm using the XDebug Helper Chrome extension to toggle debugging on/off from my browser.

launch.json

{
	// Use IntelliSense to learn about possible attributes.
	// Hover to view descriptions of existing attributes.
	// For more information, visit: https://go.microsoft.com/fwlink/?linkid=830387
	"version": "0.2.0",
	"configurations": [
		{
			"name": "Listen for XDebug",
			"type": "php",
			"request": "launch",
			"log": true,
			// "breakpoint_resolved ": false, // Tested this but it didn't seem to do anything.
			"xdebugSettings": {
				"max_data": 65535,
				"show_hidden": 1,
				"max_children": 100,
				"max_depth": 5
			}
		}
	]
}

WordPress test plugin: xdebug-test.php.

<?php
/**
 * Plugin Name: X Debug Testing
 */

namespace VSCodeXDebugTesting;

add_action( 'admin_init', __NAMESPACE__ . '\xdebug_test' );
function xdebug_test() {
	for ( $i = 0; $i < 100; $i++ ) {
		// Added breakpoint to the next line:
		error_log( '$i ' . var_export( $i, true ) );
	}
}

I added a breakpoint to line 12.

When testing, I've activated the plugin and I'm visiting the domain.com/wp-admin/plugins.php page. (Any admin page will trigger the admin_init hook).

Debug console output (too large to post or pastebin):
phpdebug-console-output.txt

When launching a session, execution will first stop on the line with add_action( 'admin_init', __NAMESPACE__ . '\xdebug_test' ); which is unexpected since I did not add a breakpoint there. I click Continue, then the debugger pauses execution on the line with error_log( '$i ' . var_export( $i, true ) ); which is where I actually added the breakpoint.

@zobo zobo self-assigned this Aug 10, 2021
@zobo
Copy link
Contributor

zobo commented Aug 10, 2021

Hi @daveromsey !

Thank you so much for a great bug report. It's clean and to the point.

The described behavior, as I suspected, comes from Xdebugs resolved_breakpoints feature that is used by the plugin to provide better breakpoint experience.

We can see here the plugin creates a breakpoint, on line 12:

xd(1) <- breakpoint_set -i 11 -t line -f file:///d:/dev/local-sites/wpdevworkshop/app/public/wp-content/plugins/xdebug-test.php -n 12
xd(1) -> <?xml version="1.0" encoding="iso-8859-1"?><response xmlns="urn:debugger_protocol_v1" xmlns:xdebug="https://xdebug.org/dbgp/xdebug" command="breakpoint_set" transaction_id="11" id="49280006" resolved="unresolved"></response>

Later, when PHP execution reaches the xdebug-test.php file Xdebug resolves the breakpoint - this means that the PHP file was compiled into op-codes and Xdebug has placed internal hooks to stop execution there. It informs the plugin with this message. Note that the line number is now 8.

xd(1) -> <?xml version="1.0" encoding="iso-8859-1"?><notify xmlns="urn:debugger_protocol_v1" xmlns:xdebug="https://xdebug.org/dbgp/xdebug" name="breakpoint_resolved"><breakpoint type="line" resolved="resolved" filename="file:///D:/dev/local-sites/wpdevworkshop/app/public/wp-content/plugins/xdebug-test.php" lineno="8" state="enabled" hit_count="0" hit_value="0" id="49280006"></breakpoint></notify>

This is expected behavior if you'd place a breakpoint on a line with no executable code. However here it's a bit strange.

Next, PHP execution stops on line 8:

xd(1) -> <?xml version="1.0" encoding="iso-8859-1"?><response xmlns="urn:debugger_protocol_v1" xmlns:xdebug="https://xdebug.org/dbgp/xdebug" command="run" transaction_id="12" status="break" reason="ok"><xdebug:message filename="file:///D:/dev/local-sites/wpdevworkshop/app/public/wp-content/plugins/xdebug-test.php" lineno="8"></xdebug:message></response>

As you said, a continue request is made and that leads to the next stop event on line 12:

xd(1) <- run -i 16

Now here is the strange part. The same breakpoint (see internal ID 49280006) is once again resolved to line 12:

xd(1) -> <?xml version="1.0" encoding="iso-8859-1"?><notify xmlns="urn:debugger_protocol_v1" xmlns:xdebug="https://xdebug.org/dbgp/xdebug" name="breakpoint_resolved"><breakpoint type="line" resolved="resolved" filename="file:///D:/dev/local-sites/wpdevworkshop/app/public/wp-content/plugins/xdebug-test.php" lineno="12" state="enabled" hit_count="1" hit_value="0" id="49280006"></breakpoint></notify>

And then as expected a break event happens:

xd(1) -> <?xml version="1.0" encoding="iso-8859-1"?><response xmlns="urn:debugger_protocol_v1" xmlns:xdebug="https://xdebug.org/dbgp/xdebug" command="run" transaction_id="16" status="break" reason="ok"><xdebug:message filename="file:///D:/dev/local-sites/wpdevworkshop/app/public/wp-content/plugins/xdebug-test.php" lineno="12"></xdebug:message></response>

For completeness from Xdebug init: 7.4.0-dev / 2.9.0.

@derickr I know this is an unsupported Xdebug version, but was there any bugfix related to this sort of behaviour?

I'll try to reproduce the issue with different version here.

@zobo
Copy link
Contributor

zobo commented Aug 10, 2021

I can't seem to reproduce the issue right now. I'll try later but if it causes real issues you can try to add the following to your launch.json:

      "xdebugSettings": {
        "resolved_breakpoints": "0"
      },

This will turn this feature off. Now there could be other side effects, I have not extensively tested such mode of operation.
I hope we can find the reason behind this.

Best,
Damjan

@daveromsey
Copy link
Author

Thank you very much, @zobo! I can confirm that "resolved_breakpoints": "0" fixed the issue for me. Also, thank you for the detailed breakdown of the logs.

@AnrDaemon
Copy link

I've seen a similar behavior with a little different experience.
The "invisible breakpoint" was set at the function definition, inside which an actual breakpoint was set.

@zobo
Copy link
Contributor

zobo commented Sep 18, 2021

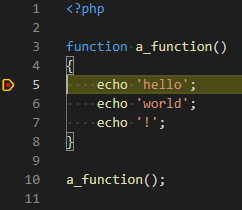
Yes, in case of functions, that is actually expected, because on the function definition line, there are no op codes. First next would be in the function.
image
image

Is this what you are saying with "invisible breakpoint"?

I can't reproduce the issue with any of the latest php/xdebug versions. So I'll close the issue.

@zobo zobo closed this as completed Sep 18, 2021
@AnrDaemon
Copy link

I've managed to reproduce this with PHP 7.1 and xdebug 2.8.1. Log attached.
vscode-phpdebug.log
vscode-phpdebug-filtered.log

@zobo
Copy link
Contributor

zobo commented Sep 19, 2021

Fantastic, will look at it asap. Is it the source from the initial post?

@AnrDaemon
Copy link

No, this is a simple two-files setup.
xx.php

<?php

require __DIR__ . "/xx-1.php";

f("xx");

xx-1.php

<?php

function f($xx) {
    print "$xx\n";
}

with breakpoint on "print".
This can be an xdebug issue, though. Considering log.

@AnrDaemon
Copy link

A related question, though.
Trying to get a reproducer, I've noticed that extension sends feature_set without prior feature_get to 3.0 client.
Is this real? I don't think it is a good idea.

@zobo
Copy link
Contributor

zobo commented Sep 20, 2021

Hi.
I looked at this more in depth and here are my findings. First let me say that that PHP 7.3 is at the end of it's support cycle, and Xdebug 2 is, I think, out of support.

That said, I took your refence versions and tried out combinations to get as high as possible. I could isolate the error on PHP 7.3(.3) between Xdebug 2.9.0 and 2.9.1. I then went to look at the Xdebug releases xdebug/xdebug@2.9.0...2.9.1 and found the original bug: https://bugs.xdebug.org/view.php?id=1727

I also tried to reproduce the issue on PHP 7.4 but as the mantis issue describes could not.

As you said, it's not an issue of this extension but of Xdebug, and has been fixed quite a while back (start of 2020).

Regarding your other question of feature_get. Yes, I skip feature detection if the engine reports "Xdebug" as name and version greater than 3. In that case I can already be sure that resolved_breakpoints, notify_ok and extended_properties features are available, and I can skip 3 roundtrips. Some people do remote debugging and although not much, this can reduce some overhead.

Do you feel there is a chance these features could be missing for any future version of Xdebug, or why do you feel we should continue checking for them? If you have a valid reason I can reinstate them, or we can ask Derick about what he thinks.

Best,
Damjan

@AnrDaemon
Copy link

My feelings more in line of being future-proof and having less maintenance overhead.

Sign up for free to join this conversation on GitHub. Already have an account? Sign in to comment
Labels
None yet
Projects
None yet
Development

No branches or pull requests

3 participants