Application developed using the Application Builder of COMSOL Multiphysics® v5.6 to calculate and evaluate the natural frequencies of rooms modeled in 3D.
The executable version for Windows (only x64) can be downloaded using any of the following links:
Steps to follow:
-
Execute the file Room_eigenmodes_simulator_v1.1.exe.
-
If a Windows Smart Screen warning message appears when you start the program, choose More Info > Run Anyway.
-
If it is detected by Windows Defender, add the program to the allowed list.
-
If this is the first time the application is being executed, the COMSOL Multiphysics® runtime environment necessary to run the application will be downloaded. Terms and conditions must be accepted and choose the installation folder (it is recommended to leave the default one).
The application starts with the geometric model by default (default.stl). A table containing a few of its natural frequencies is also showed.

It allows importing geometric models in .stl, .dwg, .dxf and other 3D CAD formats. It is recommended that models made in SketchUp to be exported in .stl format.
Open the website https://app.sketchup.com/app to create room models using SketchUp software tools for free, to be later imported into the application.
Draws the geometric model in the plot area.
Draws the calculation mesh in the plot area.
Allows increasing the resolution of the mesh and the angles between faces (the latter exclusively for .stl models).
Allows to select and hide contours (faces). Useful for observing pressure zones and isocurves within the enclosure.
Calculates the eigenfrequencies based on two input parameters:
- Minimum amount of frequencies to calculate: the default value is estimated to cover until the Schroeder frequency.
- Calculate from: indicates the lower frequency, although it could be even lower depending on the dimensions of the enclosure. It is generally recommended to leave this value at 20 Hz.
Once the natural frequencies have been calculated, they are shown in the table to the right of the plot.
Draw the pressure and isocurve maps using the color code shown on the right, which ranges from blue (minimum pressure areas), through white (cancellation areas) to red (maximum pressure areas). Enables the interactive controls below the chart, which allow the user to select the natural frequency to be displayed, play a pure tone of that frequency, control the behavior of the isocurves with a slider and select the number of levels to subdivide them.
Exports the table of calculated natural frequencies to a .txt file.
Produces an automatic report based on the following input data:
- Title
- Author
- Company
- Date
- Version
- Summary
Opens an Excel worksheet that allows observing the distribution of modes and performing an analysis according to Bonello's criteria. For its correct use, in the first instance the natural frequencies must be copied to the clipboard using the corresponding tool in the results table. Then, in the worksheet, the user must click on the Import Data button to carrying out the calculations and generating the necessary graphics for the analysis. A name must also be entered for the room. The results can be found in the Evaluation sheet.
The following information appears in the lower area of the application:
- Volume of the enclosure: automatically calculated.
- Reverberation time at mid frequencies Tmid : must be entered by the user.
- Schroeder frequency: with the Volume and Tmid data, the application calculates the cutoff frequency from which it is estimated that the wave behavior of the room is no longer relevant. This frequency should be taken as an approximation, since it will also depend on the morphology of the room under analysis.
Reproduces a pure tone at the selected natural frequency.
We proceed to use the Import model > STL tool and search for the conference.stl file inside the models/stl folder.

When inspecting the model, a low quality is verified in the morphology of the curved surfaces. To improve this, the Resolutions tool should be used. Since the imported file is .stl, it is possible to increase the angular resolution between faces. Select the Extra high option and verify that the curves have been considerably improved.
The resolution of the mesh can also be increased (which will increase the computation time). Generally, the default Normal should be used.

It should be noted that the adjustment of these resolutions is not mandatory, it will depend exclusively on the complexity of the model. The calculation can be carried out directly after importing the model since the application will use the default resolutions (Normal).
With the mouse it is possible to interact with the geometry. The left button rotates the view and the right button moves the current plane. Pressing and holding the scroll wheel and moving the mouse up and down, you can zoom-in and zoom-out. Holding Alt + left mouse button rotates the model in the current plane. These actions can also be carried out with the upper controls of the graphic panel.
Once the model is imported, the value of the Tmid must be entered. For this example, we will use 0.90 seconds, so the Schroeder frequency will be 96.6 Hz. Next, click on Calculate and you see that the application recommends obtaining at least 45 frequencies to reach the Schroeder frequency . Without modifying these values, proceed to calculate.

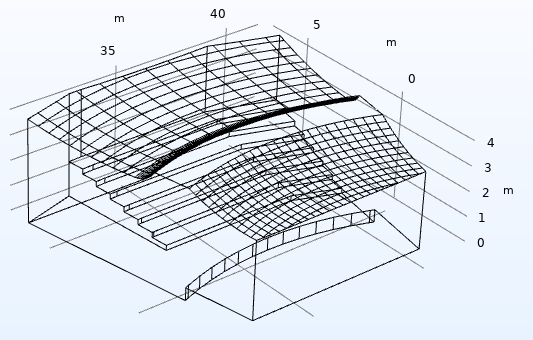
Once completed, observe that the eigenmode plot and the results table with the natural frequencies have been generated, which reach up to 105 Hz, thus covering the Schroeder frequency. To inspect within the room, some faces must be hidden using the Contours tool. Then, go back to Plot eigenmodes to continue the inspection.

Adjust the view, select the frequency of 49.3 Hz, a level division of 20 and interact with the slider to observe the behavior of the isocurves.

Finally, we proceed to carry out the eigenmode distribution study and the analysis according to the Bonello criterion. For this, copy the content of the results table to the clipboard with the corresponding tool. Then, click on Analysis Worksheet. Once open, click the Import Data button to import the frequencies. Next, name the room as "Conference" and we observe in the Evaluation sheet the following results:
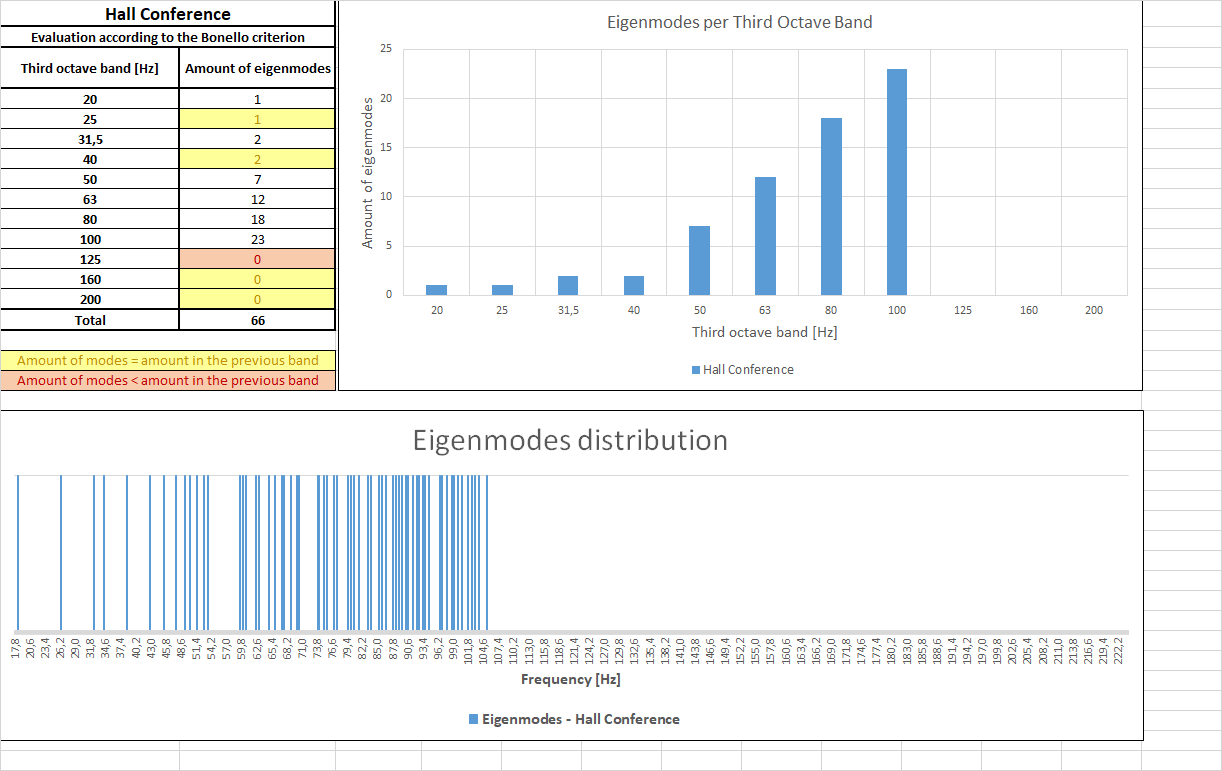
As can be seen, the study reaches up to the third octave band of 100 Hz, due to the cutoff by the Schroeder frequency. In this example, the mode distribution meets the Bonello criterion.
Due to its simplicity and speed of drawing, it is recommended to make the models using SketchUp. It allows the models to be exported in .stl format to be later imported into the application. If you do not have this program, there is a free online version that allows you to design and model rooms. Clicking on "SketchUp Online" icon will open the login page. You can create a Trimble account or connect with a Google or Apple account.

After the user is created, the home screen will appear. To start a new model, click Create New. It also allows you to open a .skp file stored on your computer.

Once the room is modeled, it is good practice to select all the faces, right-click, and choose the Make Group option. In this way, by right-clicking again and selecting the Entity Information option, the volume of the room must be seen. Otherwise, the model will have to be reviewed since it has not been closed, which will cause errors when trying to import it into the application.


Finally, to save the model on the computer, click on the drop-down menu and choose the option Download > STL. This file is the one that will be imported into the application.

Eng. Agustín Ylio Arias