
(中文版本请参看这里)
Health-checker for Nginx upstream servers (support http upstream && stream upstream)
This module can provide NGINX with the capability of active back-end server health check (supports health check of both four and seven back-end servers).
- Status
- Description
- Installation
- Usage
- Synopsis && Directive
- Bugs and Patches
- Author
- Copyright and License
- See Also
This nginx module is still under development, you can help improve and it.
The project is also well developed in development, and you are welcome to contribute code, or report bugs. Together to make it better.
If you have any questions, please contact me:
QQ:373882405mail: changxunzhou@qq.com
When you use nginx as a load balancer, nginx natively provides only basic retries to ensure access to a normal backend server.
In contrast, this nginx third-party module provides proactive health State Detection for back-end servers.
It maintains a list of back-end servers that guarantee that new requests are sent directly to a healthy back-end server.
Key features:
- Supports health detection for both four-tier and seven-tier back-end servers
- Four-layer supported detection type:
tcp/udp/http - Seven-layer supported detection Type:
http/fastcgi - Provide a unified http status query interface, output format:
html/json/csv/prometheus - Provide a unified http status query interface, output format:
html/json/csv/prometheus - Support judge status according to http response code or body like
check_http_expect_body ~ ".+OK.+";
git clone https://github.com/nginx/nginx.git
git clone https://github.com/zhouchangxun/ngx_healthcheck_module.git

cd nginx/;
git checkout branches/stable-1.12
git apply ../ngx_healthcheck_module/nginx_healthcheck_for_nginx_1.12+.patch

./auto/configure --with-stream --add-module=../ngx_healthcheck_module/
make && make install
nginx.conf example
user root;
worker_processes 1;
error_log logs/error.log info;
#pid logs/nginx.pid;
events {
worker_connections 1024;
}
http {
server {
listen 80;
# status interface
location /status {
healthcheck_status json;
}
# http front
location / {
proxy_pass http://http-cluster;
}
}
# as a backend server.
server {
listen 8080;
location / {
root html;
}
}
upstream http-cluster {
# simple round-robin
server 127.0.0.1:8080;
server 127.0.0.2:81;
check interval=3000 rise=2 fall=5 timeout=5000 type=http;
check_http_send "GET / HTTP/1.0\r\n\r\n";
check_http_expect_alive http_2xx http_3xx;
}
}
stream {
upstream tcp-cluster {
# simple round-robin
server 127.0.0.1:22;
server 192.168.0.2:22;
check interval=3000 rise=2 fall=5 timeout=5000 default_down=true type=tcp;
}
server {
listen 522;
proxy_pass tcp-cluster;
}
upstream udp-cluster {
# simple round-robin
server 127.0.0.1:53;
server 8.8.8.8:53;
check interval=3000 rise=2 fall=5 timeout=5000 default_down=true type=udp;
}
server {
listen 53 udp;
proxy_pass udp-cluster;
}
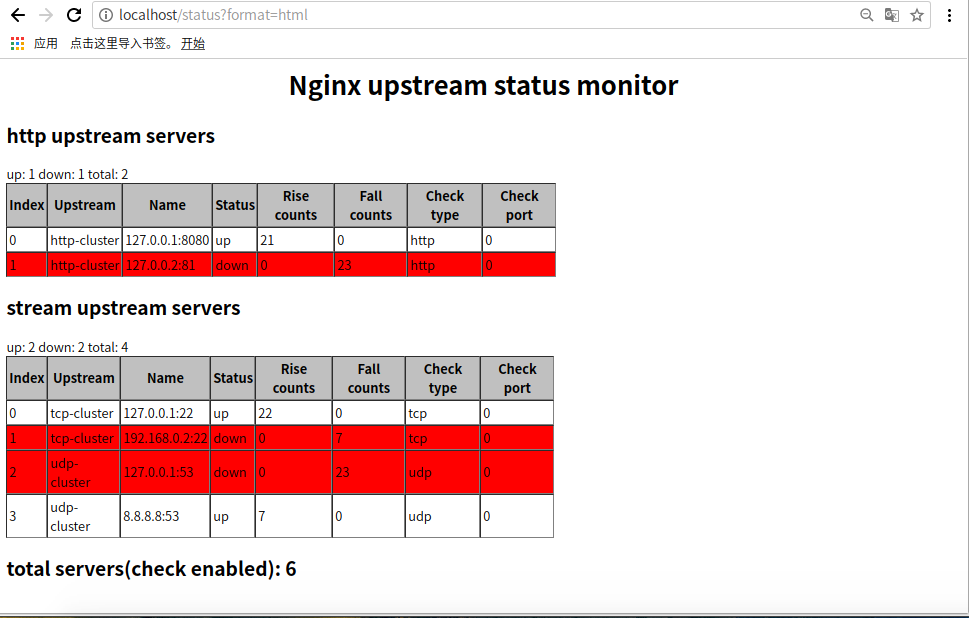
}status interface
One typical output is(json format)
root@changxun-PC:~/nginx-dev/ngx_healthcheck_module# curl localhost/status
{"servers": {
  "total": 6,
  "generation": 3,
  "http": [
    {"index": 0, "upstream": "http-cluster", "name": "127.0.0.1:8080", "status": "up", "rise": 119, "fall": 0, "type": "http", "port": 0},
    {"index": 1, "upstream": "http-cluster", "name": "127.0.0.2:81", "status": "down", "rise": 0, "fall": 120, "type": "http", "port": 0}
  ],
  "stream": [
    {"index": 0, "upstream": "tcp-cluster", "name": "127.0.0.1:22", "status": "up", "rise": 22, "fall": 0, "type": "tcp", "port": 0},
    {"index": 1, "upstream": "tcp-cluster", "name": "192.168.0.2:22", "status": "down", "rise": 0, "fall": 7, "type": "tcp", "port": 0},
    {"index": 2, "upstream": "udp-cluster", "name": "127.0.0.1:53", "status": "down", "rise": 0, "fall": 120, "type": "udp", "port": 0},
    {"index": 3, "upstream": "udp-cluster", "name": "8.8.8.8:53", "status": "up", "rise": 3, "fall": 0, "type": "udp", "port": 0}
  ]
}}
root@changxun-PC:~/nginx-dev/ngx_healthcheck_module#
or (prometheus format)
root@changxun-PC:~/nginx-dev/ngx_healthcheck_module# curl localhost/status
# HELP nginx_upstream_count_total Nginx total number of servers
# TYPE nginx_upstream_count_total gauge
nginx_upstream_count_total 6
# HELP nginx_upstream_count_up Nginx total number of servers that are UP
# TYPE nginx_upstream_count_up gauge
nginx_upstream_count_up 0
# HELP nginx_upstream_count_down Nginx total number of servers that are DOWN
# TYPE nginx_upstream_count_down gauge
nginx_upstream_count_down 6
# HELP nginx_upstream_count_generation Nginx generation
# TYPE nginx_upstream_count_generation gauge
nginx_upstream_count_generation 1
# HELP nginx_upstream_server_rise Nginx rise counter
# TYPE nginx_upstream_server_rise counter
nginx_upstream_server_rise{index="0",upstream_type="http",upstream="http-cluster",name="127.0.0.1:8082",status="down",type="http",port="0"} 0
nginx_upstream_server_rise{index="1",upstream_type="http",upstream="http-cluster",name="127.0.0.2:8082",status="down",type="http",port="0"} 0
nginx_upstream_server_rise{index="1",upstream_type="stream",upstream="tcp-cluster",name="192.168.0.2:22",status="down",type="tcp",port="0"} 0
nginx_upstream_server_rise{index="2",upstream_type="stream",upstream="udp-cluster",name="127.0.0.1:5432",status="down",type="udp",port="0"} 0
nginx_upstream_server_rise{index="4",upstream_type="stream",upstream="http-cluster2",name="127.0.0.1:8082",status="down",type="http",port="0"} 0
nginx_upstream_server_rise{index="5",upstream_type="stream",upstream="http-cluster2",name="127.0.0.2:8082",status="down",type="http",port="0"} 0
# HELP nginx_upstream_server_fall Nginx fall counter
# TYPE nginx_upstream_server_fall counter
nginx_upstream_server_fall{index="0",upstream_type="http",upstream="http-cluster",name="127.0.0.1:8082",status="down",type="http",port="0"} 41
nginx_upstream_server_fall{index="1",upstream_type="http",upstream="http-cluster",name="127.0.0.2:8082",status="down",type="http",port="0"} 42
nginx_upstream_server_fall{index="1",upstream_type="stream",upstream="tcp-cluster",name="192.168.0.2:22",status="down",type="tcp",port="0"} 14
nginx_upstream_server_fall{index="2",upstream_type="stream",upstream="udp-cluster",name="127.0.0.1:5432",status="down",type="udp",port="0"} 40
nginx_upstream_server_fall{index="4",upstream_type="stream",upstream="http-cluster2",name="127.0.0.1:8082",status="down",type="http",port="0"} 40
nginx_upstream_server_fall{index="5",upstream_type="stream",upstream="http-cluster2",name="127.0.0.2:8082",status="down",type="http",port="0"} 43
# HELP nginx_upstream_server_active Nginx active 1 for UP / 0 for DOWN
# TYPE nginx_upstream_server_active gauge
nginx_upstream_server_active{index="0",upstream_type="http",upstream="http-cluster",name="127.0.0.1:8082",type="http",port="0"} 0
nginx_upstream_server_active{index="1",upstream_type="http",upstream="http-cluster",name="127.0.0.2:8082",type="http",port="0"} 0
nginx_upstream_server_active{index="1",upstream_type="stream",upstream="tcp-cluster",name="192.168.0.2:22",type="tcp",port="0"} 0
nginx_upstream_server_active{index="2",upstream_type="stream",upstream="udp-cluster",name="127.0.0.1:5432",type="udp",port="0"} 0
nginx_upstream_server_active{index="4",upstream_type="stream",upstream="http-cluster2",name="127.0.0.1:8082",type="http",port="0"} 0
nginx_upstream_server_active{index="5",upstream_type="stream",upstream="http-cluster2",name="127.0.0.2:8082",type="http",port="0"} 0
root@changxun-PC:~/nginx-dev/ngx_healthcheck_module# Syntax
check interval=milliseconds [fall=count] [rise=count] [timeout=milliseconds] [default_down=true|false] [type=tcp|udp|http] [port=check_port]
Default: interval=30000 fall=5 rise=2 timeout=1000 default_down=true type=tcp
Context: http/upstream || stream/upstream
This command can open the back-end server health check function.
Detail
interval: the interval of the health check packet sent to the backend.fall(fall_count): the server is considered down if the number of consecutive failures reaches fall_count.rise(rise_count): the server is considered up if the number of consecutive successes reaches rise_count.timeout: timeout for the back-end health request.default_down: set the initial state of the server, if it is true, it means that the default is down, if it is false, is up. The default value is true, which is the beginning of the server that is not available, to wait for the health check package reaches a certain number of times after the success will be considered healthy.type: type of health check pack, now supports the following typestcp: simple tcp connection, if the connection is successful, it shows the back-end normal.udp: simple to send udp packets, if you receive icmp error (host or port unreachable), it shows the back-end exception.(Only UDP type checking is supported in the stream configuration block)http: send an HTTP request, by the state of the back-end reply packet to determine whether the back-end survival.
A example as followed:
stream {
    upstream tcp-cluster {
        # simple round-robin
        server 127.0.0.1:22;
        server 192.168.0.2:22;
        check interval=3000 rise=2 fall=5 timeout=5000 default_down=true type=tcp;
    }
    server {
        listen 522;
        proxy_pass tcp-cluster;
    }
    ...
}Syntax: healthcheck_status [html|csv|json|prometheus]
Default: healthcheck_status html
Context: http/server/location
A example as followed:
http {
    server {
        listen 80;

        # status interface
        location /status {
            healthcheck_status;
        }
     ...
}
You can specify the default display format. The formats can be html,
csv or json. The default type is html. It also supports to specify
the format by the request argument. Suppose your check_status location
is '/status', the argument of format can change the display page's
format. You can do like this:
/status?format=html
/status?format=csv
/status?format=json
/status?format=prometheus
At present, you can fetch the list of servers with the same status by
the argument of status. For example:
/status?format=json&status=down
/status?format=html&status=down
/status?format=csv&status=up
/status?format=prometheus&status=up
- add testcase.
- code style.
- feature enhance.
Please report bugs
- create GitHub Issue,
or submit patches by
- new Pull request
Chance Chou (周长勋) changxunzhou@qq.com.
The health check part is based on Yaoweibin's healthcheck module nginx_upstream_check_module (http://github.com/yaoweibin/nginx_upstream_check_module);
This module is licensed under the BSD license.
Copyright (C) 2017-, by Changxun Zhou changxunzhou@qq.com
Copyright (C) 2014 by Weibin Yao yaoweibin@gmail.com
All rights reserved.
Redistribution and use in source and binary forms, with or without modification, are permitted provided that the following conditions are met:
-
Redistributions of source code must retain the above copyright notice, this list of conditions and the following disclaimer.
-
Redistributions in binary form must reproduce the above copyright notice, this list of conditions and the following disclaimer in the documentation and/or other materials provided with the distribution.
THIS SOFTWARE IS PROVIDED BY THE COPYRIGHT HOLDERS AND CONTRIBUTORS "AS IS" AND ANY EXPRESS OR IMPLIED WARRANTIES, INCLUDING, BUT NOT LIMITED TO, THE IMPLIED WARRANTIES OF MERCHANTABILITY AND FITNESS FOR A PARTICULAR PURPOSE ARE DISCLAIMED. IN NO EVENT SHALL THE COPYRIGHT HOLDER OR CONTRIBUTORS BE LIABLE FOR ANY DIRECT, INDIRECT, INCIDENTAL, SPECIAL, EXEMPLARY, OR CONSEQUENTIAL DAMAGES (INCLUDING, BUT NOT LIMITED TO, PROCUREMENT OF SUBSTITUTE GOODS OR SERVICES; LOSS OF USE, DATA, OR PROFITS; OR BUSINESS INTERRUPTION) HOWEVER CAUSED AND ON ANY THEORY OF LIABILITY, WHETHER IN CONTRACT, STRICT LIABILITY, OR TORT (INCLUDING NEGLIGENCE OR OTHERWISE) ARISING IN ANY WAY OUT OF THE USE OF THIS SOFTWARE, EVEN IF ADVISED OF THE POSSIBILITY OF SUCH DAMAGE.
- nginx: http://nginx.org