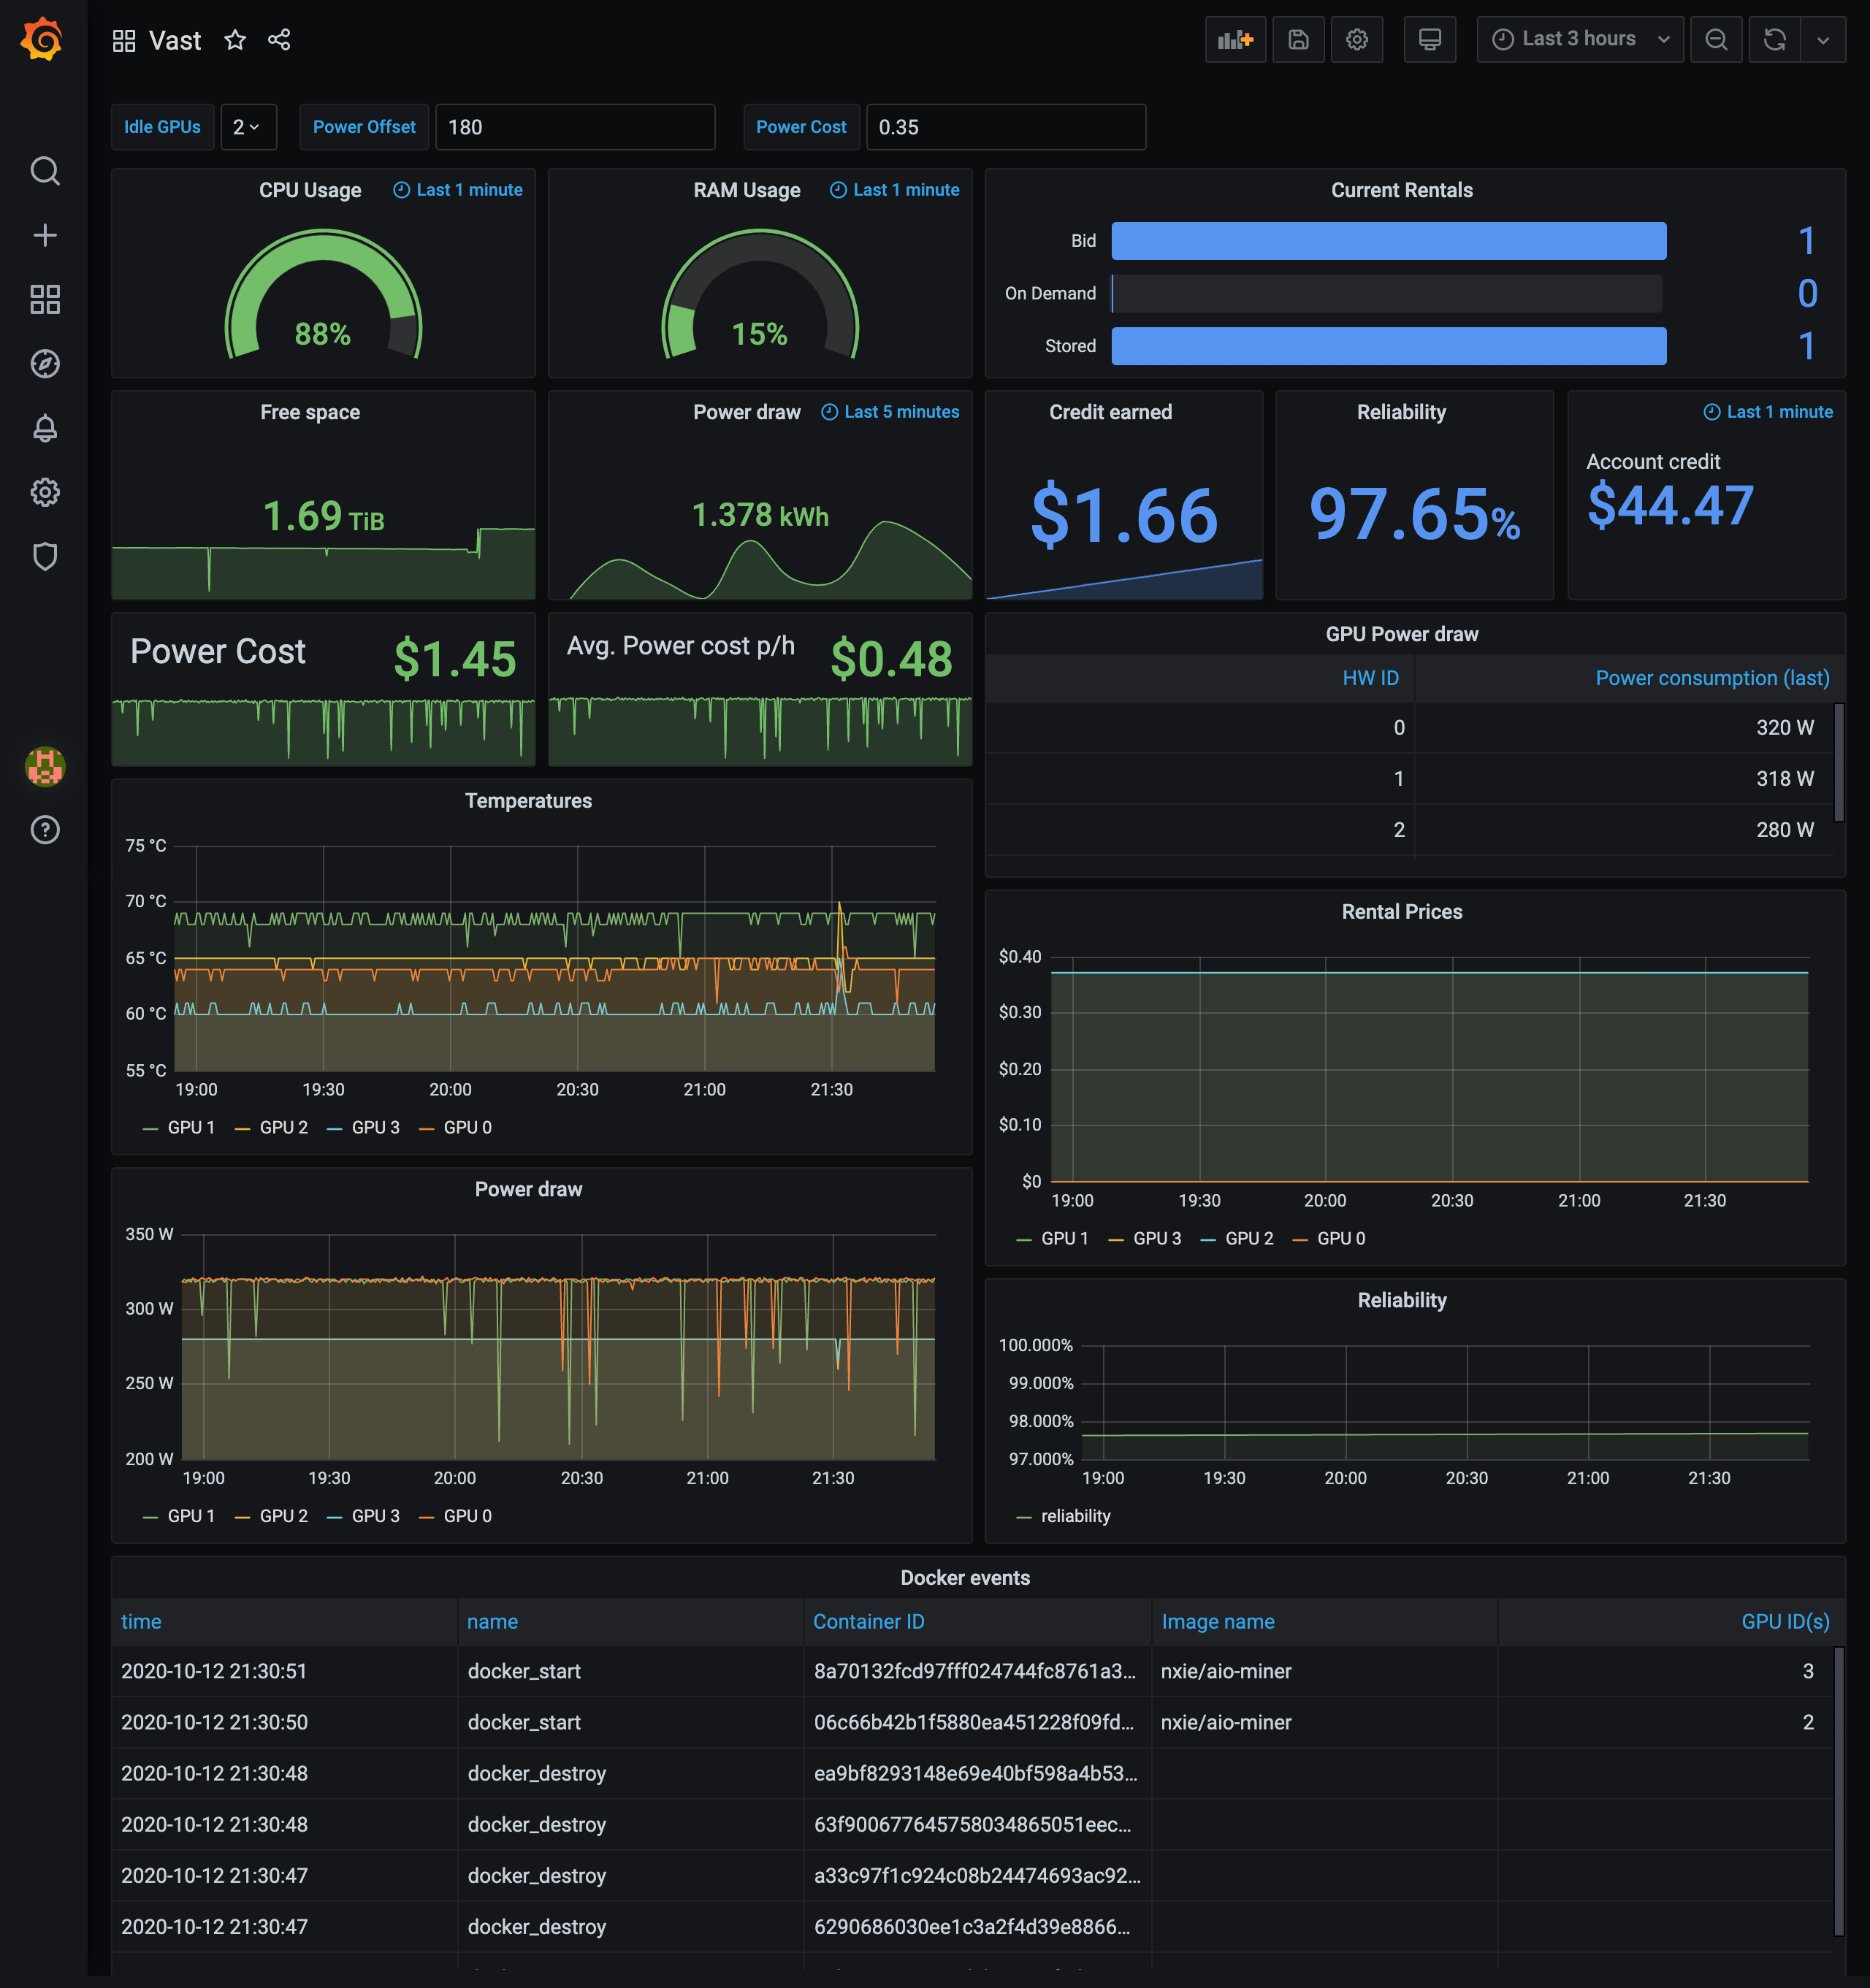
This is an analytics dashboard for remotely monitoring system information as well as tracking earnings.
NOTE: This is still a WIP. Not everything displayed is working properly and it needs lots of improvements like log rotation etc.
The server will host your database and Grafana dashboard. I recommend a $5 Ubuntu 18.04 server from Vultr. Use my referral link for $100 credit. https://www.vultr.com/?ref=8581277-6G Do not try run this on your rig, it can use up a lot of CPU and memory.
sudo apt install -y docker.io docker-compose
git clone https://github.com/leona/vast.ai-tools.git
cd vast.ai-tools/analytics/servernano docker-compose.yml
# Update the line that says MYSQL_ROOT_PASSWORDdocker-compose up -d- Go to your servers IP in your browser, e.g. 0.0.0.0 and login with the username & password "admin".
- Once logged in, on the bottom left add a "Data source" under settings. Choose mysql and enter the details below
database "vast"
host "db:3306"
password "Password you made in docker.compose.yml"
user "root"- Hit save
- Then in the sidebar again, add a dashboard and select "import". Use this file
- Select your dashboard and on the top there is options you can change for power cost, power offset and machine ID. You must set the machine ID to the same one as the client you setup below. You must create a dashboard for each Vast rig and set its machine ID.
On your vast machine, run the below command. Replacing the database connection details and your vast machine ID.
docker run \
  -e DB_HOST=0.0.0.0 \
  -e DB_USER=root \
  -e DB_PASSWORD=password \
  -e DB_NAME=vast \
  -e VAST_MACHINE_ID=1234 \
  -e LOG_SYS_INTERVAL=30 \
  -e LOG_ACC_INTERVAL=60 \
  --gpus all \
  --restart always \
  -v /var/lib/docker:/var/lib/docker \
  -v /var/run/docker.sock:/var/run/docker.sock \
  -v /var/lib/vastai_kaalia/api_key:/var/lib/vastai_analytics/api_key \
  --network host \
  --name vast-analytics -d \
nxie/vast-analyticscd vast.ai-tools/analytics/server
git pull origin master
docker-compose down
docker volume rm server_db
docker-compose up -dYou may also redo the dashboard.json step from the server setup to get the latest queries.
docker stop vast-analytics
docker rm vast-analytics
docker pull nxie/vast-analytics

# run client setup again