using SAS Studio 🖥


Lasiandra Finance Inc. (LFI) New York, USA is a leading private financing company which caters the funding needs of Small and Medium enterprises (SME). LFI clearly understood that some business dreams need that extra push to see them accelerated. Hence it allows its loaning process as tailor-made and customer centric. In the past few years, it has tremendously expanded its wings and to speed up the process, it needs to automate the loan eligibility process based on customer portfolio entered online.
The main problem faced by the LFI is the approval process of the loans. Because it is a complicated procedure of verification and validation but still there is no guarantee whether the chosen applicant is the deserving one out of all applicants. Hence, it needs a machine learning model which can predict the loan approval.
As data scientist in LFI, it is needed to analyze the data set obtained from the past customer and build logistic regression model to predict the approval process.
- Analyze customer data provided in data set (EDA)
- Build logistic regression that can predict loan approval
👉 There are 2 data sets used in this project, "TRAINING_DS.csv" and "TESTING_DS.csv".
👉 There are 13 variables in this data sets:
- 8 categorical variables,
- 4 continuous variables, and
- 1 variable to accommodate the loan ID
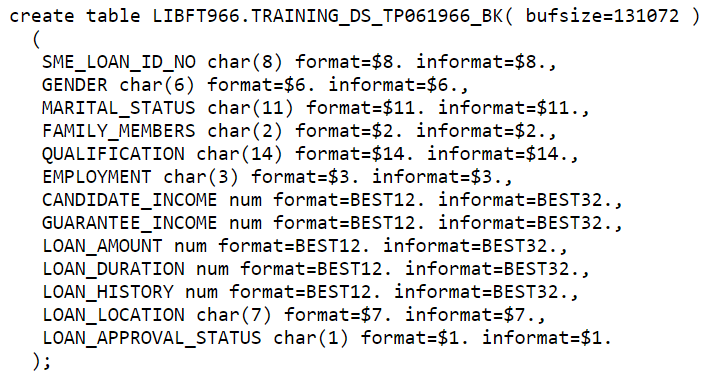
👉 The structure of the two data sets that have been given:
| Variable Name | Description | Sample Data | Available in Data Set | Variabel Type | Data Type | Length |
|---|---|---|---|---|---|---|
| SME_LOAN_ID_NO | Loan reference number (unique ID) |
TRAINING_DS, TESTING_DS | Categorical | Char | 8 | LP001002; LP001003; … |
| GENDER | Applicant gender (Male or Female) |
TRAINING_DS, TESTING_DS | Categorical | Char | 6 | Male; Female |
| MARITAL_STATUS | Applicant marital status (Married or not married) |
TRAINING_DS, TESTING_DS | Categorical | Char | 11 | Married; Not Married |
| FAMILY_MEMBERS | Numberof family members owned by applicant | TRAINING_DS, TESTING_DS | Categorical | Char | 2 | 0;1; 2; 3+ |
| QUALIFICATION | Applicant qualification (graduate or under graduate) |
TRAINING_DS, TESTING_DS | Categorical | Char | 14 | Graduate; Under Graduate |
| EMPLOYMENT | Applicant employment status (yes or no) |
TRAINING_DS, TESTING_DS | Categorical | Char | 3 | Yes; No |
| CANDIDATE_INCOME | Applicant’s monthly salary/income | TRAINING_DS, TESTING_DS | Continuous | Numeric | 8 | 5849; 4583; … |
| GUARANTEE_INCOME | Earnings of both applicants | TRAINING_DS, TESTING_DS | Continuous | Numeric | 8 | 1508; 2358; … |
| LOAN_AMOUNT | Loan amount (in thousands) |
TRAINING_DS, TESTING_DS | Continuous | Numeric | 8 | 128; 66; … |
| LOAN_DURATION | The loan’s repayment period | TRAINING_DS, TESTING_DS | Categorical | Numeric | 8 | 360; 120; … |
| LOAN_HISTORY | Records of previous loans | TRAINING_DS, TESTING_DS | Categorical | Numeric | 8 | 0; 1 |
| LOAN_LOCATION | The location of loan (city/village/town) | TRAINING_DS, TESTING_DS | Categorical | Char | 7 | City; Village; Town |
| LOAN_APPROVAL_STATUS | Approval status of loan | TESTING_DS | Categorical | Char | 1 | Y; N |
-
GENDER

- 13 LFI customers had an unidentified gender due to missing values in the dataset.
- Furthermore, the dataset has an uneven distribution between male and female loan applicants, with the percentage of male applicants is 81.36% (489 male applicants).
- In comparison, the percentage of female applicants is only 18.64% (112 female applicants)
-
MARITAL_STATUS

- Three loan applicants in the training dataset had an unknown marital status due to missing values.
- The dataset has an uneven distribution between married and not married loan applicants, with the percentage of married applicants is 65.14% (398 married applicants).
- In comparison, the percentage of not married applicants is only 34.86% (213 not married applicants)
-
FAMILY_MEMBERS

- 15 loan applicants in the training dataset had an unidentified number of family members due to missing values.
- As many as 57.6% (345 applicants) have 0 family members, 17.03% (102 applicants) have one family member.
- Moreover, as many as 16.86% (101 applicants) have two family members.
- 8.51% (51 applicants) have three or more family members.
-
QUALIFICATION

- There are no missing values or no applicants with unidentified qualifications in the dataset.
- The dataset has an uneven distribution between graduated and under graduated applicants, with the percentage of graduated applicants is 78.18% (480 graduated applicants).
- In comparison, the percentage of under graduated applicants is only 21.82% (134 under graduated applicants).
-
EMPLOYMENT

- 32 loan applicants in the training dataset had an unknown employment status due to missing values.
- The dataset has an uneven distribution between yes (employed) and no (unemployed) loan applicants, with the percentage of no (unemployed) applicants is 85.91% (500 unemployed applicants).
- While the percentage of not yes (employed) applicants is only 14.09% (82 employed applicants).
-
LOAN_HISTORY

- 50 loan applicants in the training dataset had an unidentified history of loan applicants due to missing values.
- As many as 57.6% (345 applicants) have 0 family members, 17.03% (102 applicants) have one family member.
- Moreover, as many as 16.86% (101 applicants) have two family members.
- 8.51% (51 applicants) have three or more family members.
-
LOAN_LOCATION

- There are no missing values or no applicants with unidentified qualifications in the dataset.
- As many as 32.9% (202 applicants) live in the city, 37.95% (233 applicants) live in the town.
- Moreover, as many as 29.15% (179 applicants) live in the village
-
LOAN_APPROVAL_STATUS

- There are no missing values or no applicants that had unidentified loan approval status in the dataset.
- The dataset has an uneven distribution between approved loans (Y) and rejected loans (N), with the percentage of the approved loan (Y) is 68.73% (422 applicants).
- The percentage of the rejected loan (N) is 31.27% (192 applicants).
-
CANDIDATE_INCOME

- It can be seen that there are no missing values or no applicants that had unidentified income in the dataset
- Both the histogram, mean and median values indicate that the data distribution for this variable is positively skewed, with the median 3,812.5 and mean 5,403.46
- Based on the standard deviation, mean, and maximum value, it can be determined that this variable contains extreme outliers because the maximum value is greater than the (mean + 3x standard deviation) value.
-
GUARANTEE_INCOME

- There are no missing values or no applicants that had unidentified guarantee income in the dataset.
- Both the histogram, mean and median values indicate that the data distribution for this variable is positively skewed, with the median 1188.50 and mean 1621.25
- Based on the standard deviation, mean, and maximum value, it can be determined that this variable contains extreme outliers because the maximum value is greater than the (mean + 3x standard deviation) value.
-
LOAN_AMOUNT

- There are 22 missing values.
- Both the histogram, mean and median values indicate that the data distribution for this variable is positively skewed, with the median 128 and mean 146.4121622
-
LOAN_DURATION

- It can be seen that there are 14 missing values.
- Both the histogram, mean and median values indicate that the data distribution for this variable is positively skewed, with the median 360 and mean 342


-
GENDER - MARITAL_STATUS

- Most male applicants are already married (92.01%). In contrast, the majority of female applicants are not yet married (38.01%).
- The percentage of female applicants who are already married is only 7.99%, while the percentage of male applicants who are not yet married is 61.90%.
- There are 16 missing data due to three missing values for married status and thirteen missing values for gender.
-
FAMILY_MEMBERS - QUALIFICATION

- The majority of loan applicants who are graduates do not have any family members (58.64%).
- Most loan applicants who are undergraduates do not have any family members (53.85%).
- Graduates with one family member are 17.27%, while undergraduates with one family member are 16.15%.
- The percentage of graduates with two family members is 16.42%, while undergraduates with two family members are 18.46%.
- The percentage of graduates with three or more family members is 7.68%, while undergraduates with three or more family members are 11.54%.
- There are 15 missing values; this is since there are 15 missing data for family members but no missing value for qualification.
-
EMPLOYMENT - LOAN_HISTORY

- It can be seen that 86% of unemployed loan applicants have good loan history.
- The loan applicants who are also unemployed have bad loan history with a percentage of 86.36%.
- It can be seen that the percentage of applicants that are employed and have bad loan history is 13.64%, and the percentage of applicants that are employed and have good loan history is 14.00%.
- There are 76 missing values because there are 32 missing values in employment, 50 missing values in loan history, and the remaining missing values for employment and loan history.
-
LOAN_LOCATION - LOAN_APPROVAL_STATUS

- Most loan applications that got rejected belong to applicants from cities and villages, with both percentages being 35.94%.
- It can be seen that the percentages of rejected loan applications from towns are lower than loan applications from cities and villages (28.13%).
- It can be seen that most loan applications that got accepted are from a town with a percentage of 42.42%.
- It can be seen that the percentage of approved loan applications from the city is 31.52% and from the village is 26.07%.
- It can be seen that there are no missing values from the loan location variable and the loan approval status variable.
-
GENDER - LOAN_APPROVAL_STATUS

- It can be seen that the majority of approved loan applications comes from male applicants, with a percentage of 81.88%.
- It can also be seen that most rejected loan applications come from male applicants, with 80.21%.
- The percentage of female applicants with approved loan applications is 18.12%. The percentage of female applicants with rejected loan applications is 19.79%
- There are 13 missing values, with 13 missing values in the gender variable and none in loan approval status.
-
LOAN_APPROVAL_STATUS - CANDIDATE_INCOME

- It can be seen from the box plot that there are lots of outliers in candidate income.
- For both box plots, it can be seen that the distribution is positively skewed because the median value is closer to the lower quartile.
- The table shows that both maximum values for approved and rejected loan applications are more significant than the mean value, indicating extreme outliers in the dataset.
-
LOAN_APPROVAL_STATUS - GUARANTEE_INCOME

- It can be seen from the box plot that there are lots of outliers in guarantee income
- For rejected loan applications box plots, it can be seen that the distribution is positively skewed because the median value is closer to the lower quartile.
- For the approved loan applications box plot, it can be seen that the distribution is slightly negatively skewed because the median value is slightly closer to the top quartile.
- Both maximum values for approved and rejected loan applications are more significant than the mean value, indicating extreme outliers in the dataset
-
LOAN_APPROVAL_STATUS - LOAN_AMOUNT

- It can be seen from the box plot that there are lots of outliers in the loan amount.
- For both loan applications box plots, it can be seen that the distribution is slightly positively skewed because the median value is slightly closer to the lower quartile.
- The table shows that both maximum values for approved and rejected loan applications are more significant than the mean value, indicating extreme outliers in the dataset.
-
CANDIDATE_INCOME - GUARANTEE_INCOME

- It can be seen that from the tables and scatter plot that there is a negative correlation with -0.11660.
- The correlation coefficient is significant at the 95 per cent confidence interval, as it has a p-value of 0.0038, indicating that it holds for the whole population.
-
LOAN_AMOUNT - LOAN_DURATION

- It can be seen that from the tables and scatter plot that there is a positive correlation between candidate income and guarantee income 0.03945.
- This correlation coefficient between loan amount and loan duration is not significant at the 95 per cent confidence interval (p-value = 0.3438).


-
GENDER

- 11 LFI customers had an unidentified gender due to missing values in the dataset.
- The dataset has an uneven distribution between male and female loan applicants, with the percentage of male applicants is 80.34% (286 male applicants) and the percentage of female applicants is only 19.66% (70 female applicants).
-
MARITAL_STATUS

- There are no missing values.
- The dataset has an uneven distribution between married and not married loan applicants, with the percentage of married applicants is 63.49% (233 married applicants) and the percentage of not married applicants is only 36.51% (134 not married applicants).
-
FAMILY_MEMBERS

- 10 loan applicants in the testing dataset had an unidentified number of family members due to missing values.
- As many as 56.02% (200 applicants) have 0 family members, 16.25% (58 applicants) have one family member, 16.53% (59 applicants) have two family members, and 11.20% (40 applicants) have three or more family members.
-
QUALIFICATION

- There are no missing values or no applicants with unidentified qualifications in the dataset.
- The dataset has an uneven distribution between graduated and under graduated applicants, with the percentage of graduated applicants is 77.11% (283 graduated applicants).
- The percentage of under graduated applicants is only 22.89% (84 under graduated applicants).
-
EMPLOYMENT

- 23 loan applicants in the training dataset had an unknown employment status due to missing values.
- The dataset has an uneven distribution between yes (employed) and no (unemployed) loan applicants, with the percentage of no (unemployed) applicants is 89.24% (307 unemployed applicants) while the percentage of not yes (employed) applicants is only 10.76% (37 employed applicants).
-
LOAN_HISTORY

- 29 loan applicants in the training dataset had an unidentified history of loan applicants due to missing values.
- The dataset has an uneven distribution between an applicant that has good loan history (1) and an applicant that has bad loan history (0), with the percentage of applicants that have bad loan history (0) is only 17.46% (59 applicants).
- The percentage of applicants with good loan history (1) is 82.54% (279 applicants).
-
LOAN_LOCATION

- There are no missing values or applicants with unidentified loan locations in the dataset.
- As many as 38.15% (140 applicants) live in the city, 31.61% (116 applicants) live in the town, and 30.25% (111 applicants) live in the village.
-
CANDIDATE_INCOME

- It can be seen that there are no missing values or no applicants that had unidentified income in the dataset
- Both the histogram, mean and median values indicate that the data distribution for this variable is positively skewed, with the median 3,786 and mean 4,805.6.
-
GUARANTEE_INCOME

- It can be seen that there are no missing values or no applicants that had unidentified guarantee income in the dataset.
- Both the histogram, mean and median values indicate that the data distribution for this variable is positively skewed, with the median 1025 and mean 1569.58.
-
LOAN_AMOUNT

- It can be seen that there are five missing values.
- Both the histogram, mean and median values indicate that the data distribution for this variable is positively skewed, with the median 125 and mean 136.1325967.
-
LOAN_DURATION

- It can be seen that there are six missing values.
- Both the histogram, mean and median values indicate that the data distribution for this variable is positively skewed, with the median 360 and mean 342.5373961.


-
GENDER - MARITAL_STATUS

- It can be seen that in both the frequency table and the mosaic plot, the majority of male applicants are already married (88.70%), while the majority of female applicants are not yet married (34.92%).
- The percentage of female applicants who are already married is only 11.30%, while the percentage of male applicants who are not yet married is 65.08%.
- There are 11 missing data due to 11 missing values for gender
-
FAMILY_MEMBERS - QUALIFICATION

- It can be seen that the majority of loan applicants who are graduates do not have any family members (58.39%).
- Most loan applicants who are undergraduates do not have any family members (48.19%).
- Graduates with one family member are 17.15%, while undergraduates with one family member are 13.25%.
- The percentage of graduates with two family members is 14.96%, while undergraduates with two family members are 21.69%.
- The percentage of graduates with three or more family members is 9.49%, while undergraduates with three or more family members are 16.87%.
- There are ten missing values, since there are ten missing data for family members, but no missing value for qualification.
-
EMPLOYMENT - LOAN_HISTORY

- It can be seen that 87.59% of unemployed loan applicants have good loan history. The loan applicants who are also unemployed have a bad loan history with 96%.
- It can be seen that the percentage of applicants that are employed and have bad loan history is 4%, and the percentage of applicants that are employed and have good loan history is 12.41%.
- There are 51 missing values because there are 23 missing values in employment and 28 missing values in loan history.
-
GENDER - QUALIFICATION

- It can be seen that most male undergraduate loan applicants are higher than graduate male loan applicants.
- Undergraduate males have a percentage of 82.50%, while male graduates have a percentage of 79.71%.
- Graduate women have a percentage of 20.29%, while undergraduate women have a percentage of 17.50%.
- It can be seen that there are 11 missing values from the gender variable and 0 missing values in the qualification variable.
-
GENDER - LOAN_LOCATION

- It can be seen that most male applicants come from the village with a percentage of 83.33%.
- Male applicants come from the city, only 81.75% and male applicants come from town are 75.68%.
- The majority of female applicants come from a town with a percentage of 24.32%.
- Female applicants from the city are only 18.25%, female applicants from the village are only 16.67%.
- There are 11 missing values, with 11 missing values in the gender variable and none in loan approval status.
-
FAMILY_MEMBERS - LOAN_LOCATION

- It can be seen that the majority of applicants who do not have family members come from villages with a percentage of 57.27%.
- Applicants who do not have family members from the town have 55.86%, and those from the city have a percentage of 55.15%.
- Applicants who have one family members majority come from a town with a percentage of 18.02%.
- Applicants with one family member from the village have a percentage of 16.36%, and those from the city have 14.71%.
- Applicants who have two family members majority come from villages with a percentage of 20%.
- Applicants with two family members from the city have a percentage of 16.16%, and those from the city have 13.51%.
- Applicants who have three or more family members majority come from cities with a percentage of 13.97%.
- Applicants with three or more family members from the town have a percentage of 12.61%, and those from villages have a percentage of 6.36%.
- There are ten missing values with ten missing values in the family members variable and none in loan location.
-
GENDER - CANDIDATE_INCOME

- It can be seen from the box plot that there are lots of outliers in candidate income.
- It can be seen that candidate income for male are much higher (mean = 4932.86) compare to female (mean = 4163.60).
- For both box plots, it can be seen that the distribution is positively skewed because the median value is closer to the lower quartile.
- Both maximum values for female and male applicants are more significant than the mean value, indicating extreme outliers in the dataset.
-
MARITAL_STATUS - GUARANTEE_INCOME

- It can be seen from the box plot that there are lots of outliers in guarantee income.
- The guaranteed income is higher for married applicants (mean = 1627.12) than unmarried applicants (mean = 1459.53).
- For not married applicants box plots, it can be seen that the distribution is positively skewed because the median value is closer to the lower quartile.
- For the married applicant's box plot, it can be seen that the distribution is slightly negatively skewed because the median value is slightly closer to the top quartile.
- Both maximum values for married and unmarried applicants are more significant than the mean value, indicating extreme outliers in the dataset.
-
EMPLOYMENT - LOAN_AMOUNT

- It can be seen from the box plot that there are lots of outliers in the loan amount.
- The loan amount is more significant for employed applicants (mean = 150.1891892) than for unemployed applicants (mean = 133.7218543).
- It can be seen that the distribution is slightly positively skewed because the median value is slightly closer to the lower quartile.
- Both maximum values for employed and unemployed applicants are more significant than the mean value, indicating extreme outliers in the dataset.
-
CANDIDATE_INCOME - GUARANTEE_INCOME

- It can be seen that from the tables and scatter plot that there is a negative correlation between candidate income and guarantee income with -0.11033.
- This correlation coefficient is significant at the 95 per cent confidence interval, as it has a p-value of 0.0346.
-
LOAN_AMOUNT - LOAN_DURATION

- It can be seen that from the tables and scatter plot that there is a positive correlation between candidate income and guarantee income 0.09495.
- The correlation coefficient is not significant at the 95 per cent confidence interval, with a p-value of 0.0736.
-
CANDIDATE_INCOME - LOAN_DURATION

- It can be seen that from the tables and scatter plot that there is a positive correlation between candidate income and loan duration 0.02325.
- The correlation coefficient is not significant at the 95 per cent confidence interval, with a p-value of 0.6598.


👉 The data imputation will be described as follows:
| Training | Mode | Gender |
|---|---|---|
| Family Members | ||
| Marital Status | ||
| Employment | ||
| Loan History | ||
| Mean | Loan Amount | |
| Loan Duration | ||
| Testing | Mode | Gender |
| Family Members | ||
| Employment | ||
| Loan History | ||
| Mean | Loan Amount | |
| Loan Duration |
👉 Summary: all the categorical variables will be imputed using mode, while all the continuous variables will be imputed using mean.

👉 The dataset on which the model was built has been correctly cleaned.
👉 There are no more missing values (the number of observations reads and used is the same enabling the model to use every observation in the dataset).
👉 The response profile reveals a highly unbalanced percentage between the two classes within the dependent variable, loan approval status, with a ratio of about 1:2 between N and Y.

👉 The Convergence Status of the Model is “Satisfied,” and the AIC value is smaller than SC.
👉 These two examples demonstrate that the Logistic Regression Model is an effective predictor.

👉 It can be seen that marital status, loan history, and loan location has a significant correlation to loan approval status since the p-value is less than 0.05.

👉 The p-value column “Pr > ChiSq” indicates that not all variables in the model are significant.
👉 A p-value of less than 0.05 indicates that the variable significantly affects loan approval status variation.
👉 Loan location and marital status impact loan approval choices.
👉 It can be observed that work status and gender have little impact on loan approval results.

👉 There are extra columns at the end of the dataset and the standard variables.
👉 Each column contains an estimated result from the model together with the estimated probability.

👉 There is 1 new column showing the results of the status prediction output from the loan approval.
👉 In addition, in addition to the new column that has been created, there is a probability of the loan application being rejected (N) and a probability of the loan application being accepted (Y).
👉 If you find this project useful, please ⭐ this repository 😆!
🎈 Check out my works on Kaggle here using similar data set with 91% accuracy!
👉 More about myself: here