This repo contains the results and source code from our crowdsourced experiments (see our InfoVis'14 paper for details) to estimate perceptual kernels for color, shape, size and combinations thereof.
- Introduction
- How to use the data and source code in this repo?
- What is a perceptual kernel?
- Why care about perceptual kernels?
What is a perceptual kernel? It is a distance matrix derived from aggregate perceptual judgments. In its basic form, a perceptual kernel contains pairwise perceptual dissimilarity values for a specific set of perceptual stimuli---we refer to this set as a palette. In our study, we estimate perceptual kernels for the following six palettes.

There can be several alternative ways for experimentally constructing perceptual kernels.
For example, we construct perceptual kernels from subjective similarity judgments.
Psychology literature offers several task types for these judgments.
How to choose one? What is the most effective judgment task in the context of perceptual
kernels? So, understanding the trade-offs between different designs of judgment tasks is important.
We estimate five perceptual kernels for each of the palettes above using the five different
judgment tasks: pairwise rating on a 5-point Likert scale (L5) and on a 9-point Likert scale (L9),
triplet ranking with matching (Tm) and with discrimination (Td), and manual spatial arrangement (SA).
You can run any of these experiments by following the links below.
- shape-l5, l9, sa, tm, td
- color-l5, l9, sa, tm, td
- size-l5, l9, sa, tm, td
- shapecolor-l5, l9, sa, tm, td
- shapesize-l5, l9, sa, tm, td
- sizecolor-l5, l9, sa, tm, td
There are several ways to use the data and source code provided here. To start, get a local copy of the directory structure, either using git commands or by downloading and uncompressing the zipped repo.
You can directly access the final perceptual kernels and use them for your own purposes, research or otherwise. You will see thirty kernels in data/kernels/ folder. These are symmetric, normalized matrices stored as comma-seperated text files. File names denote the variable and judgment task types used. For example, color-sa.txt is a perceptual kernel for the color palette that was elicited using spatial arrangement (SA). The kernels under data/kernels are all filtered and aggregated as discussed in our paper.You can also access the raw datasets in data/raw, which include unprocessed per-subject measurements. You can use the raw data, e.g., to perform your own custom data processing and agregation or, more interestingly, per-subject data analysis.
By clicking the corresponding links below, you can visualize any kernel in our dataset. Resulting views will be identical to the views generated by runningview/showkernel.js locally.
- shape-l5, l9, sa, tm, td
- color-l5, l9, sa, tm, td
- size-l5, l9, sa, tm, td
- shapecolor-l5, l9, sa, tm, td
- shapesize-l5, l9, sa, tm, td
- sizecolor-l5, l9, sa, tm, td
npm install d3 will install
the d3 module for you). The kernels in data/kernels can be then viewed as interactive grayscale heatmaps and two-dimensional scatter plots by running view/showkernel.js from the command line. For example,
./showkernel.js color-tmwill draw the corresponding color kernel as a grayscale heatmap in your default browser along with a two-dimensional projection of the kernel, where in-plane distances between the colors approximate the perceptual distances of the kernel. We obtain the projection points with multidimensional scaling on the perceptual kernel.
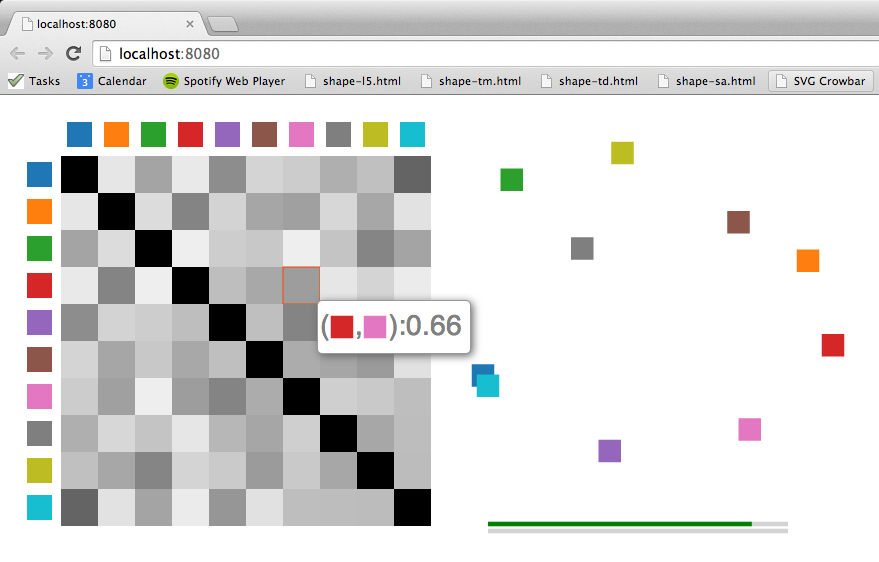
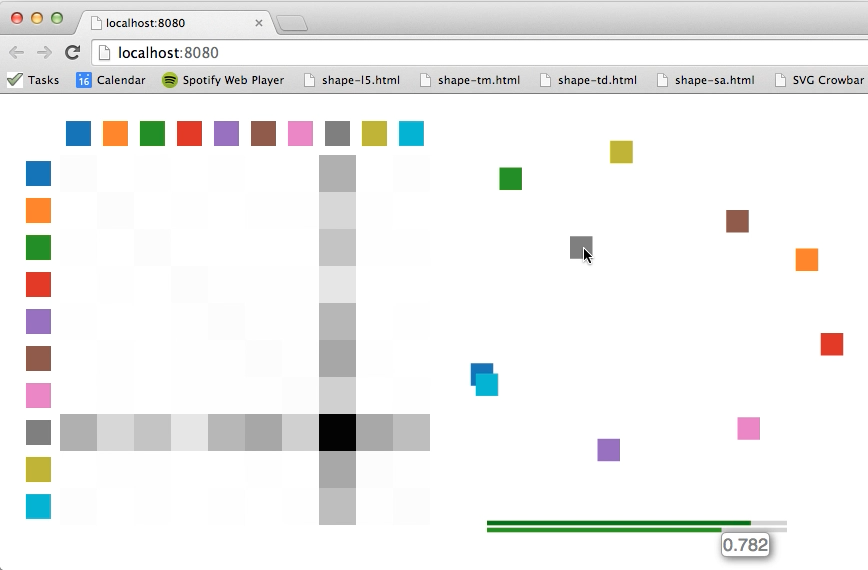
Hovering over a cell of the heatmap will show the corresponding perceptual kernel distance in a tooltip. Similarly, hovering over a projection point will isolate the corresponding row and column in the heatmap. The two bars under the projection scatter plot show the overall and per-row (or column) rank correlations between the perceptual kernel and the distance matrix directly derived from the planar projection. They are there to give you an idea about the accuracy of the projection with respect to the kernel distances as two-dimensional projections are lossy representations in general.
In addition to accessing the data, you can reproduce and extend our experiments using the source code provided. Each experiment is designed to be as self-contained as possible. For example, if you would like to see the experiment setup produced color-sa.txt, you can go to exp/color/sa/ directory. You can check out the task interface by opening color-sa.html in your browser. We recommend you go through and complete the task to understand what it entails. If you want to reproduce this experiment (or other experiments in exp/, for that matter), you need to first install Amazon Mechanical Turk Command Line Tools and then set two environment variables: MTURKCLT_HOME, which should point the installation directory for Amazon's command line tools, and STUDY_HOME , which should point your local perceptual-kernels directory. Now, take a look at color-sa.properties, which contains the properties of the experiment, from its summary description to the number and qualifications of subjects (Turkers) requested. Since the goal is to repeat the experiment, you don't need to edit this file but make sure you understand its contents. You will need, however, to edit the files color-sa.html and color-sa.question.In order to run the experiment in a test mode on Amazon's Mechanical Turk sandbox, uncomment the following line in color-sa.html
<form id="form" autocomplete="off" method="POST" action="https://workersandbox.mturk.com/mturk/externalSubmit">and make sure the next line
<form id="form" autocomplete="off" method="POST" action="https://www.mturk.com/mturk/externalSubmit">is commented out. Of course, you shouldn't do this if you want to use the production site.
color-sa.html implements the task as a dynamic single page web application.
Next step is to make it publicly available so that Turkers can access it embedded in an iframe
on Amazon's site. Copy color-sa.html (with its dependencies)
somewhere on your web server and provide its url address within <ExternalURL></ExternalURL> tags in color-sa.question. If you are using an http server (as opposed to https),
remember to remove the http keyword from the url address---see color-sa.question for an example. Make sure that the .js and .css files that color-sa.html uses are also publicly accessible, either on your web server or somewhere else on the web. Assuming you have set up your Amazon Mechanical Turk account properly, you are now ready to upload the task by running the script runSandbox.sh. This will try to upload the task on Amazon Mechanical Turk's sandbox site and, if successful, will create a file called color-sa.success. Note that runSandbox.sh calls $MTURKCLT_HOME/bin/loadHITs.sh with -sandbox argument. If you're ready to use the production site, you should run runProduction.sh, while making sure service_url in $MTURKCLT_HOME/bin/mturk.properties is set to the Amazon Mechanical Turk's production site.
Subject judgments from triplet experiments are stored in data/raw/*-{tm,td}.txt files. For example, data/raw/color-tm.txt contains the rank-ordered triplets for the color palette. Each raw triplet file has 20 lines (rows) of M comma-separated indices. Each line corresponds to a single subject's sequentially-listed M/3 triplet judgments. M equals 414 for univariate palettes and 1782 for bivariate. A triplet in our case is a set of ordered indices i, j, k of the respective palette elements xi, xj, and xk, where the subject indicated that xi is more similar to xj than it is to xk. In other words, perceptual_distance(xi, xj) < perceptual_distance(xi, xk) for the subject.
We derive a perceptual kernel from these triplet orderings through generalized non-metric multidimensional scaling.
You can simply use the Matlab functions in shared/matlab/ to turn triplet judgments of multiple subjects into an aggregated, normalized distance matrix of perceptual dissimilarities (i.e., perceptual kernel).
For example, running K = rawTripletToKernel('../data/raw/color-tm.txt') from Matlab command line in shared/matlab/ would compute a perceptual kernel for the color palette using the triplet matching judgments of 20 subjects stored in data/raw/color-tm.txt.
Perceptual kernels are distance matrices derived from aggregate perceptual similarity judgments. Here is an example of a perceptual kernel:
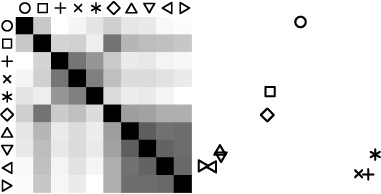
(Left) A crowd-estimated perceptual kernel for a shape palette. Darker entries indicate perceptually closer (similar) shapes. (Right) A two-dimensional projection of the palette shapes obtained via [multidimensional scaling](http://en.wikipedia.org/wiki/Multidimensional_scaling) of the perceptual kernel.
Visualization design benefits from careful consideration of perception, as different assignments of visual encoding variables such as color, shape and size affect how viewers interpret data. Perceptual kernels represent perceptual differences between and within visual variables in a reusable form that is directly applicable to visualization evaluation and automated design. In other words, perceptual kernels provide a useful operational model for incorporating empirical perception data directly into visualization design tools.
Here are few examples of how the kernels can be used.
Given an estimated perceptual kernel, we can use it to revisit existing palettes. For example, we can choose a set of stimuli that maximizes perceptual distance or conversely minimizes perceptual similarity according to the kernel. The following shows the n most discriminable subsets of the shape, size, and color variables. (We include size for completeness, though in practice this palette is better suited to quantitative, rather than categorical, data.) To compute a subset with n elements, we first initialize the set with the variable pair that has the highest perceptual distance. We then add new elements to this set, by finding the variable whose minimum distance to the existing subset is the maximum (i.e., the Hausdorff distance between two point sets).

Perceptual kernels can also guide visual embedding to choose encodings that preserve data-space distance metrics in terms of kernel-defined perceptual distances. To perform discrete embeddings, we find the optimal distance-preserving assignment of palette items to data points. The following scatter plot compares color distance measures.

The plotting symbols were chosen automatically using visual embedding. We use the correlation matrix of the color models below as the distances in the data domain, and the triplet matching (Tm) kernel for the shape palette as the distances in the perceptual range.
| Kernel (Tm) | CIELAB | CIEDE2000 | Color Name | |
|---|---|---|---|---|
| Kernel (Tm) | 1.00 | 0.67 | 0.59 | 0.75 |
| CIELAB | 0.67 | 1.00 | 0.87 | 0.81 |
| CIEDE2000 | 0.59 | 0.87 | 1.00 | 0.77 |
| Color Name | 0.75 | 0.81 | 0.77 | 1.00 |
Rank correlations between a crowd-estimated perceptual-kernel of the
color palette and the kernels derived from the existing color distance models for
the same palette. Higher values indicate more similar kernels.
This automatic assignment reflects the correlations between the variables. The correlation between CIELAB and CIEDE2000 is higher than the correlation between the triplet matching kernel and color names, and the assigned shapes reflect this relationship perceptually. For example, the perceptual distance between upward- and downward-pointing triangles is smaller than the perceptual distance between circle and square.
In a second example, we use visual embedding to encode community clusters in a character co-occurrence graph derived from Victor Hugo’s novel Les Miserables. Cluster memberships were computed using a standard modularity-based community-detection algorithm. For the data space distances, we count all inter-cluster edges and then normalize by the theoretically maximal number of edges between groups. To provide more dynamic range, we re-scale these normalized values to the range [0.2,0.8]. Clusters that share no connecting edges are given a maximal distance of 1. We then perform separate visual embeddings using univariate color and shape kernels (both estimated using triplet matching). As shown in the following figure, the assigned colors and shapes perceptually reflect the inter-cluster relations.
