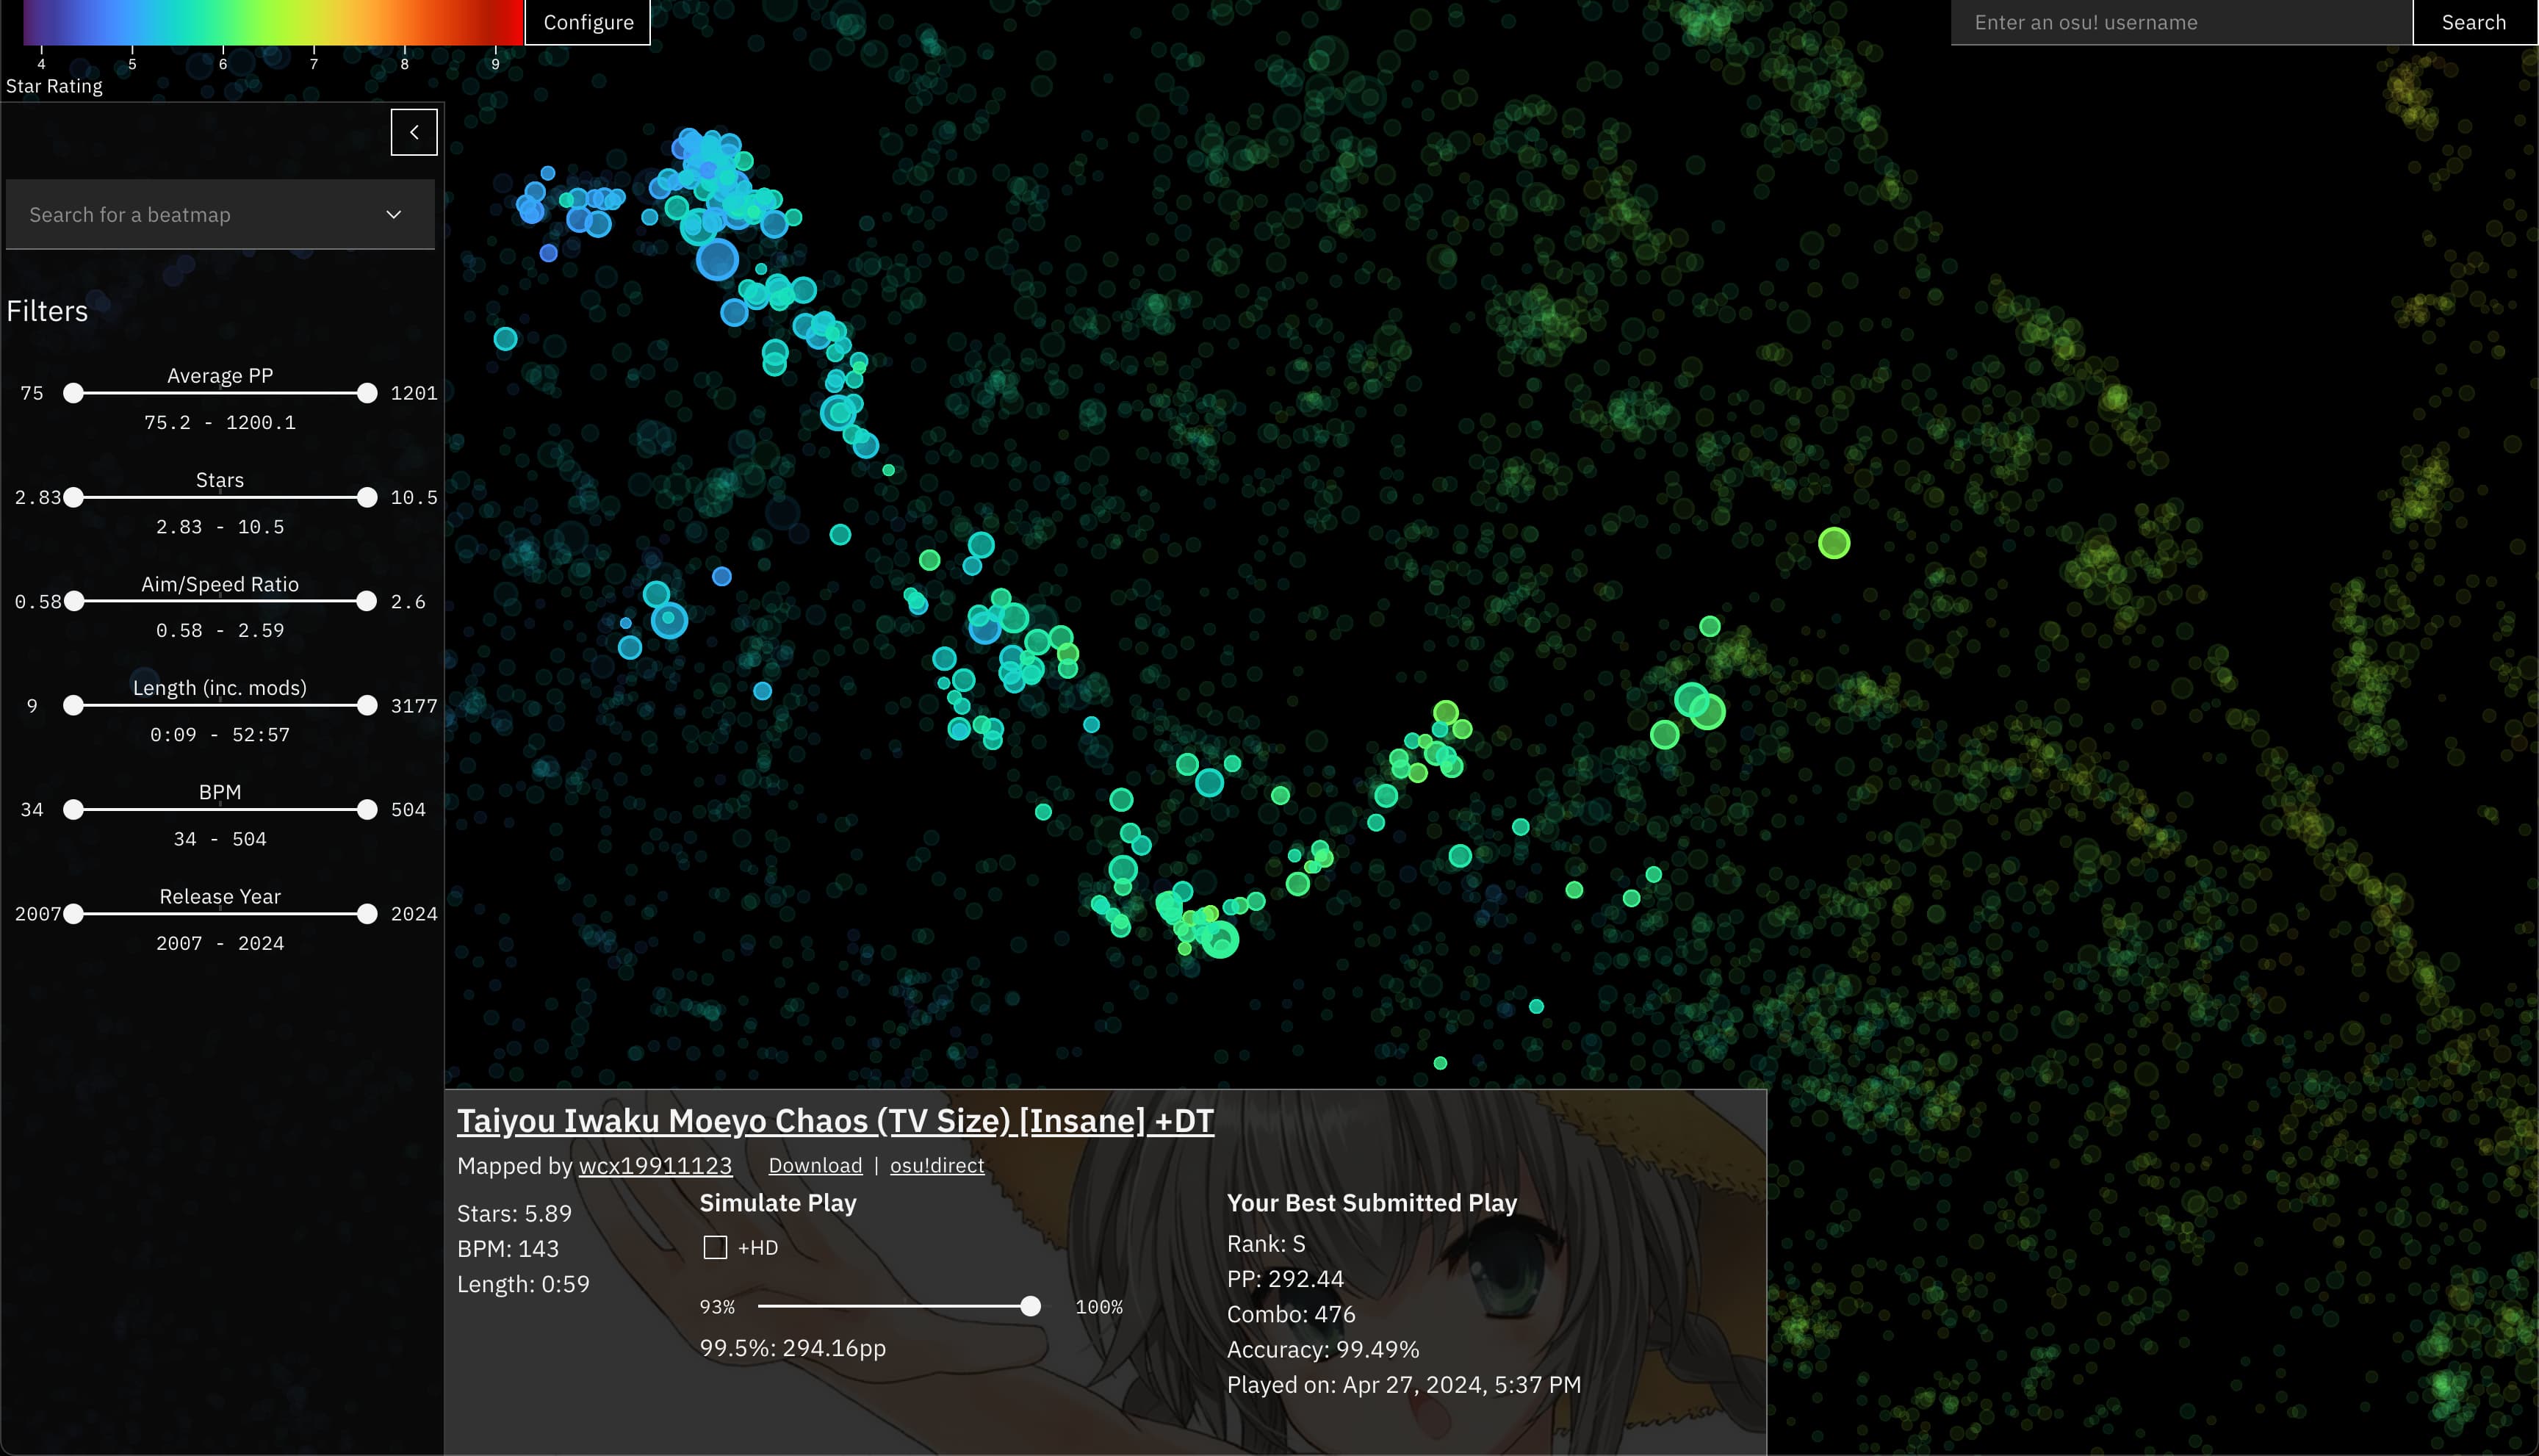
An interactive atlas of osu! beatmaps. Plots relationships between maps, visualizes patterns and trends in osu! play over time, and helps visualize your own hiscores and playstyle compared to the universe of osu!.
Try it out: https://osu-atlas.ameo.dev/
I've created similar projects like this for Spotify artists and anime, and I figured that it'd be very cool (probably even cooler tbh) to do it for osu! as well. The data is rich, has many categorial properties, and the tool could be of actual use to people rather than just a curiosity.
Hiscore data collected over several years from osu!track is used as the data source for this project. Using that, an embedding is produced which places similar beatmaps close to each other. Check out notebooks/README for more technical details on that.
All of the data used to create the embedding came from osu!track. The beatmaps in all tracked users' top plays were used to determine relationships between different maps and construct the embedding.