Find dominant colors in images and LUTs with QT and OpenCV, with a nice GUI to show results in 3D color spaces

- v2.3 - Added a button to load a .cube LUT file instead of an image - it is immediately computed and can be visualized as usual
- v2.2 - Adapted to recent Qt and OpenCV versions + OKLAB color space
- v2.1 - GUI improvements + added filters when quantizing (greys, percents) + added CMYK in palette CSV file + save palettes for popular graphics software like Photoshop, Corel Draw and Paintshop Pro
- v2 - added interesting color spaces + lettered axes and visible specter boundaries in 3d view + color conversion button + select/hide colors + bug-fixed Eigen method that was limited to 128 levels + palette cleaning + many other bug fixes
- v1 - checked conversion formulas against online calculators: all good!
- v0.1 - more accurate and several color spaces added
- v0 - launch
The present code is under GPL v3 license, that means you can do almost whatever you want with it!
I used bits of code from several sources, which are cited when possible within the code
Lately I paid great attention to colors in my photo editing process. Delicately tuning colors can greatly improve an already good photo, to make it stunning!
I wanted to analyze how the colors in my photos were distributed. I tried to find tools on the internet, but none of them had all I wanted, so I started coding once again. The first version was only a color wheel... now you can visualize the results in full 3D, in the most-known color spaces + a 3D color wheel!
'The first version was only a color wheel"... This software lacks an important feature that wouldn't make sense in 3D color spaces: analyzing how the colors in an image/painting/photo interact with each other. This is exactly what you will get in the improved version ot my Color Wheel software here: https://github.com/AbsurdePhoton/dominant-colors-rgb-wheel
Developed using:
- Linux Ubuntu 22.04
- QT Creator 6.0.2
- Requires these libraries:
- QT 6
- openCV 4.6 compiled with openCV-contribs - should work with 3.x versions without much editing
- OpenGL - I used deprecated functions starting from v3.1, but it works under Ubuntu with my GeForce 1080 Ti
This software should also work under Microsoft Windows: if you tried it successfully please contact me, I'd like to offer compiled Windows executables
Don't forget to edit the compilation options at the bottom of the file "dominant-colors-3d-color-space.pro", I tweaked them for my own computer!
- Help is available within the GUI, with each element's tooltip. Just hover your mouse
- All is on one window, the tool is pretty simple once acquainted

-
Just click the "Load image" button
-
You have two options before loading:
- Reduce size: the bigger the image, the longer you wait! Tests have shown that reducing the image to 512 pixels doesn't affect much the dominant colors distribution. It also helps with noisy images
- Gaussian blur: you might not want to reduce the image, but image noise can affect results VS what you really perceive. The solution is to apply a 3x3 Gaussian blur that helps smooth surfaces
-
Instead of an image, you can load a .cube LUT file, 1D or 3D LUTs accepted
-
LUTs are 3D lookup tables used to alter the colors in an image or a video, they are widely used in cinema to add a mood or give a visual identity. More info about LUTs here:https://en.wikipedia.org/wiki/3D_lookup_table
-
After loading the file, just wait a little and you will get a visualization of the target colors of the LUT. It is computed without the grays filter or the percentage filter, options you can change later. By default 512 color levels are used, but you can change that value and recompute up to 1024
-
If you change the default options, just click the "Quantize" button again - more about that later

-
How many dominant colors do you want? Choose wisely, bigger values take greater time to compute (you have a timer but not in real-time)
-
You have to choose the algorithm first. Two are at your service:
- Eigen vectors: the fastest - source: http://aishack.in/tutorials/dominant-color/ (was limited to 128 colors, I extended that)
- K-means: a well-known algorithm to aggregate significant data - source: https://jeanvitor.com/k-means-image-segmentation-opencv/
-
Click QUANTIZE to finish: you end up with a 3D view, a quantized image and a palette. The elapsed time is shown on the LCD display
-
If the number of colors you wanted exceeds the number of colors in the image, the number of colors is adjusted and shown in red after computation
-
You can choose to filter the image before quantizing in two ways that can be combined:
- 'Filter grays': what is really meant is gray AND near-blacks AND near-whites, which are after all different kinds of grays! It helps getting only colors in the resulting palette. The image is filtered in HSL color space:
- Saturation S < 25% - corresponding to grays
- Lightness L < 15% - corresponding to blacks
- Lightness L > 80% - corresponding to whites
- 'Filter < x%': it simply ignores colors that represent less than x% in the whole image (not including greys if the other filter is set)
- Both filters are likely to reduce the number of colors you asked
- 'Filter grays': what is really meant is gray AND near-blacks AND near-whites, which are after all different kinds of grays! It helps getting only colors in the resulting palette. The image is filtered in HSL color space:
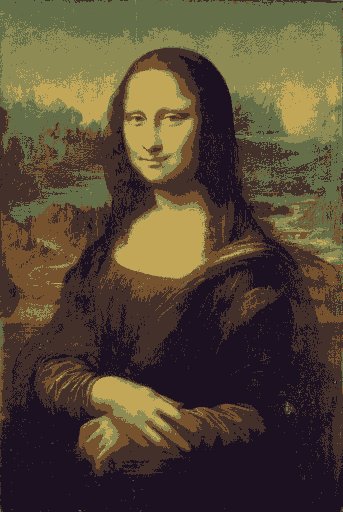
How efficient are the two algorithms ? To check, I just had to test my tool on images and well-known palettes. You can find several known palettes in the "examples" folder, to check the algorithms accuracy
The two methods seem pretty good at first glance. Even more when you click on the Palette: a perfect match for both! The difference between the two methods will only be seen with complex images: K-means is based partly on random seeds, so the best result (of 100 runs) is kept and is a bit different each time.

-
The palette shows all the dominant colors and their percentage of use. Don't set the number of colors over 250 if you want quality, the palette image is only 1025 pixels long
-
The Quantized image shows the image transposed to the dominant colors Palette. This way you can visually check if the number of dominant colors chosen at the beginning is sufficient or too wide
-
Use the Sort selector to organize colors in several ways, using the values from the color spaces or percentage of use. Note that no algorithm exists to perfectly sort colors: it looks like a simple task but in fact... see here : https://www.alanzucconi.com/2015/09/30/colour-sorting/
-
You can left-click with your mouse on any color in the Quantized image or the Palette, to get information:
- RGB values of picked color, in decimal and hexadecimal
- percentage of use in the quantized image
- color name. Sometimes it is poetic, and sometimes it is just a code. This information was tricky to develop:
- I used a text file containing more than 9000 RGB values and corresponding color names from http://mkweb.bcgsc.ca/colornames
- if the exact RGB value is found the name is displayed, if not the nearest color is displayed (using the euclidian distance in RGB color space between the two colors)
- remember to put color-names.csv in the same folder as the executable (particularly in your compiling folder)
-
CTRL + left mouse button on a color in the Palette or Quantized image will select the color: it is identified with a white circle in the 3D view. Do it again to deselect. When a color is selected it is also shown on the Quantized image
-
ALT + left mouse button on a color will hide it from the 3D view. Do it again to get it back into view. This can be useful when a color sphere hides many other because its percentage of use is high (it happens a lot with images with a strong dominant color, e.g. very dark photos)
-
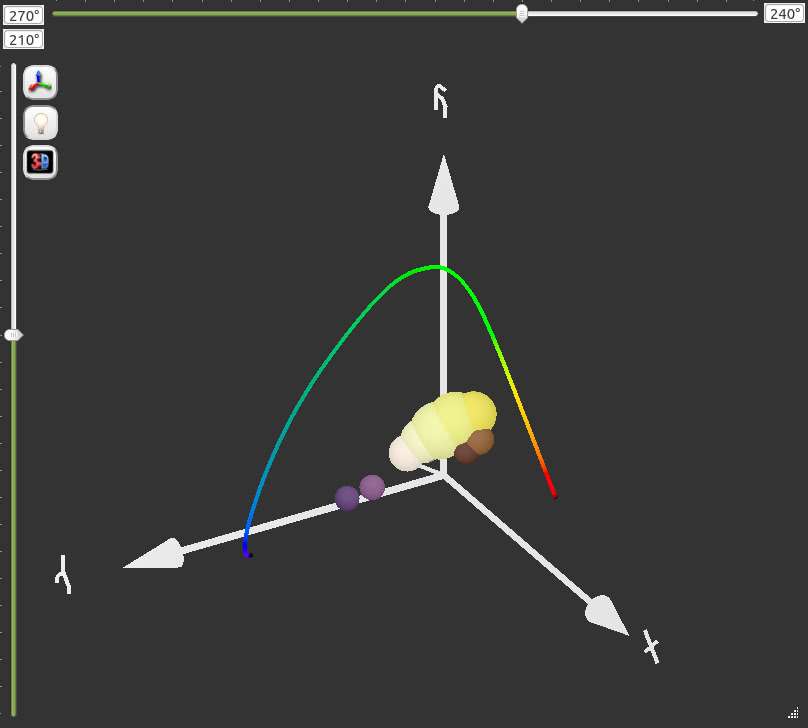
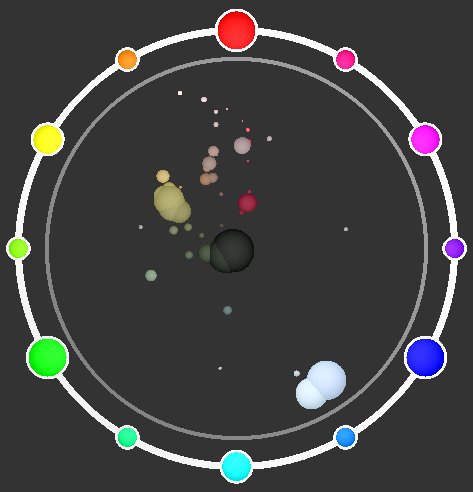
The 3D view is where the dominant colors of the image are now displayed:
- it shows the dominant colors, so it can help you analyze how a photo or painting colors are distributed
- you can easily visualize / understand the color distribution: the sphere size of a dominant color is the percentage of this color in the whole image
- you have several color spaces in which to display the colors, each has its pros and cons
- you can easily navigate with your mouse + keyboard
-
Controls :
- to use keyboard keys in the 3D space, be sure the focus is on it, not in a combo box fox example
- left mouse button: hold and drag your mouse to rotate the view on the x and y axes (you can also use page-up, page-down, home and end keys, or the big sliders, or the boxes near the sliders)
- CTRL + left mouse button: hold and drag left-right to rotate the view on the z axis (you can also use insert and delete keys)
- right mouse button: drag to move the view on the x and y axes (you can also use left, right, up and down keys)
- X, Y and Z rotation values are displayed in boxes, in degrees
- the Reset button resets the zoom, center x and y, and x y and z rotation values to something that fits the current color space well
- the Full screen button makes the 3D view... full screen! Use the ESC key or the Exit button to quit fullscreen mode. A button to save the current view is also at the top-left corner
-
Light: give more depth (shadows and light) to the spheres representing the colors - it is prettier BUT the colors become non-accurate. Use the Light switch to turn light on and off

- If you want to save the results, click on the "Save results" button. They will be saved with the provided file name + suffixes:
- Palette: filename-palette.png
- Color space: filename-color-space-XXX.png
- Quantized image: filename-quantized.png
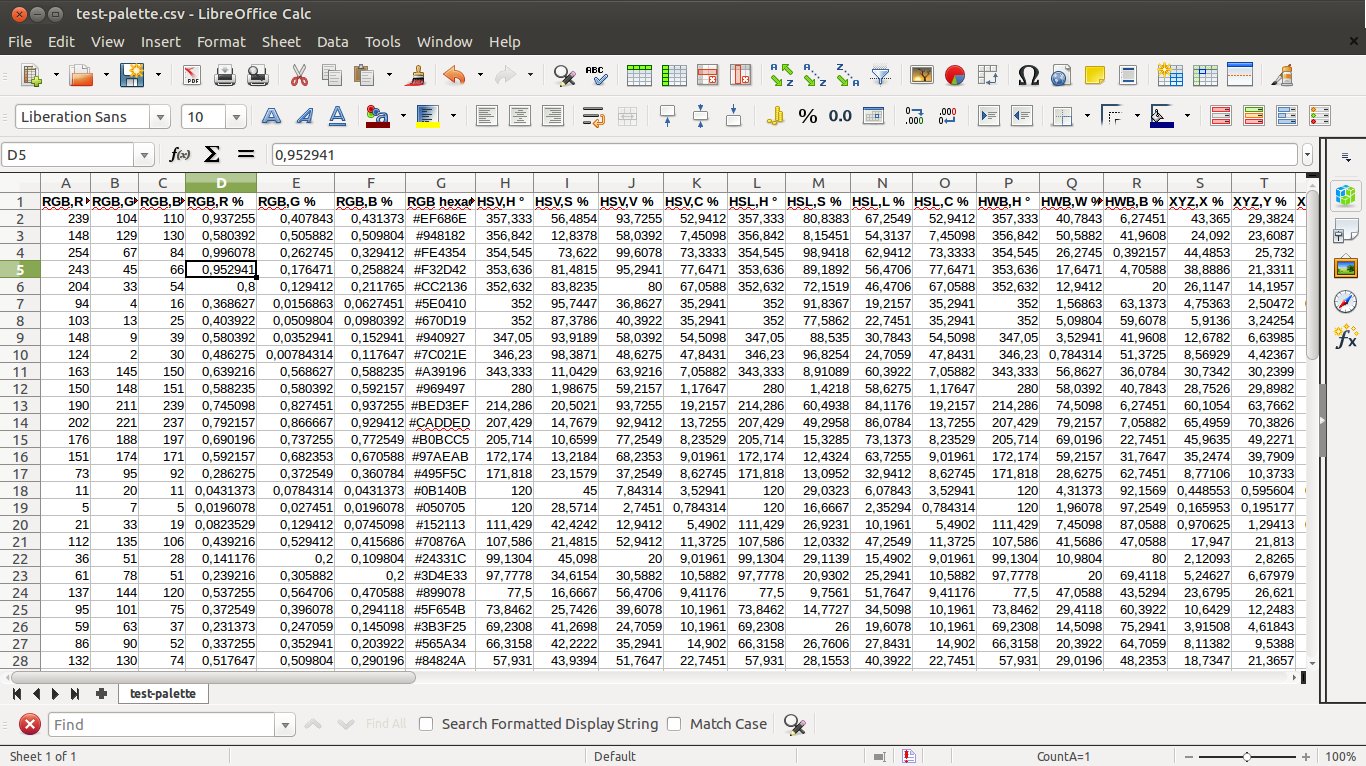
- CSV file of palette: filename-palette.csv - RGB values (decimal and hexadecimal) + all known color space values + percentage of use are saved - you can easily import it with LibreOffice Calc! Nota: I forced the decimal separator to be a dot, because french people (like me) use a comma: be sure to edit the .csv file to replace dots with commas if you are in this case before importing. It is for the same reason that the separator in the .csv file is a semicolon and not a comma...
- Palettes for popular software like Photoshop (.ACT), Paintshop Pro (.PAL text file using RGB value) and Corel Draw (.PAL text file using CMYK values)
-
The hardest part to code! Lots of maths, lots of trial-and-error. I spent a LOT of time checking my results against online conversion tools... anyway if you find errors or misunderstandings, please let me know. Bruce Lindbloom's site was of great help! http://www.brucelindbloom.com/index.html?Math.html
-
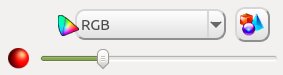
You can visualize the dominant colors palette in any of the following color spaces:
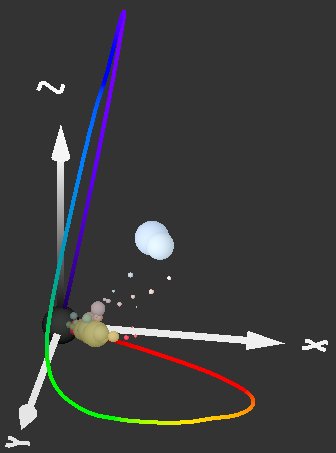
- RGB: just a cube with Red, Green and Blue as axes. Simple to understand, all the details here: https://en.wikipedia.org/wiki/RGB_color_space - a variant is the RGB triangle, similar to CIE xyY color space

- HSV, HSL, HCV, HCL: these spaces are based on Hue. The difference between them is they don't use exactly the same units: Lightness, "Value" (similar to Lightness but not exactly the same), Chroma, and Saturation. The global shape of these spaces is a cylinder or cone. More here: https://en.wikipedia.org/wiki/HSL_and_HSV
- HWB: more simple to understand than HSV or HSL, HWB is also based on Hue, but with a percentage of White and Black values. The space shape is conical. See here: https://en.wikipedia.org/wiki/HWB_color_model

- CIE XYZ and xyY: an imaginary color space, which I chose to represent with the famous horse-shoe colored shape in the xyY version. The white point is defined at CIE D65. XYZ is the basis of several CIE color spaces, so they will be converted to reference whitepoint D65, too (more here : https://en.wikipedia.org/wiki/Illuminant_D65). Also, the color boundaries shown on all CIE spaces are from the CIE 2° CMFs values (got them on this site : http://cvrl.ucl.ac.uk/cmfs.htm), showing the limits of visible colors calculated from wavelength values of light in the 390 (violet) to 700 nm (red) range. In some color spaces the color values can exceed the visible spectrum for humans, so these "colors" don't really exist in the real world: they are qualified as "imaginary"
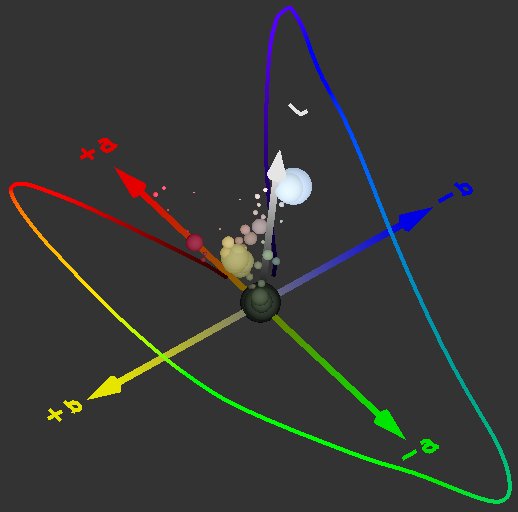
- CIE L* a* b*: directly based on CIE XYZ, CIE L* a* b* is widely used, for exemple in Photoshop. It is pretty easy to understand and visualize. In the output .CSV files, you will also find CIE LCHab values, which is CIE L* a* b* in cylindrical coordinates. CIE XYZ and L* a* b* information here: https://en.wikipedia.org/wiki/CIE_1931_color_space
- CIE L* u* v*: another conversion from CIE XYZ, CIE L* u* v* is a bit different, focusing on perceptual uniformity. In the produced .CSV files, you will also find CIE LCHuv values, which is CIE L* u* v* in cylindrical coordinates. Information here: https://en.wikipedia.org/wiki/CIELUV

- Hunter Lab: directly computed from CIE XYZ, it is in fact the ancestor of Lab*! Its shape is similar to Lab with differences mainly in blues and yellows. Hunter Lab information here: https://en.wikipedia.org/wiki/CIELAB_color_space#Hunter_Lab

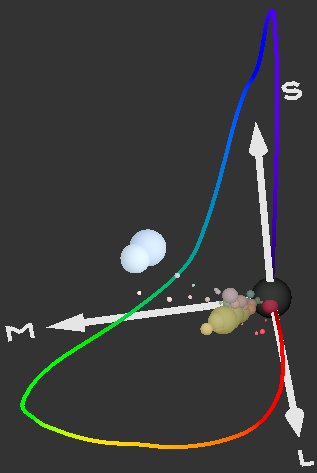
- LMS: based on eye cones response at Long, Medium and Short wavelengths. All the info there: https://en.wikipedia.org/wiki/LMS_color_space
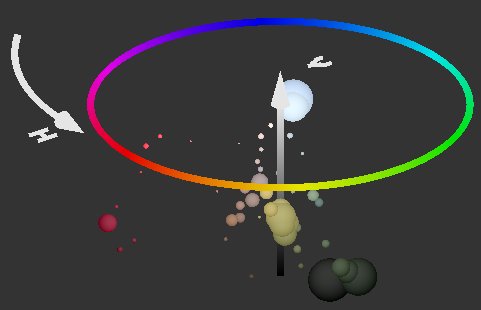
- Color Wheel: the good ol' additive light representation, already used in my previous tool but this time in 3D! (even if it is only on one plane). It is nice to find color correlations like "complementary" or "tetradric", etc. General info there: https://en.wikipedia.org/wiki/Color_wheel
-
Looking at some color spaces, you may think that the representation is wrong, inverted... in fact not, I chose to represent colors distribution in a uniform way, the color wheel as a base: red-to-green-to-blue anticlockwise. This is why in Lab color space the "left" yellow-blue axis is +b and not -b!
-
When choosing a color space, don't forget you have a "default" viewing configuration, just use the "Reset" button
-
The slider under the color spaces selector is used to control the color spheres size - you can use CTRL + mouse wheel for that, too, in the 3D view
-
The last button is to save a snapshot of the curent 3D view. It also appears in full screen mode
-
I added this function because you may need to have a look at the target colors of a .cube LUT file to visually analyze it
-
Groups of colors, symbolized by bigger spheres, can give you indications about the effect of the LUT: grayish of faded colors may give a "faded" look to your images, a lot of greens may show that the effect will add a green global hue, a lot of whites will most surely lighten the image, or "bleach" it...
-
Don't hesitate to change the color space for better analysis. HSV is great for that
-
For most LUTs, even by looking at it in a 3D color space, you won't be able to understand what effects they will have. Just try them in another program on real images!
My photographer website: www.absurdephoton.fr