

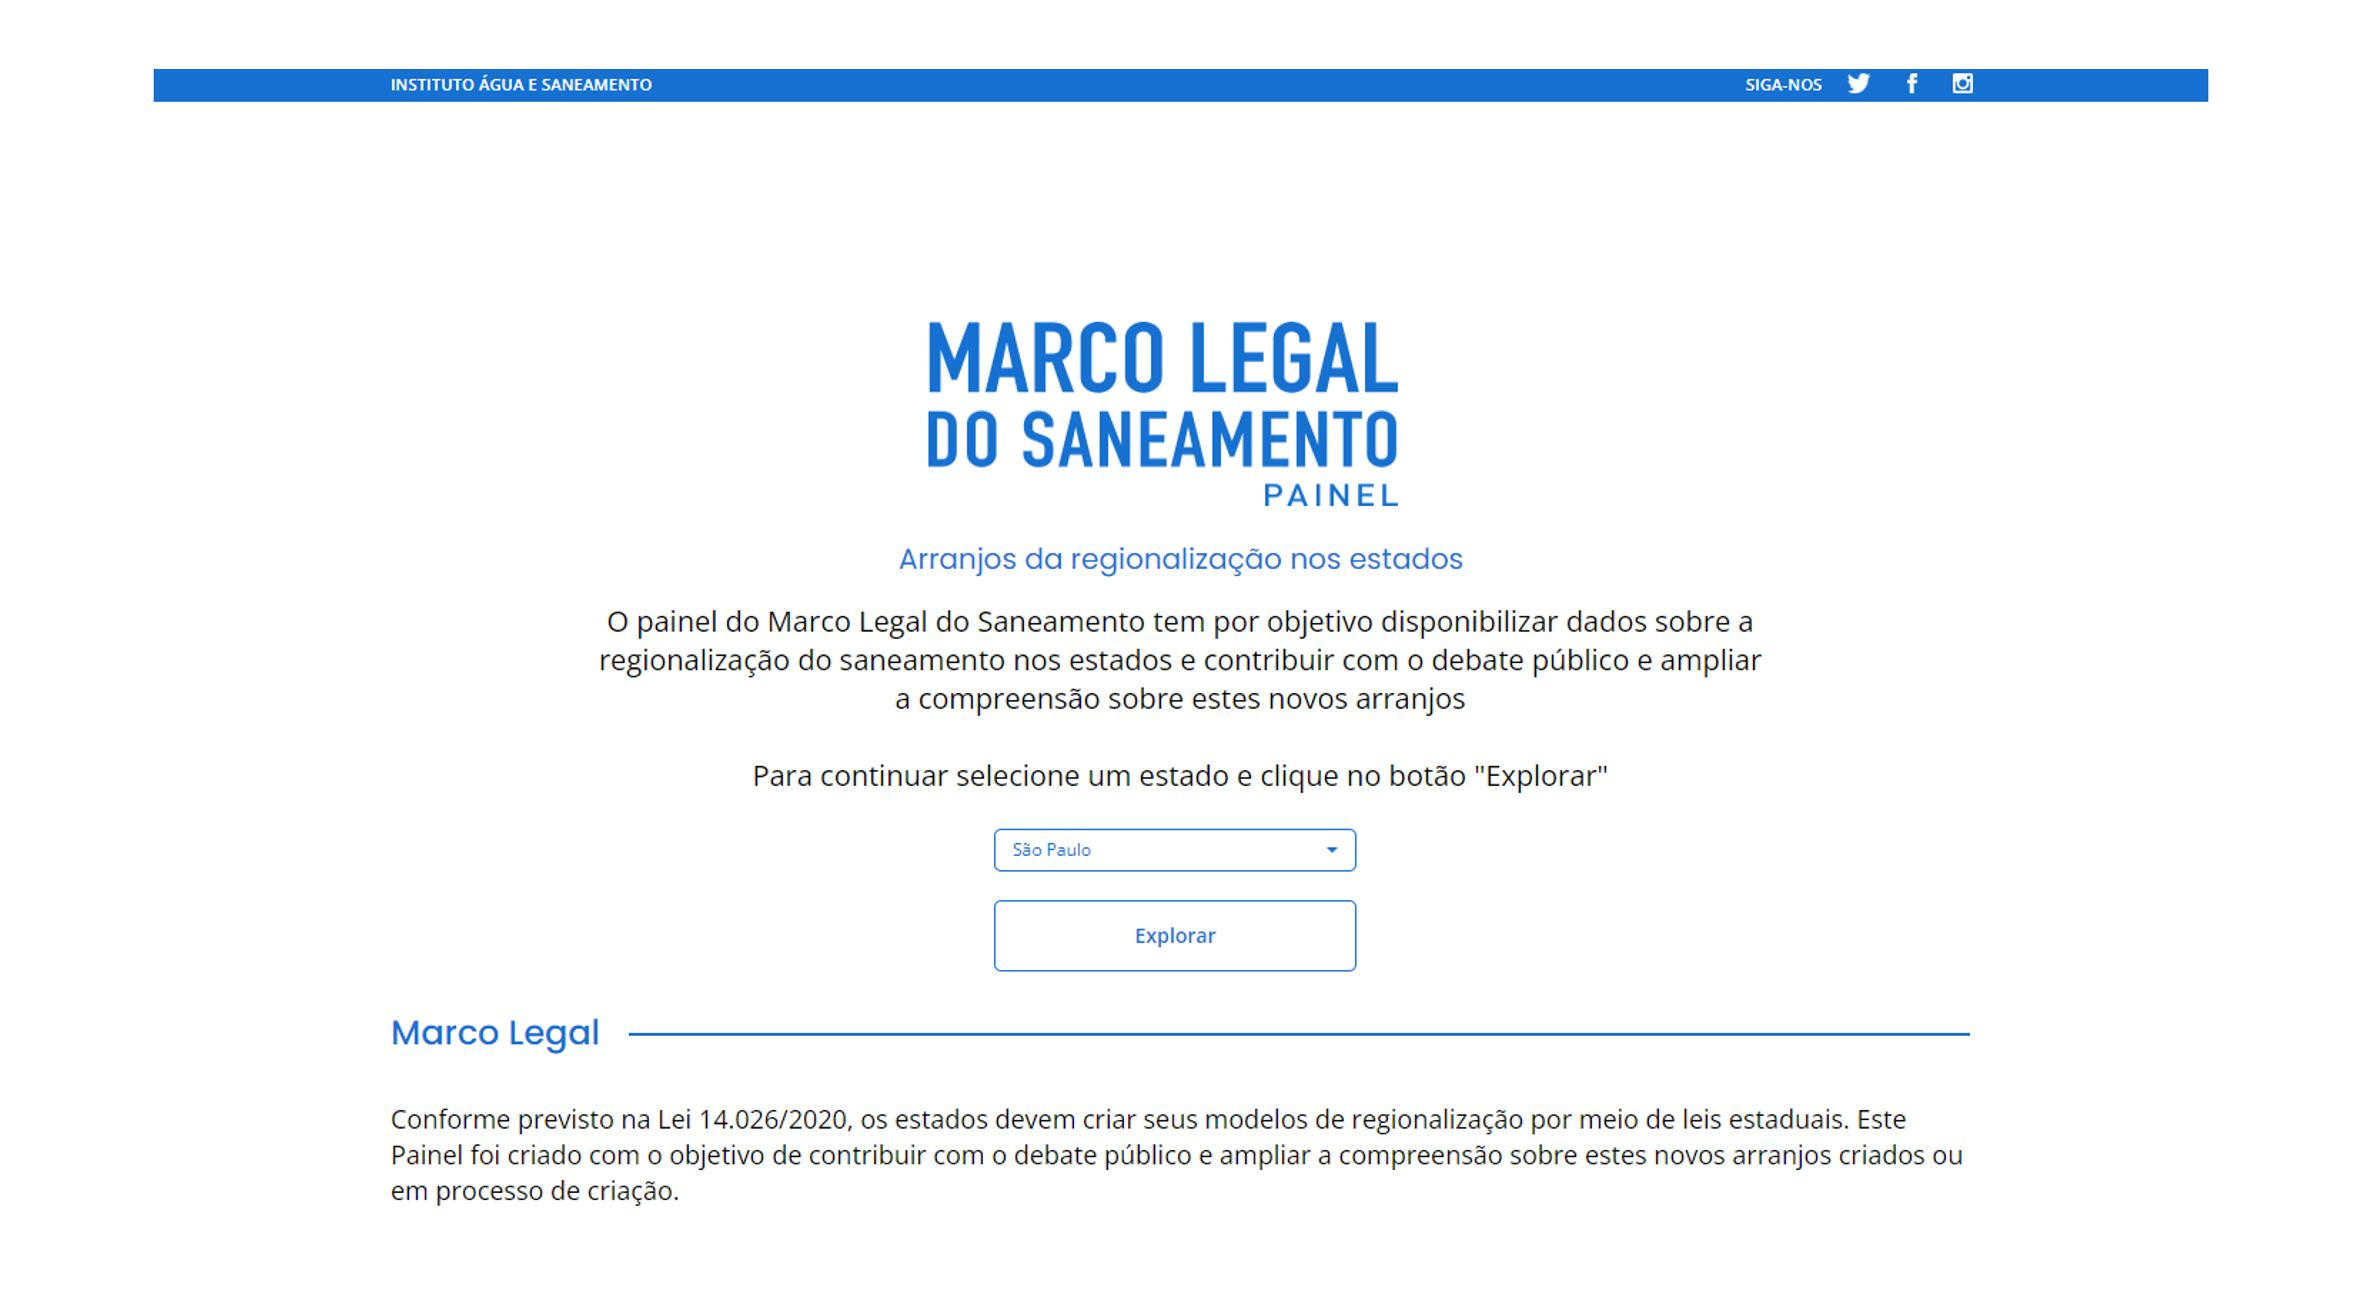
Dashboard made in {flexdashboard} that includes solutions like:
- Input persistence through tabs;
- Input data from URL;
- Heavily customized front-end;
- Use of JS and observeEvent() to synchronize Leaflet maps;
- Interactive plots made with
{echarts4r}and{plotly}, and tweaked with JS; - Tooltips made with
{tippy}; - Sankey plot made with
{networkD3};
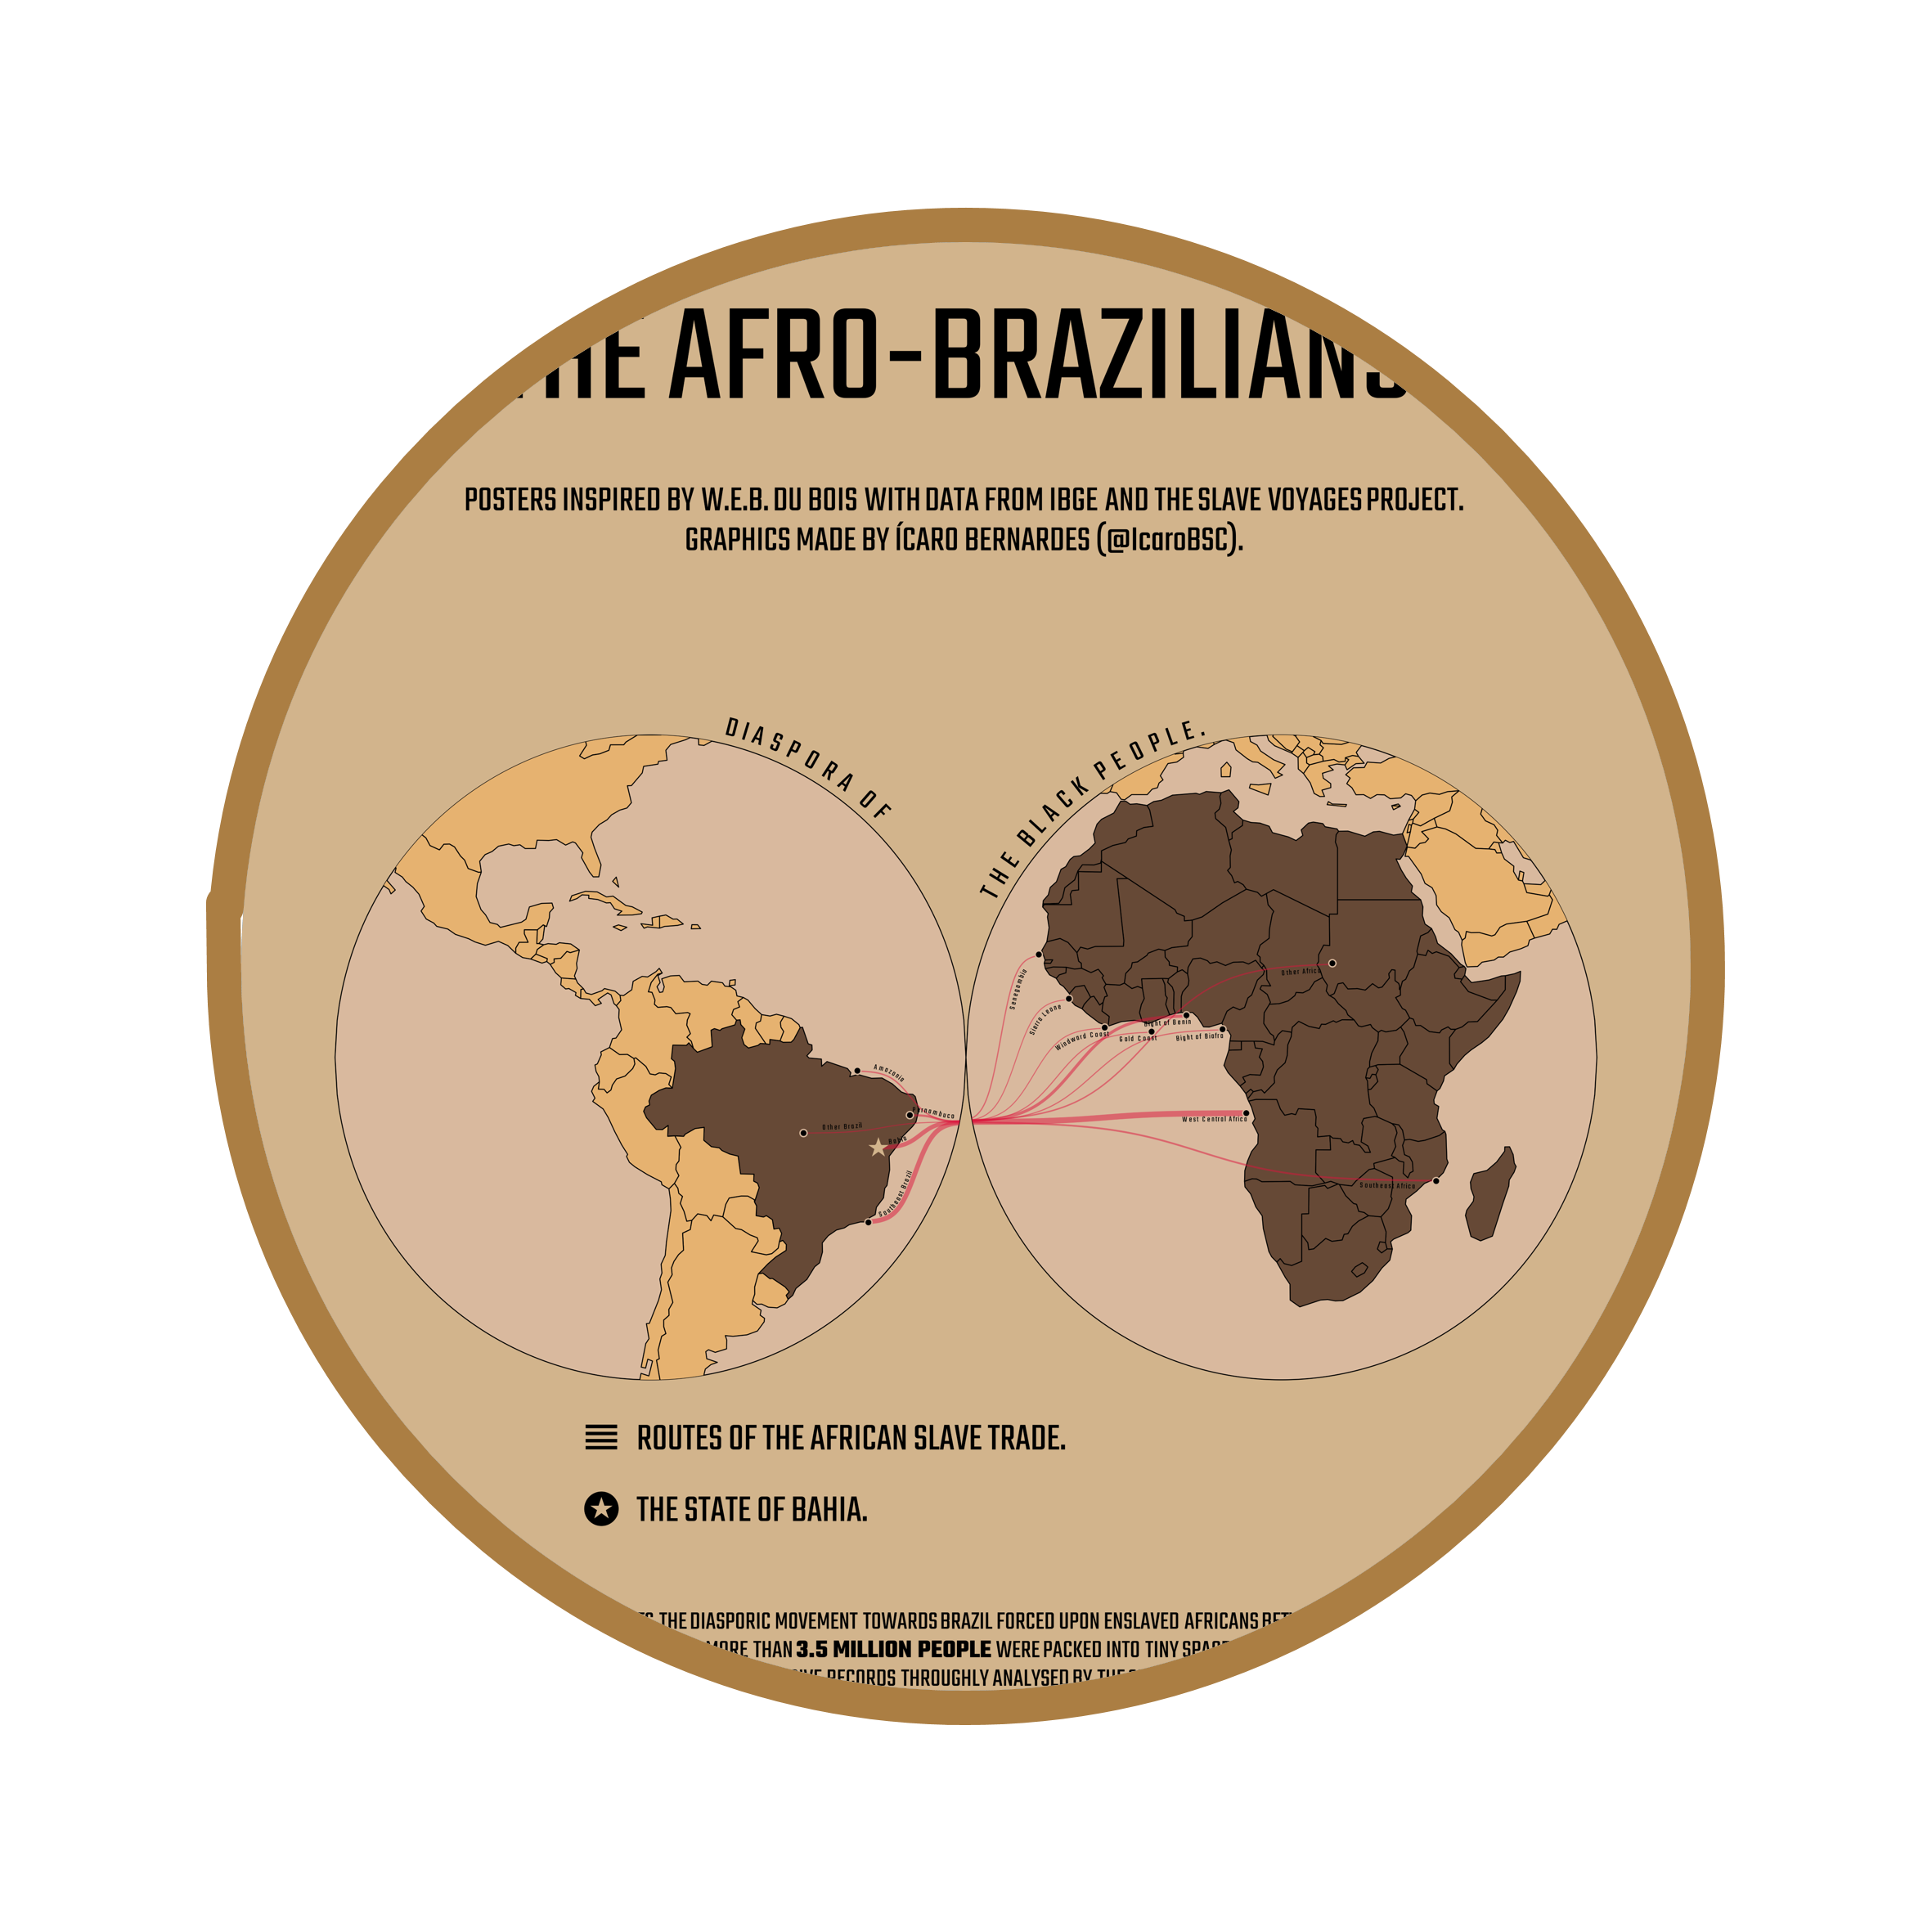
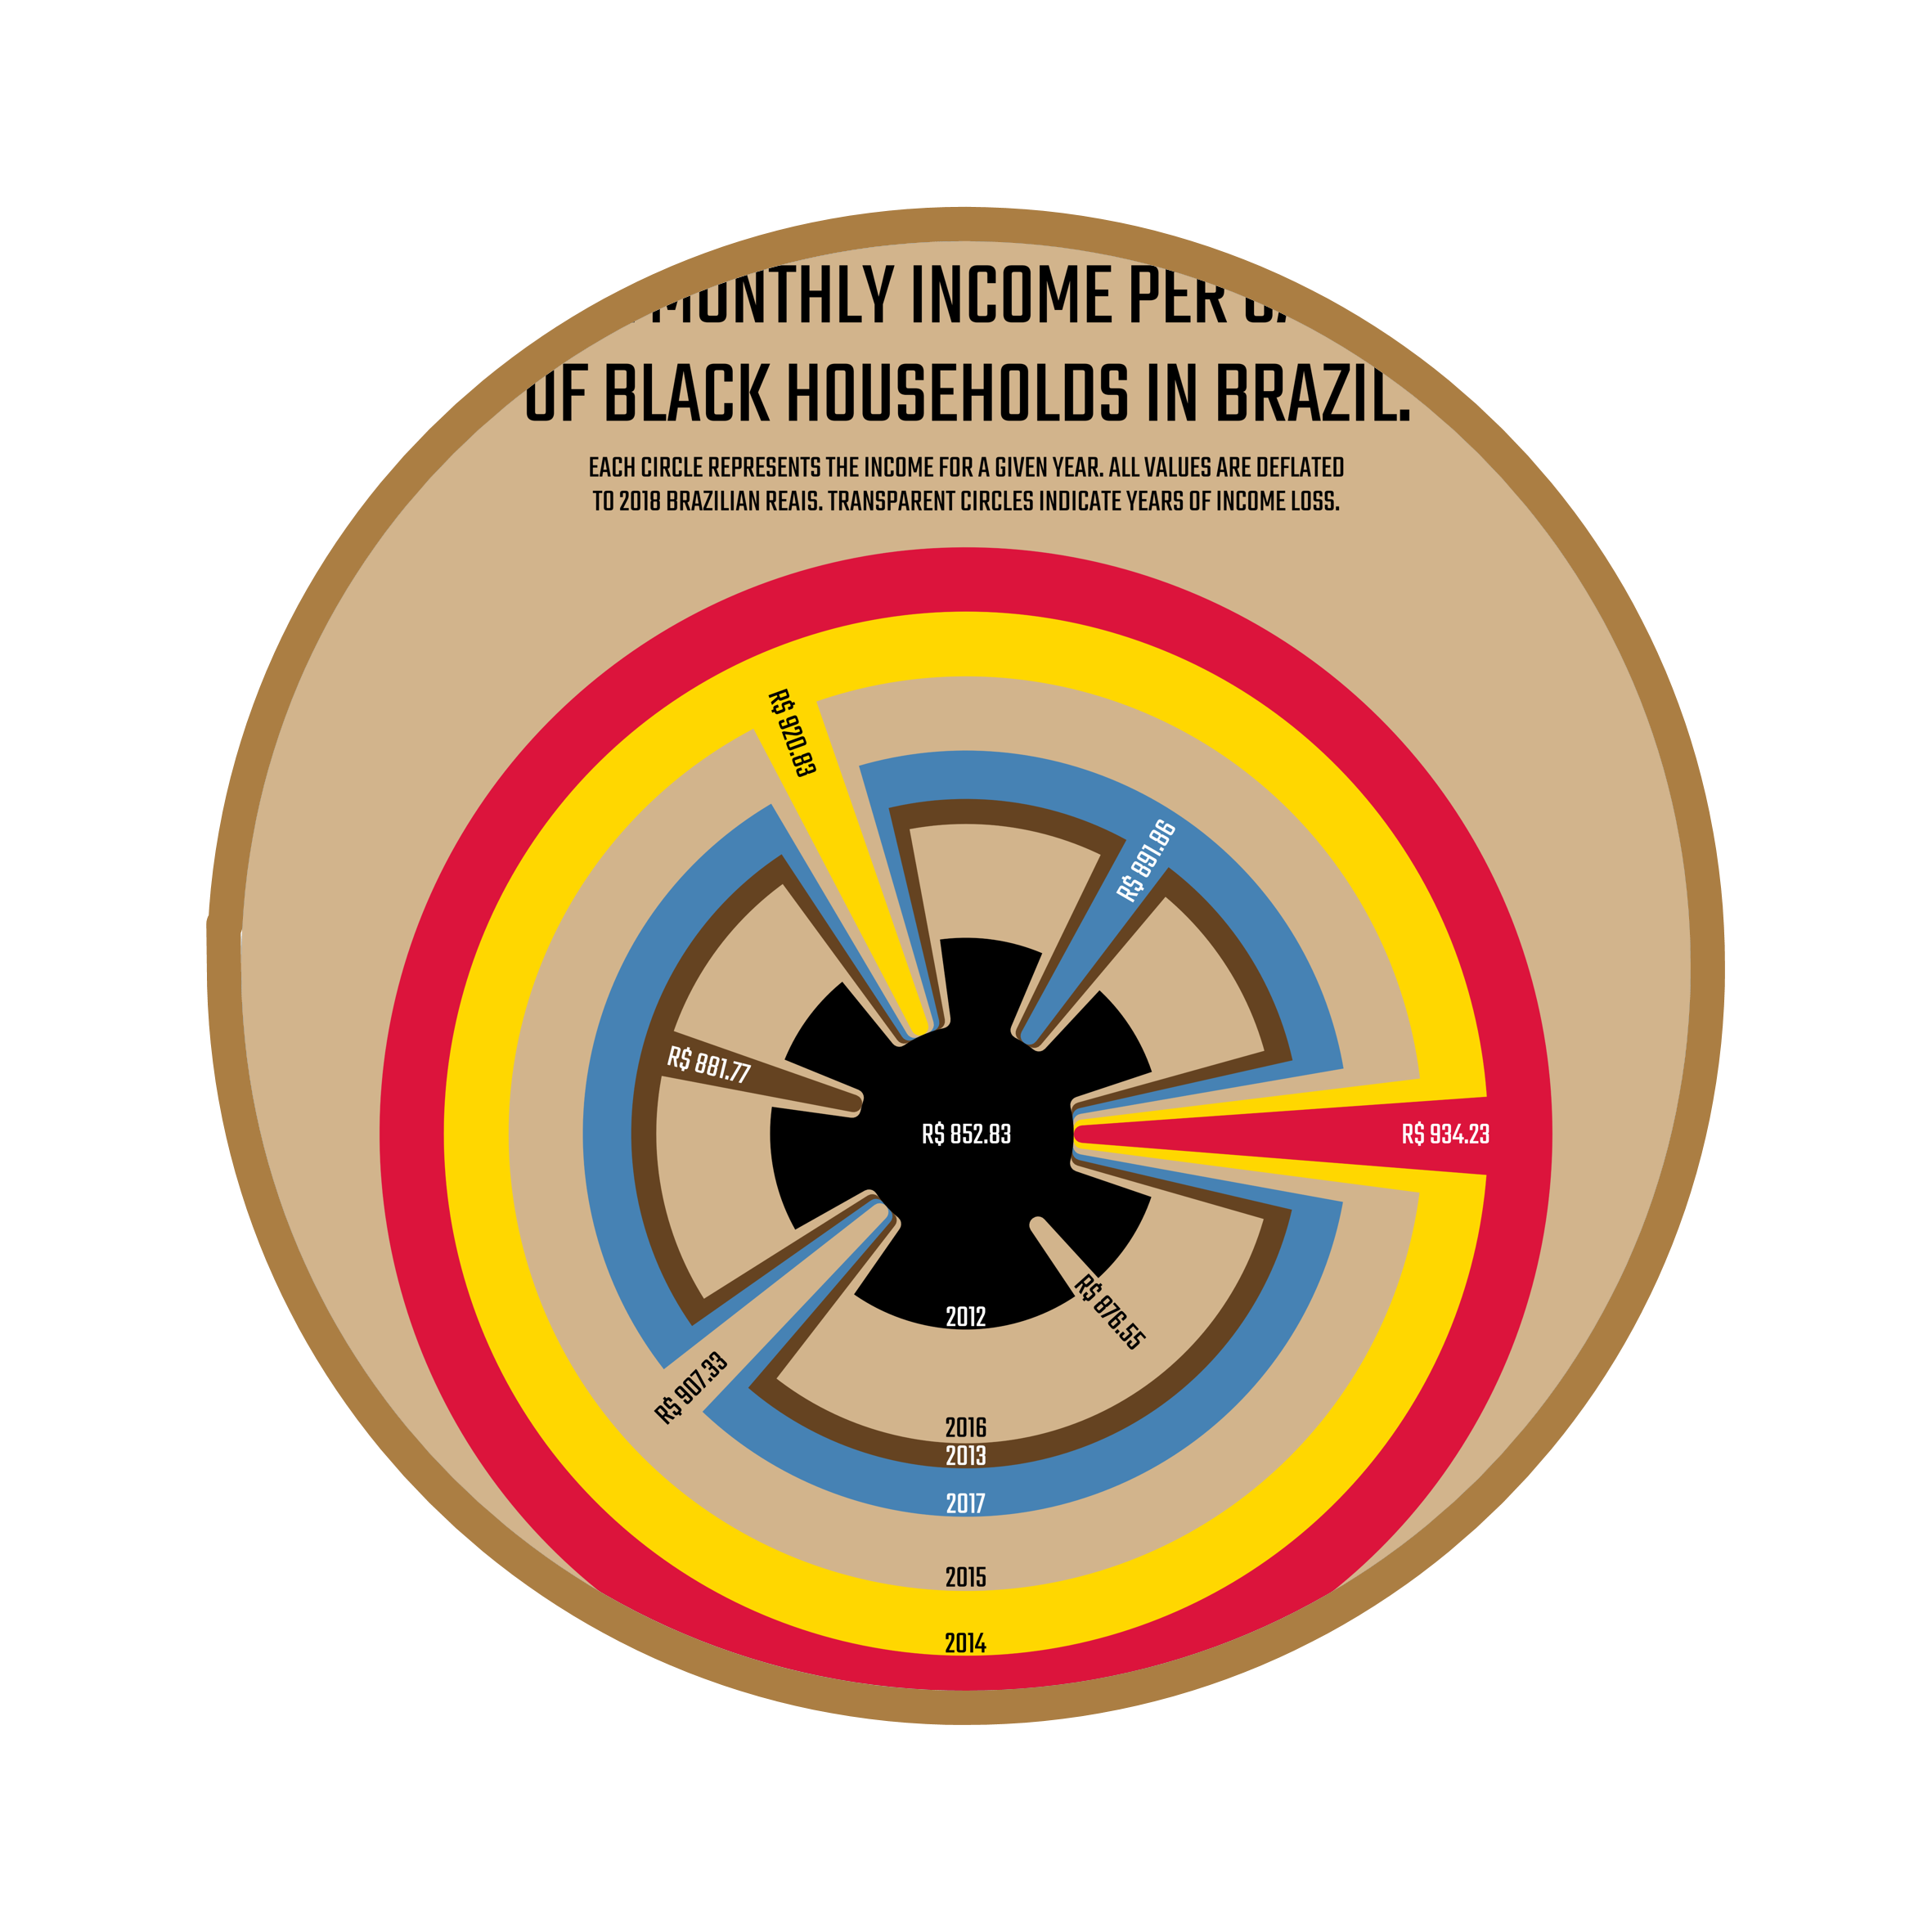
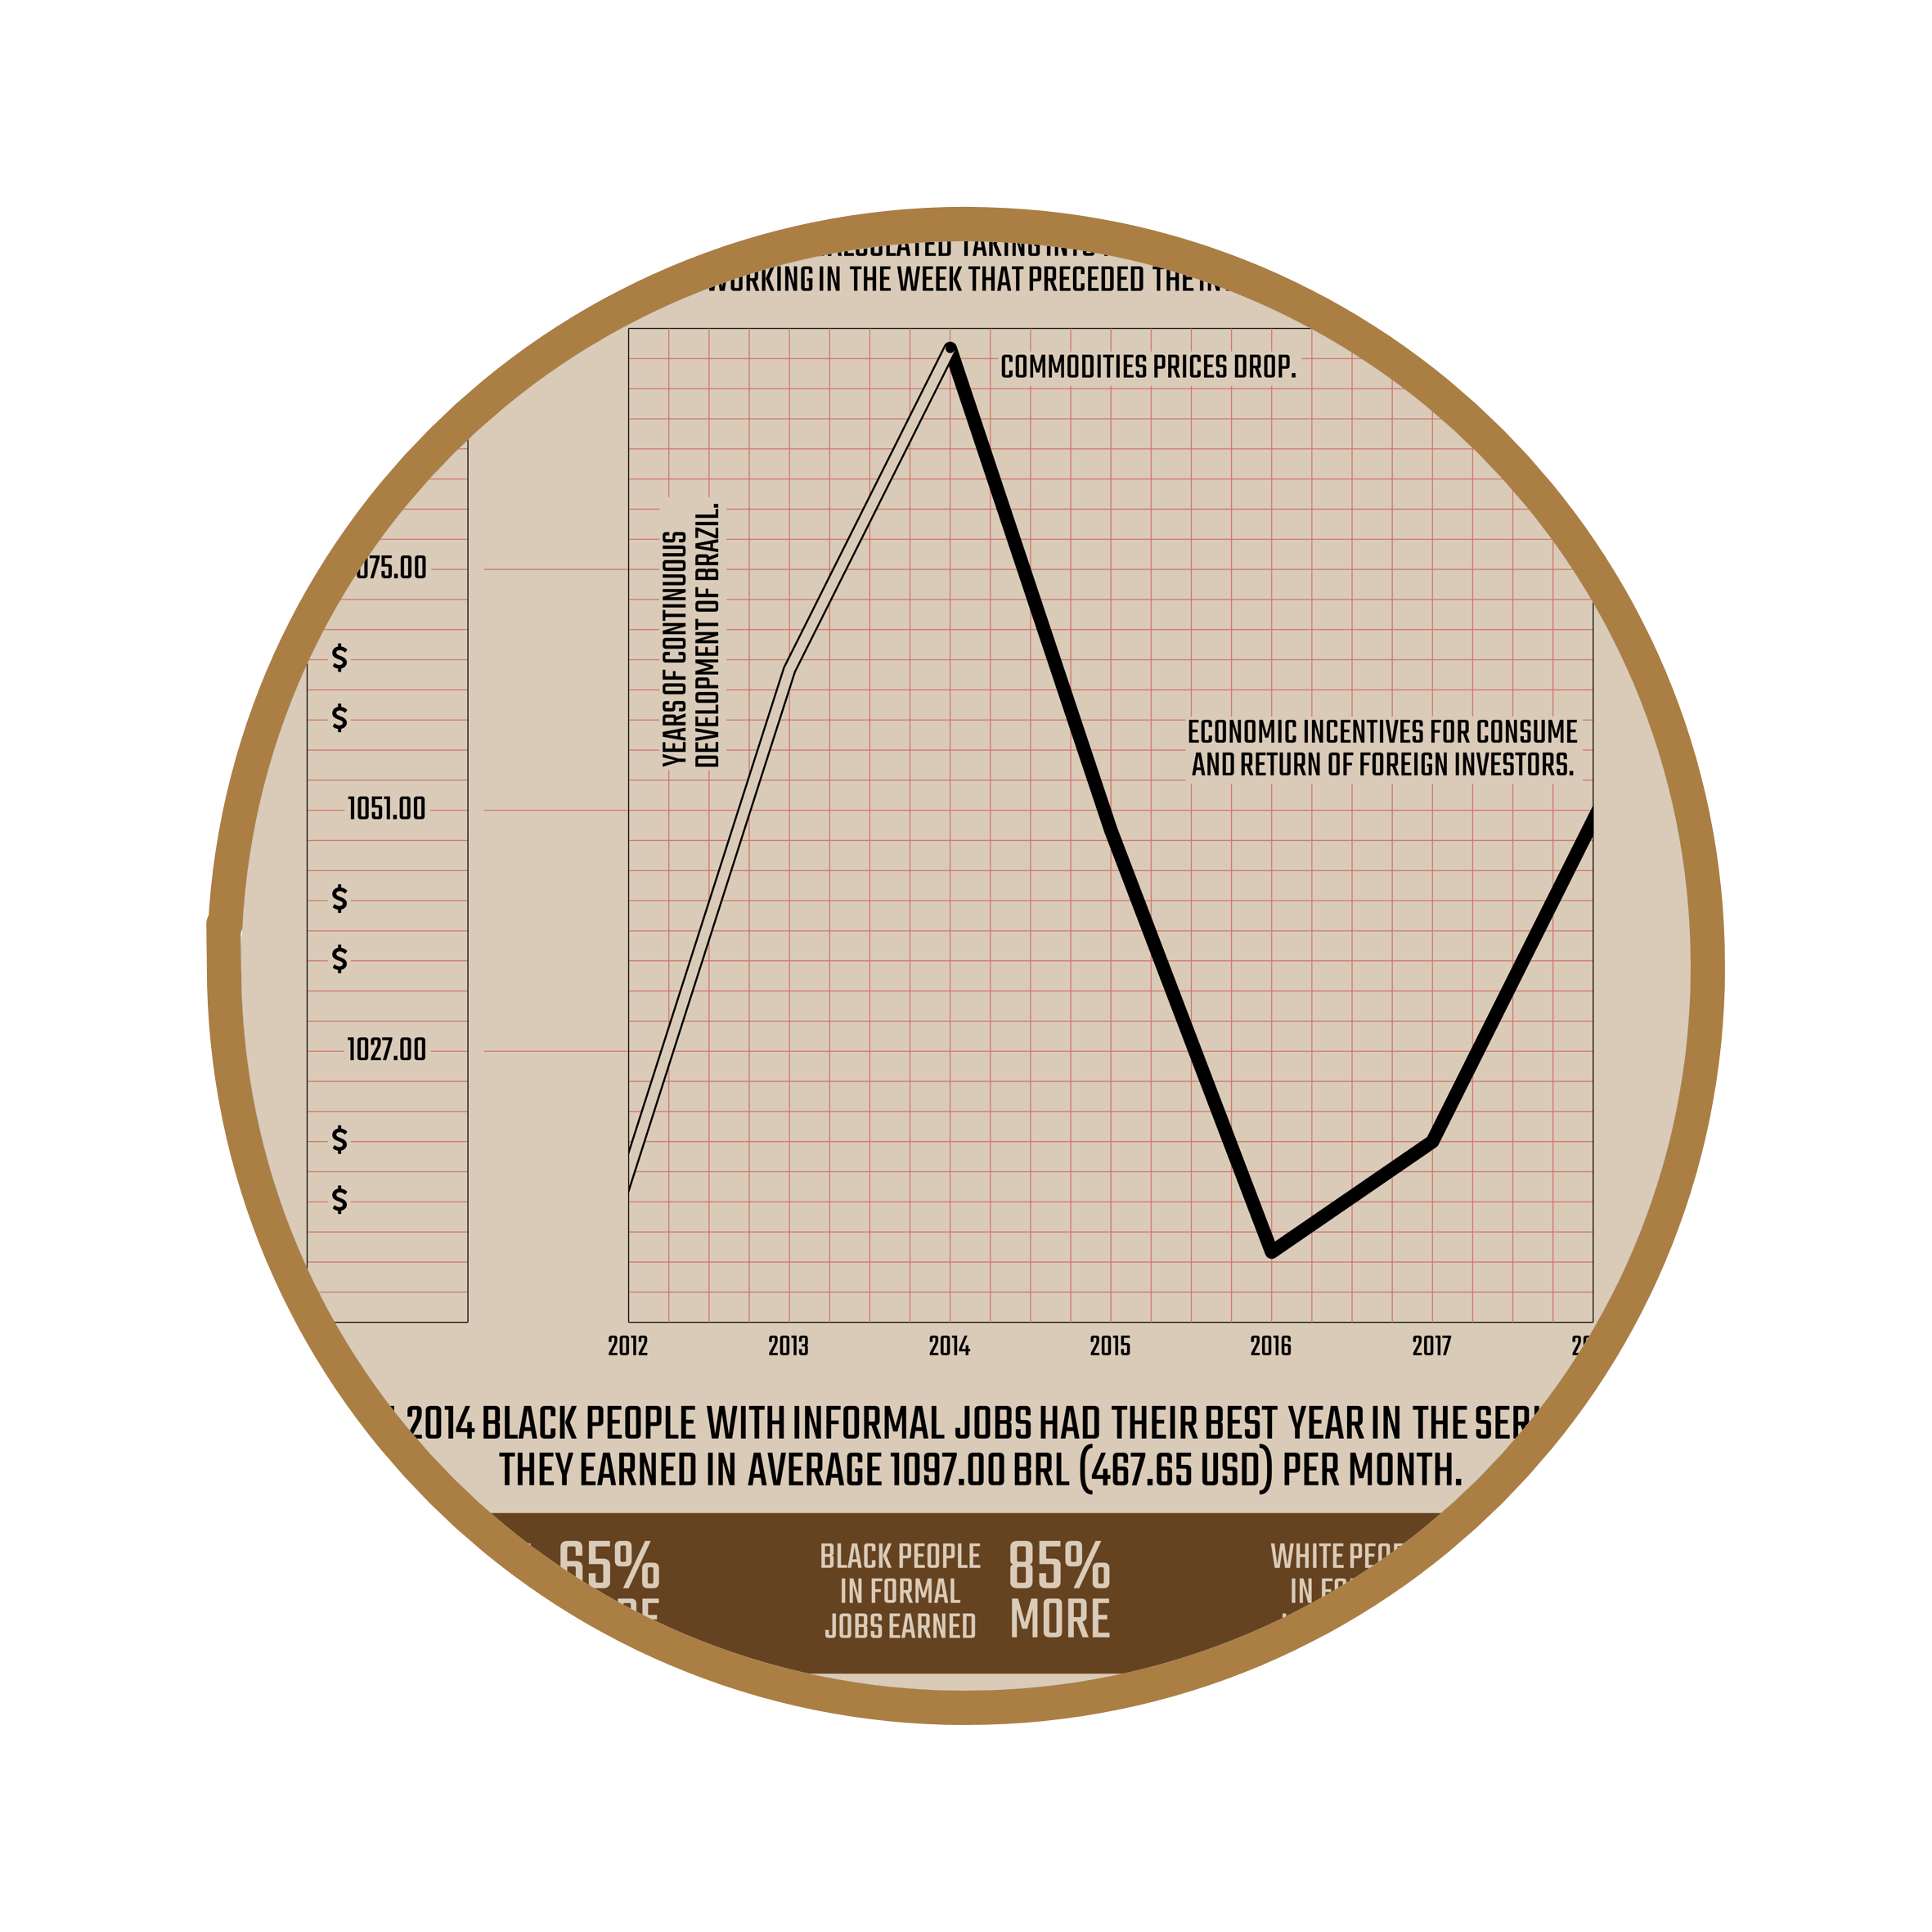
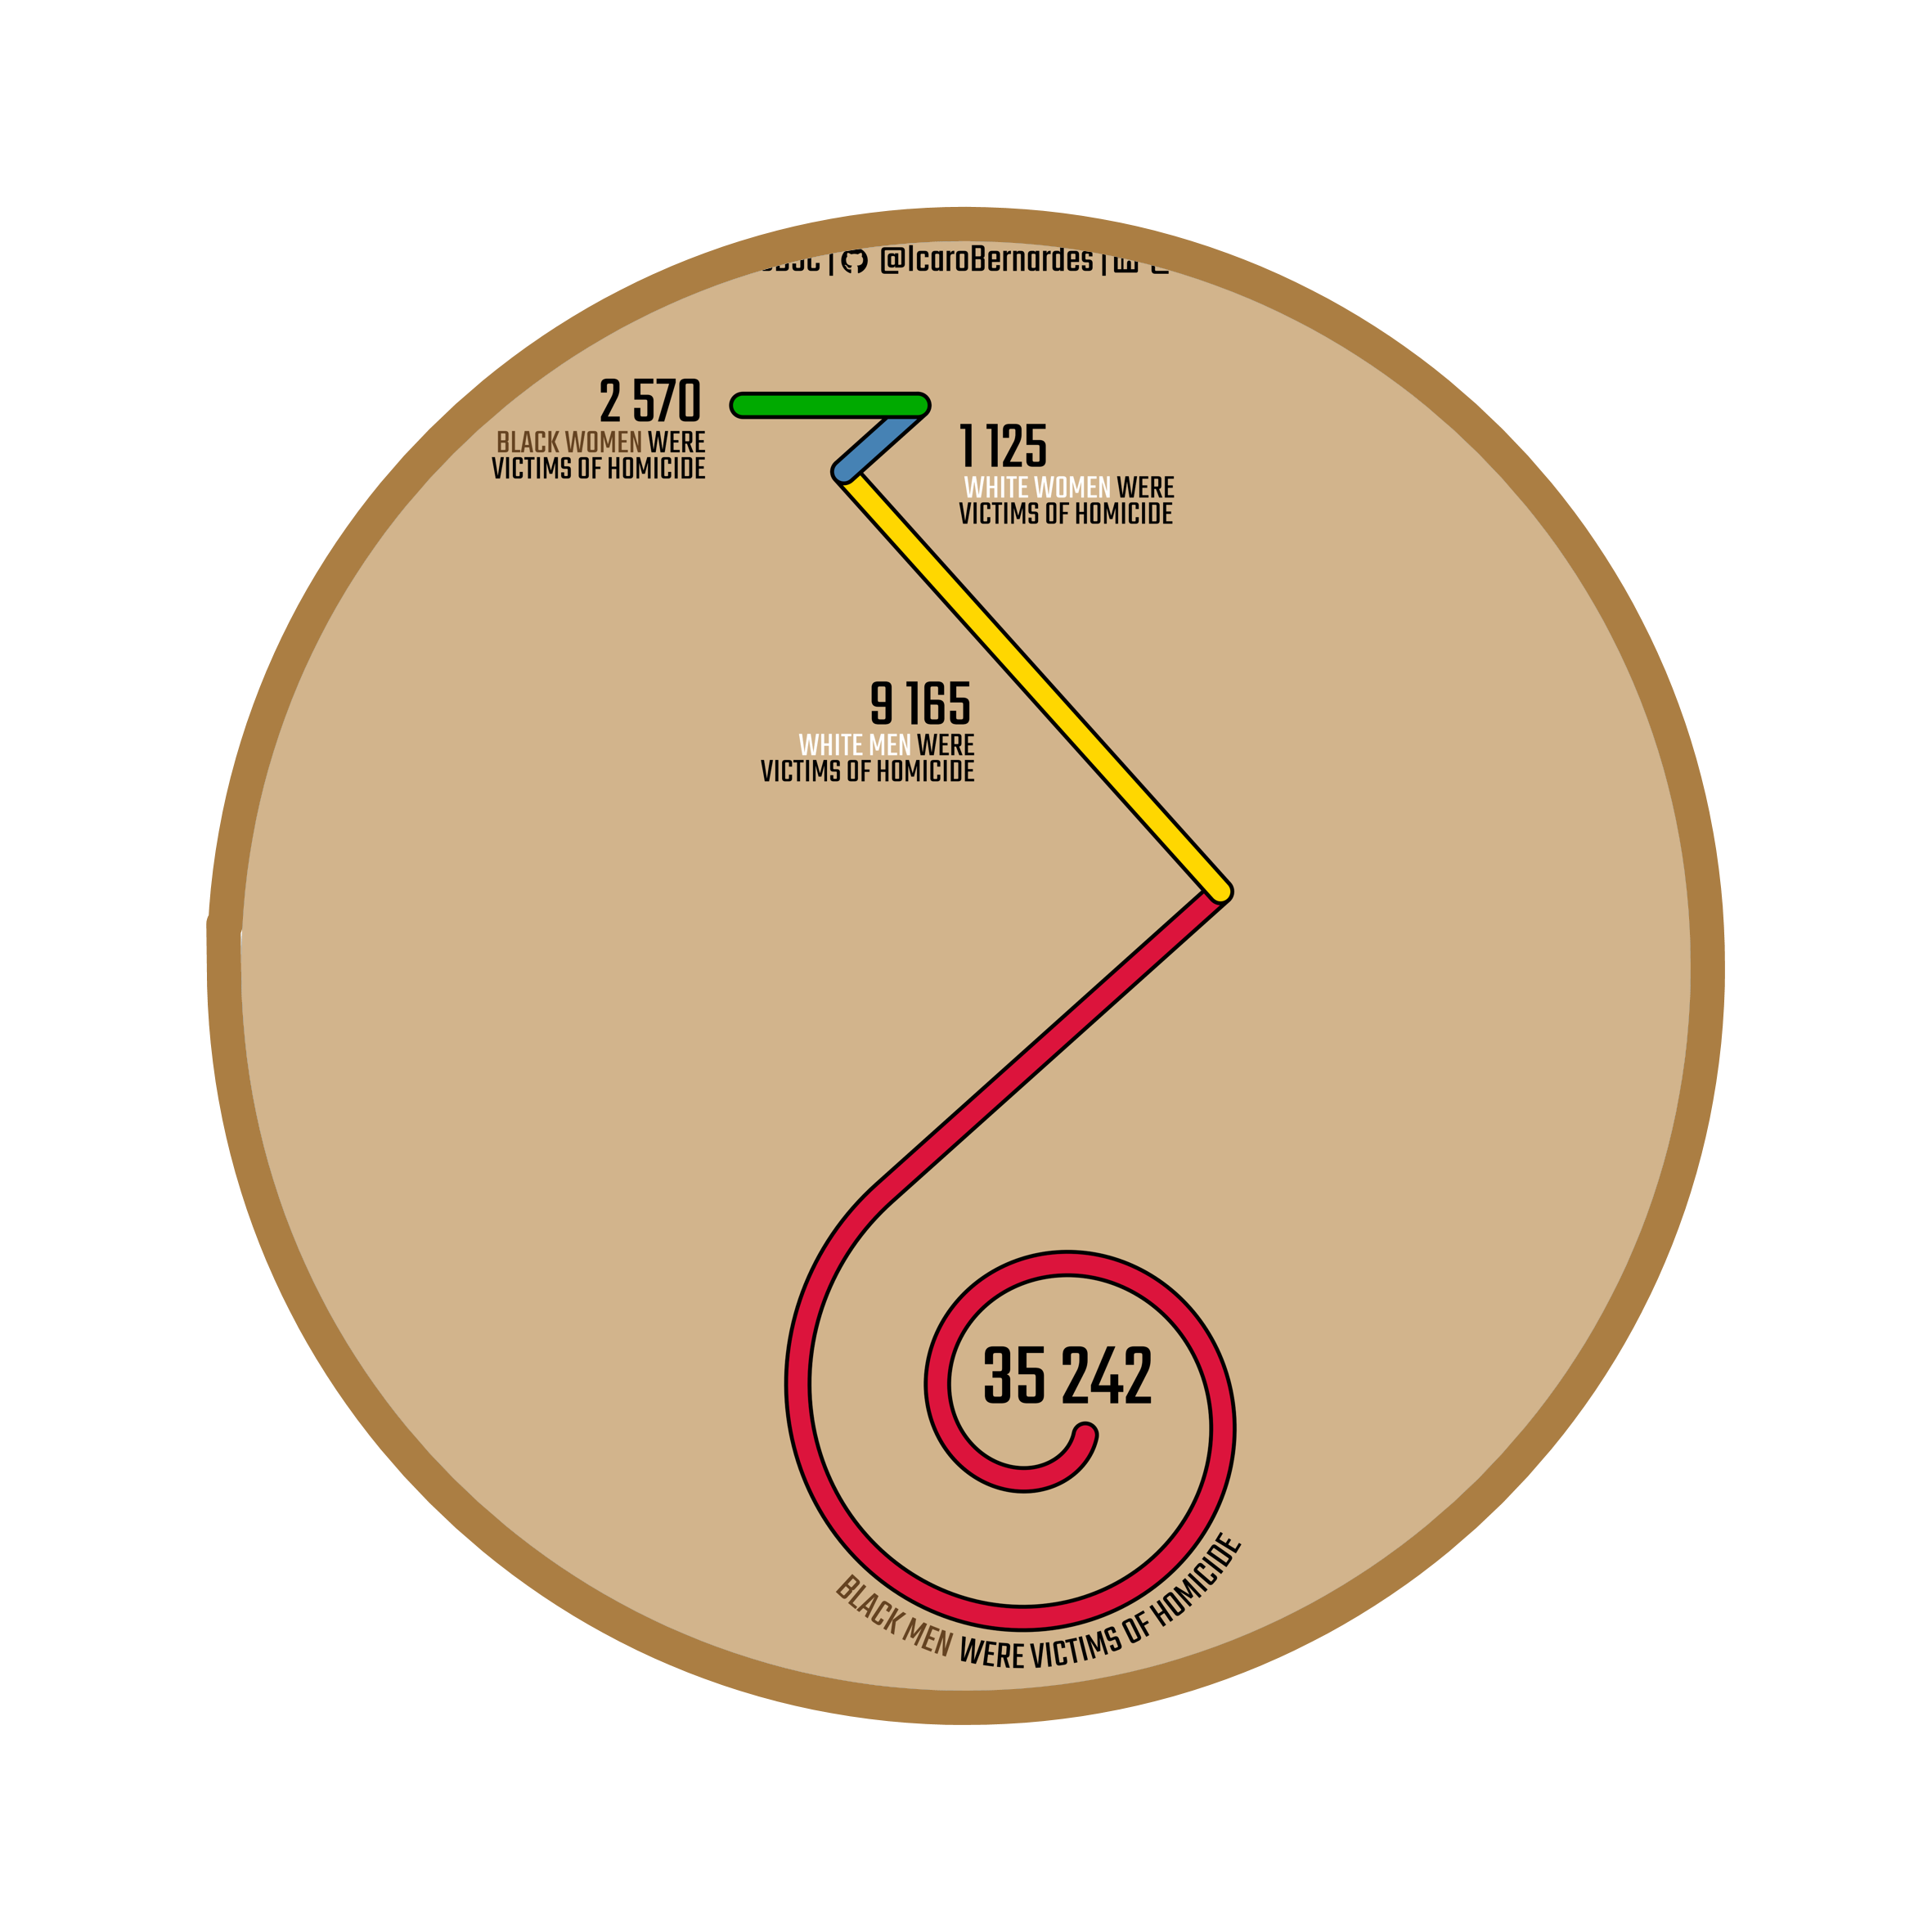
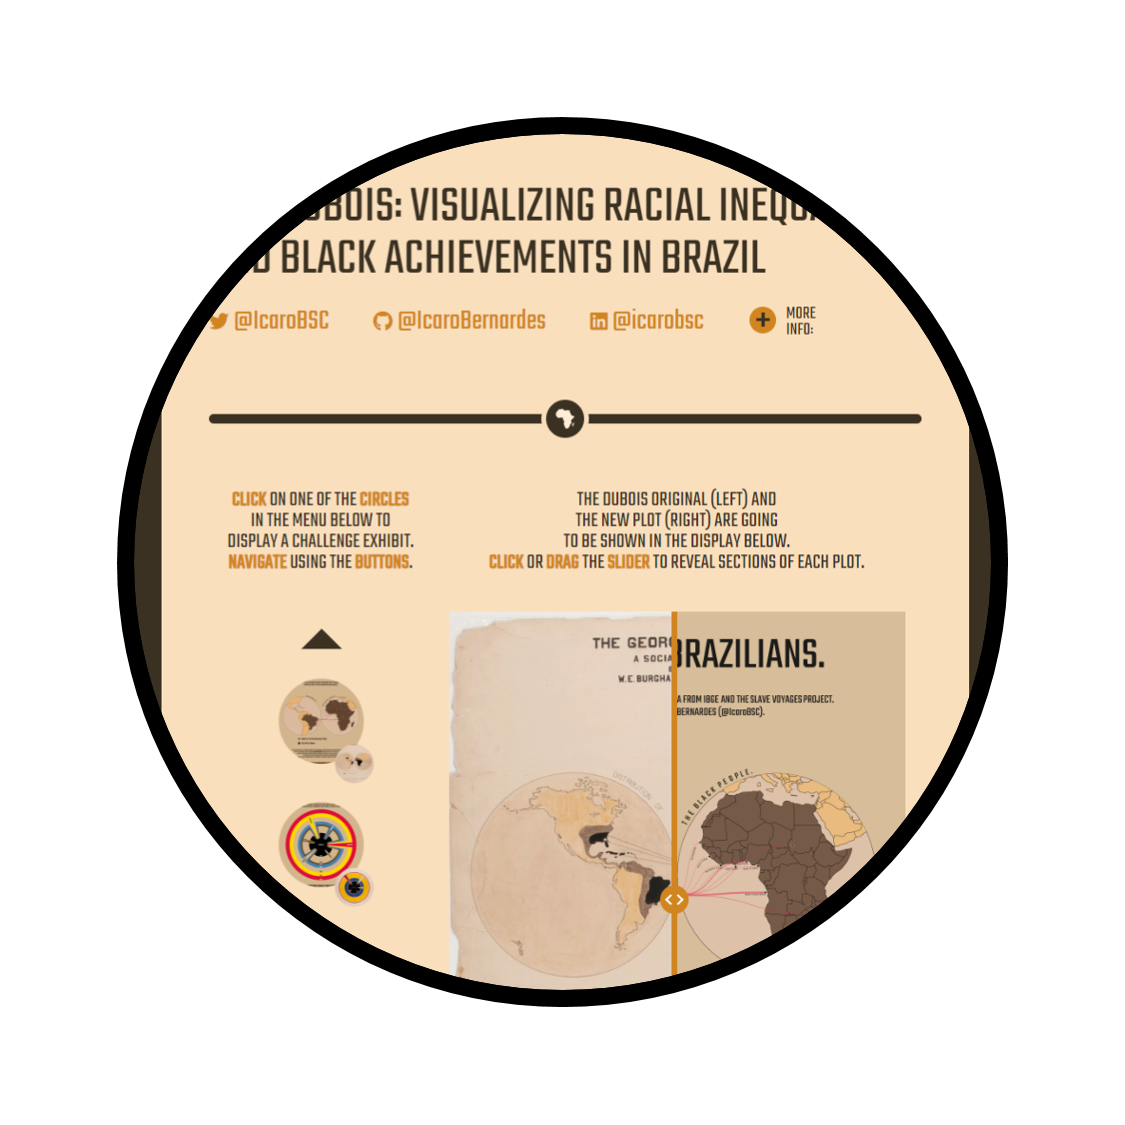
This dataviz project takes inspiration from the works of the Du Bois' team in the 1900's Paris Exposition. I reproduced them in R with slight changes and using data that shows racial inequality and Black achievements in Brazil.
This was my first dataviz challenge ever. It allowed to learn a lot about data handling, especially the uses of {dplyr}, {tidyr} and {purrr}.
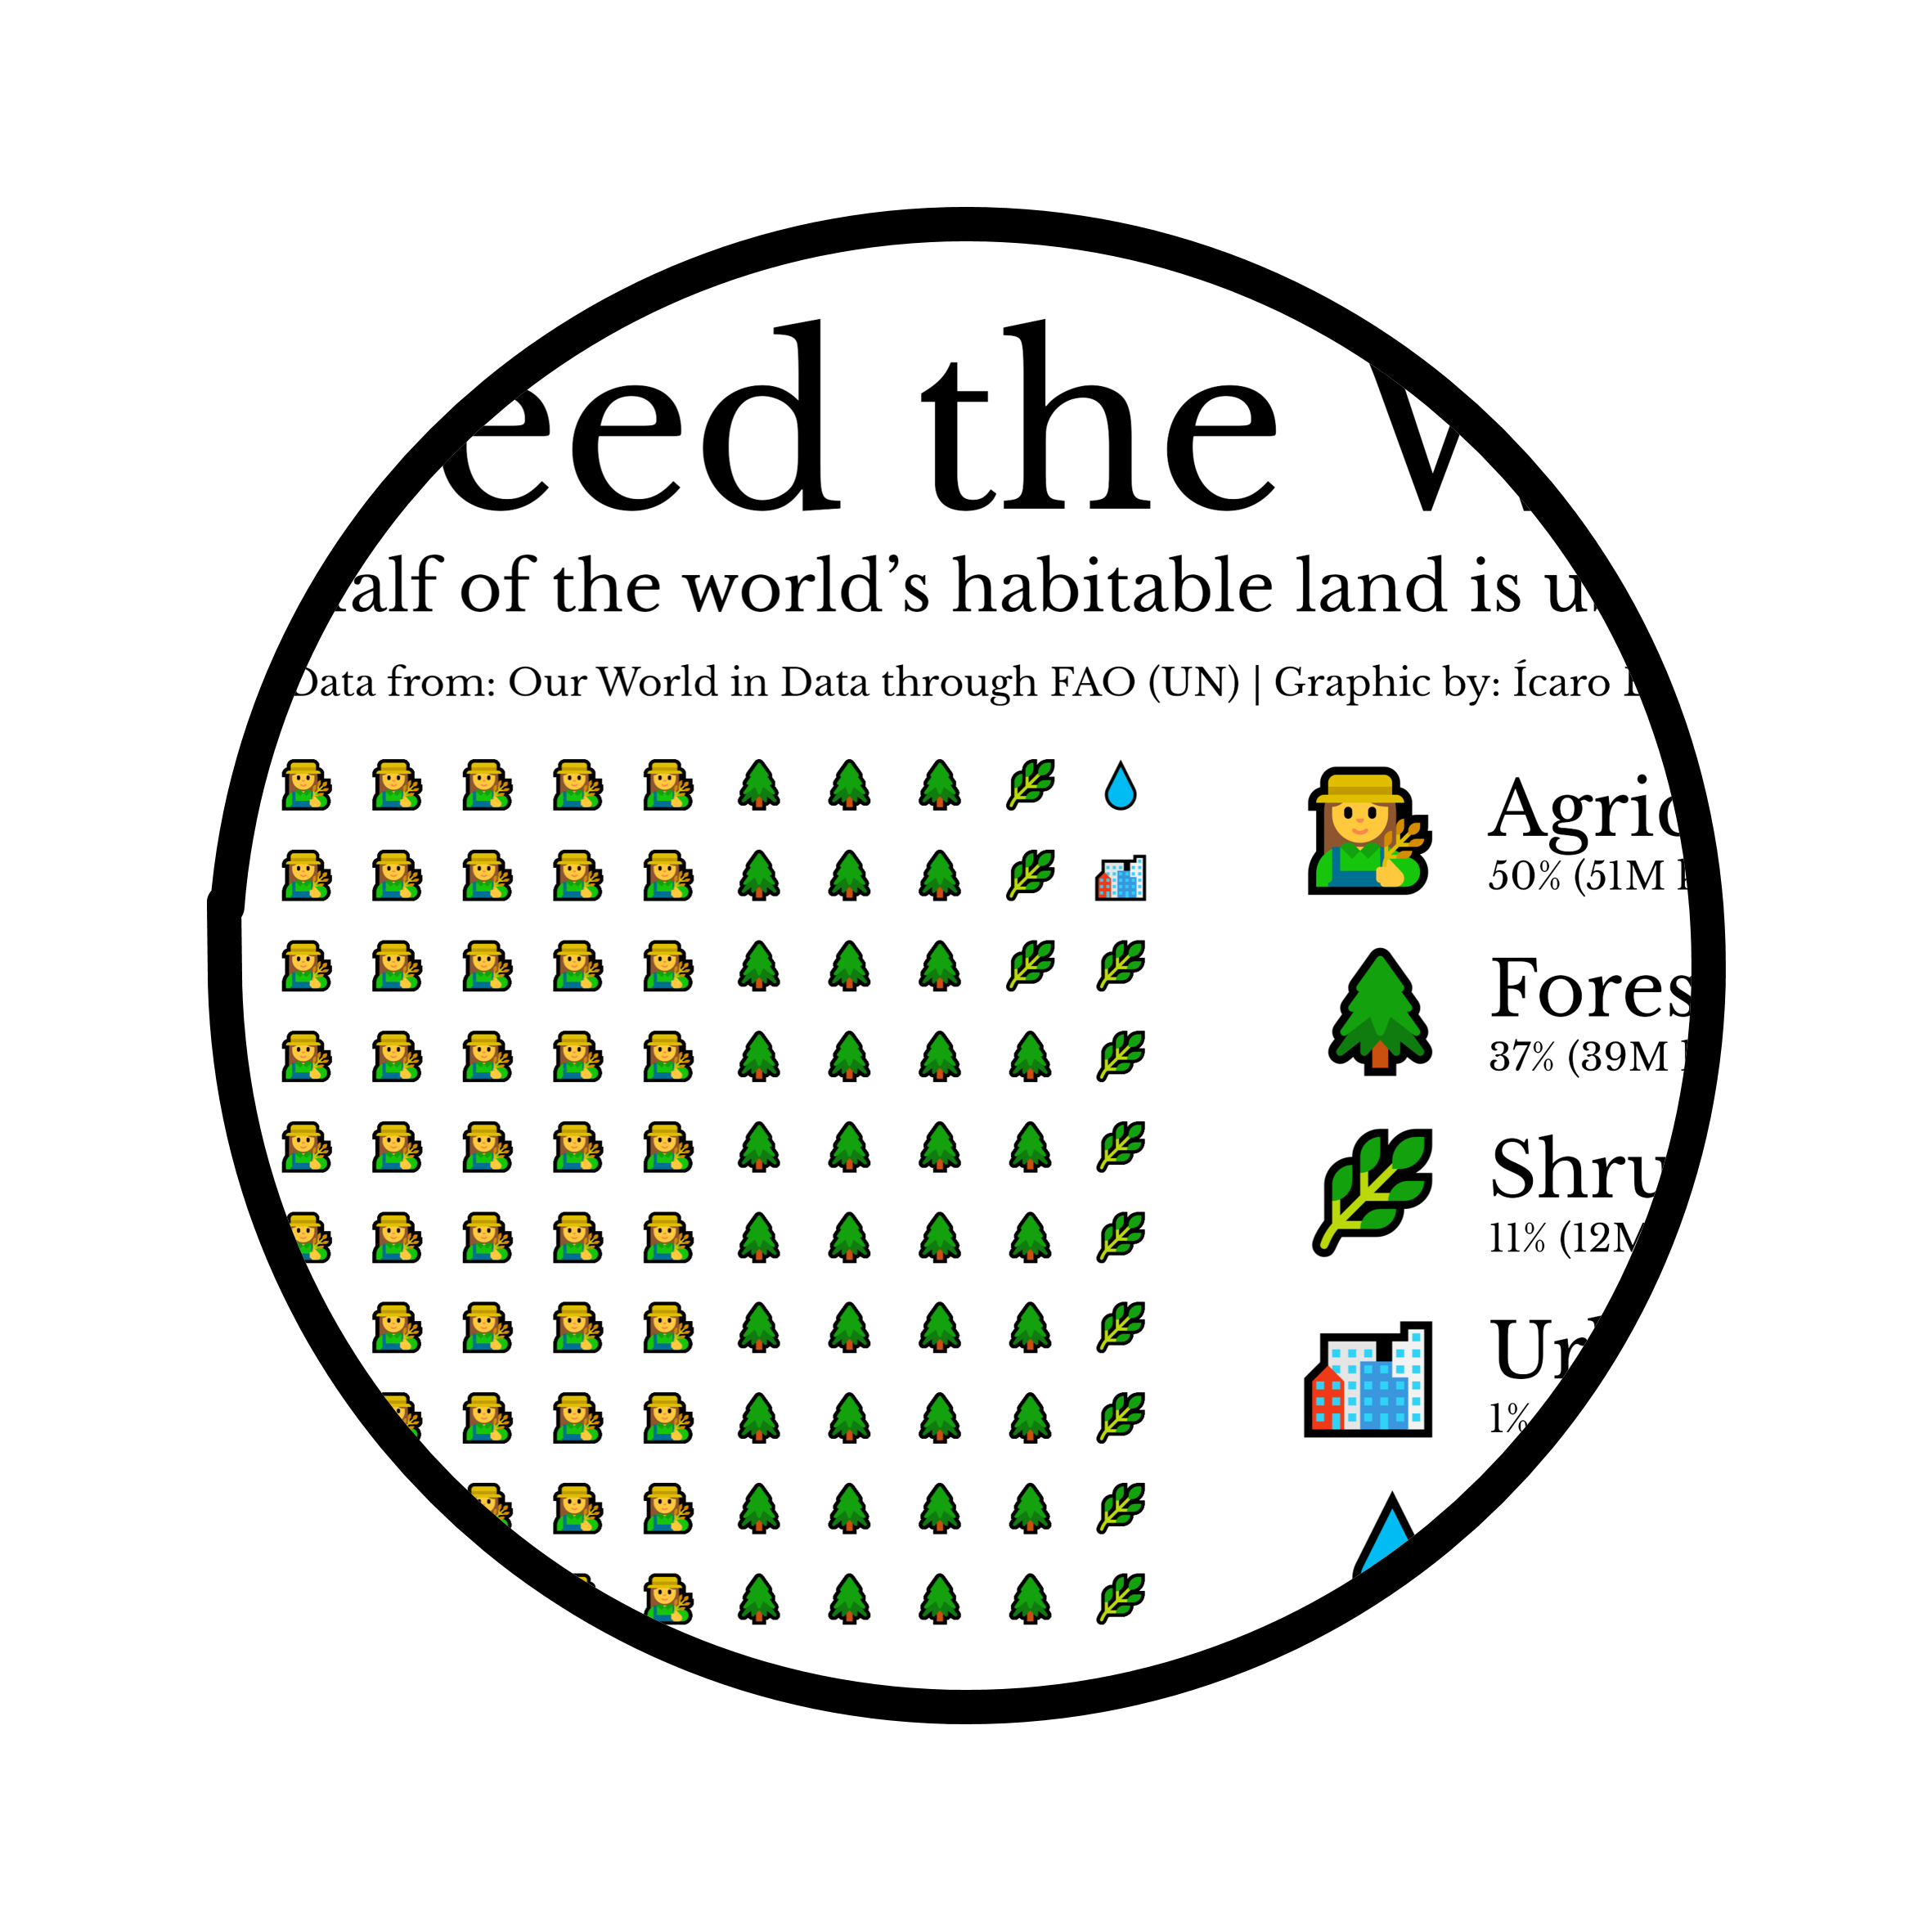
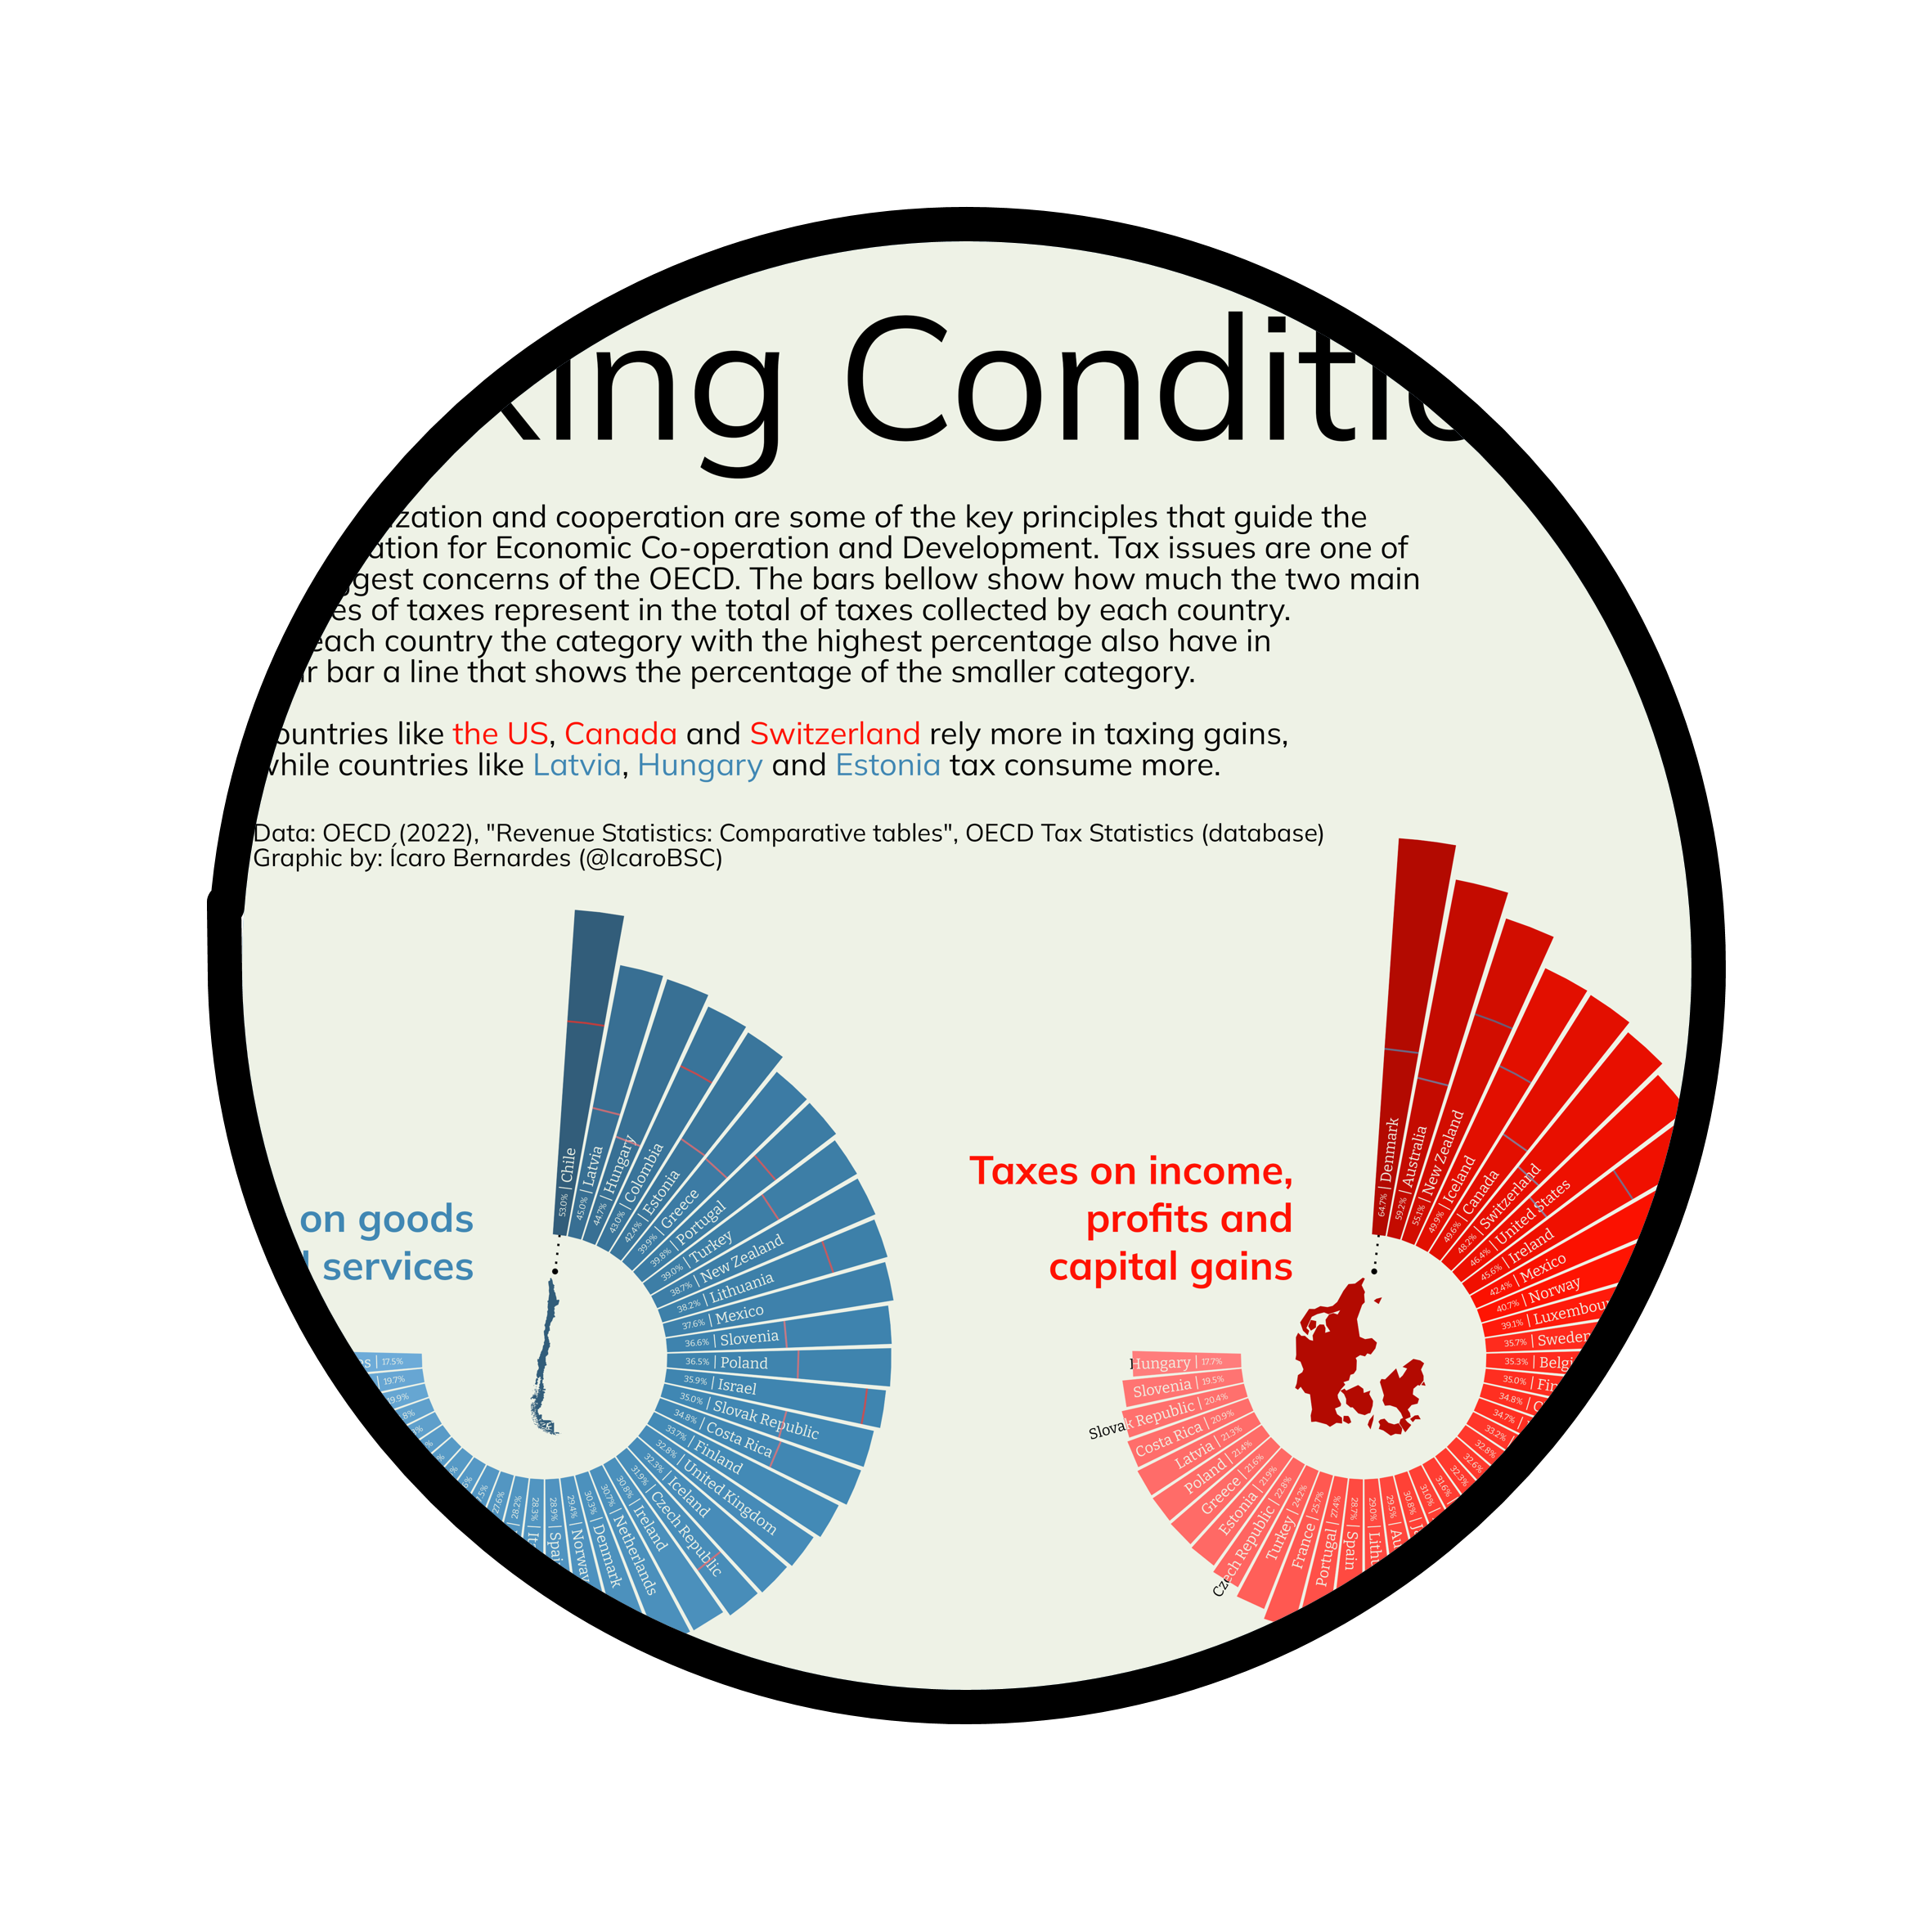
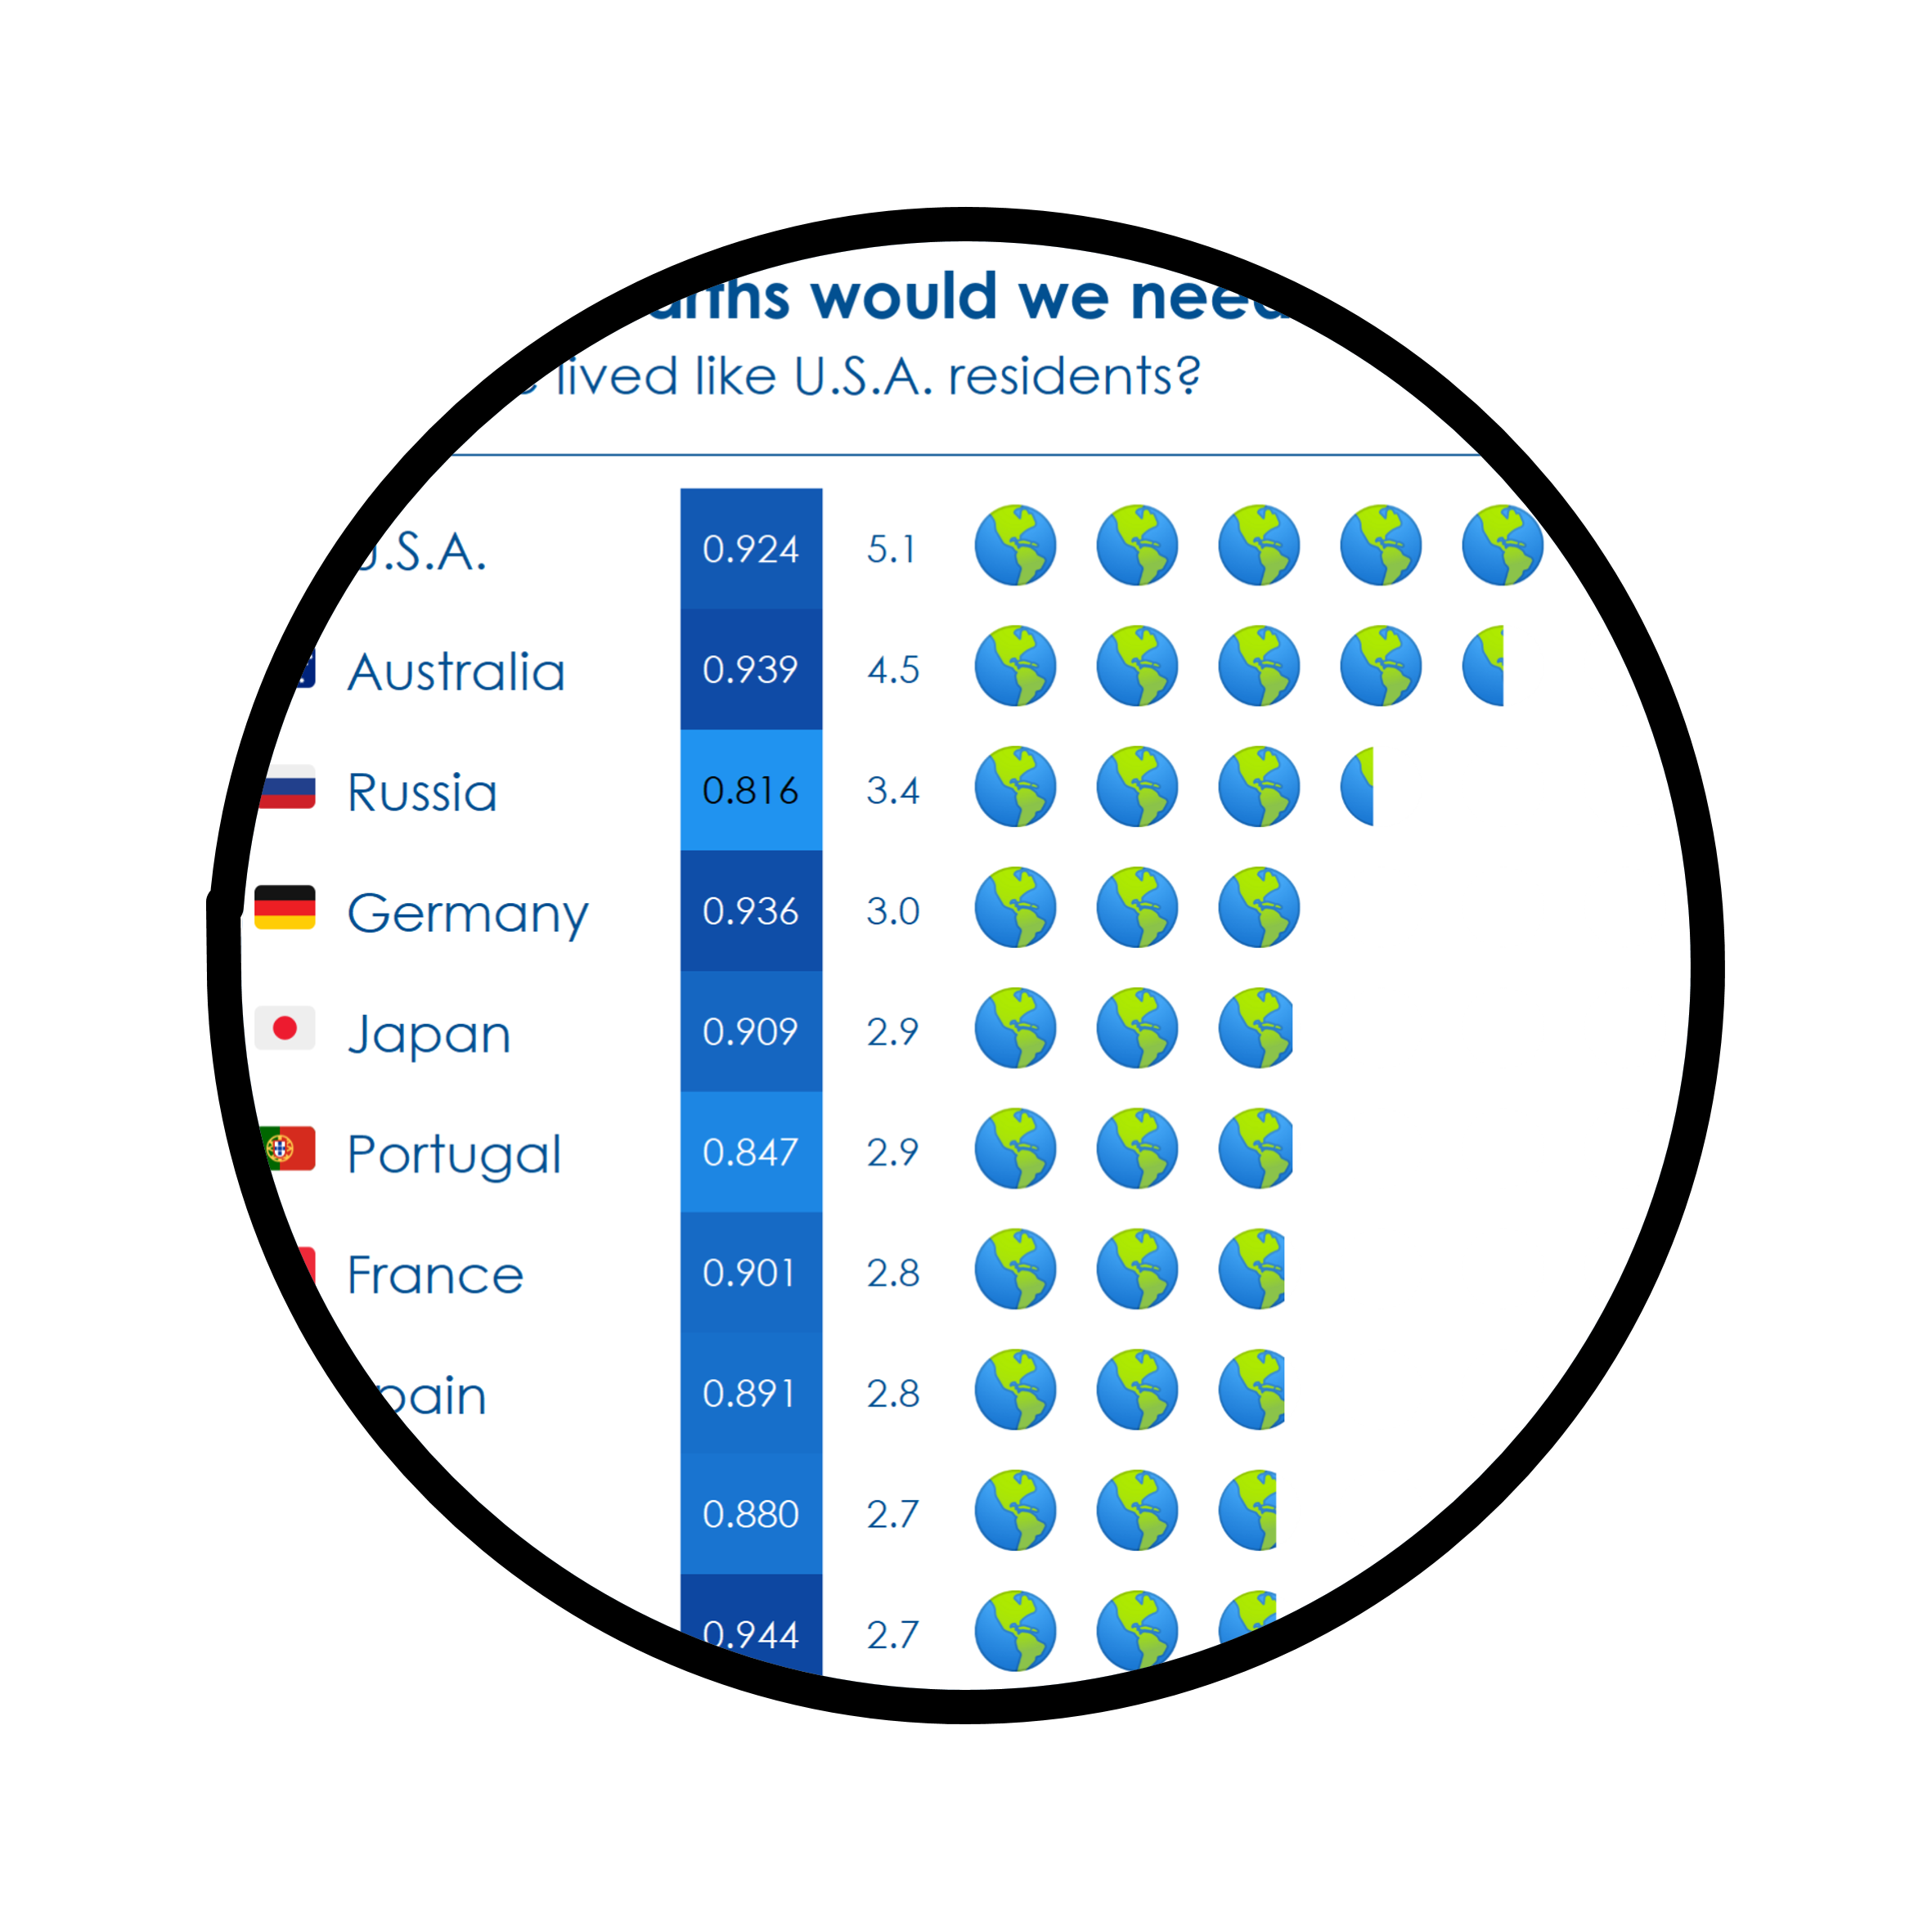
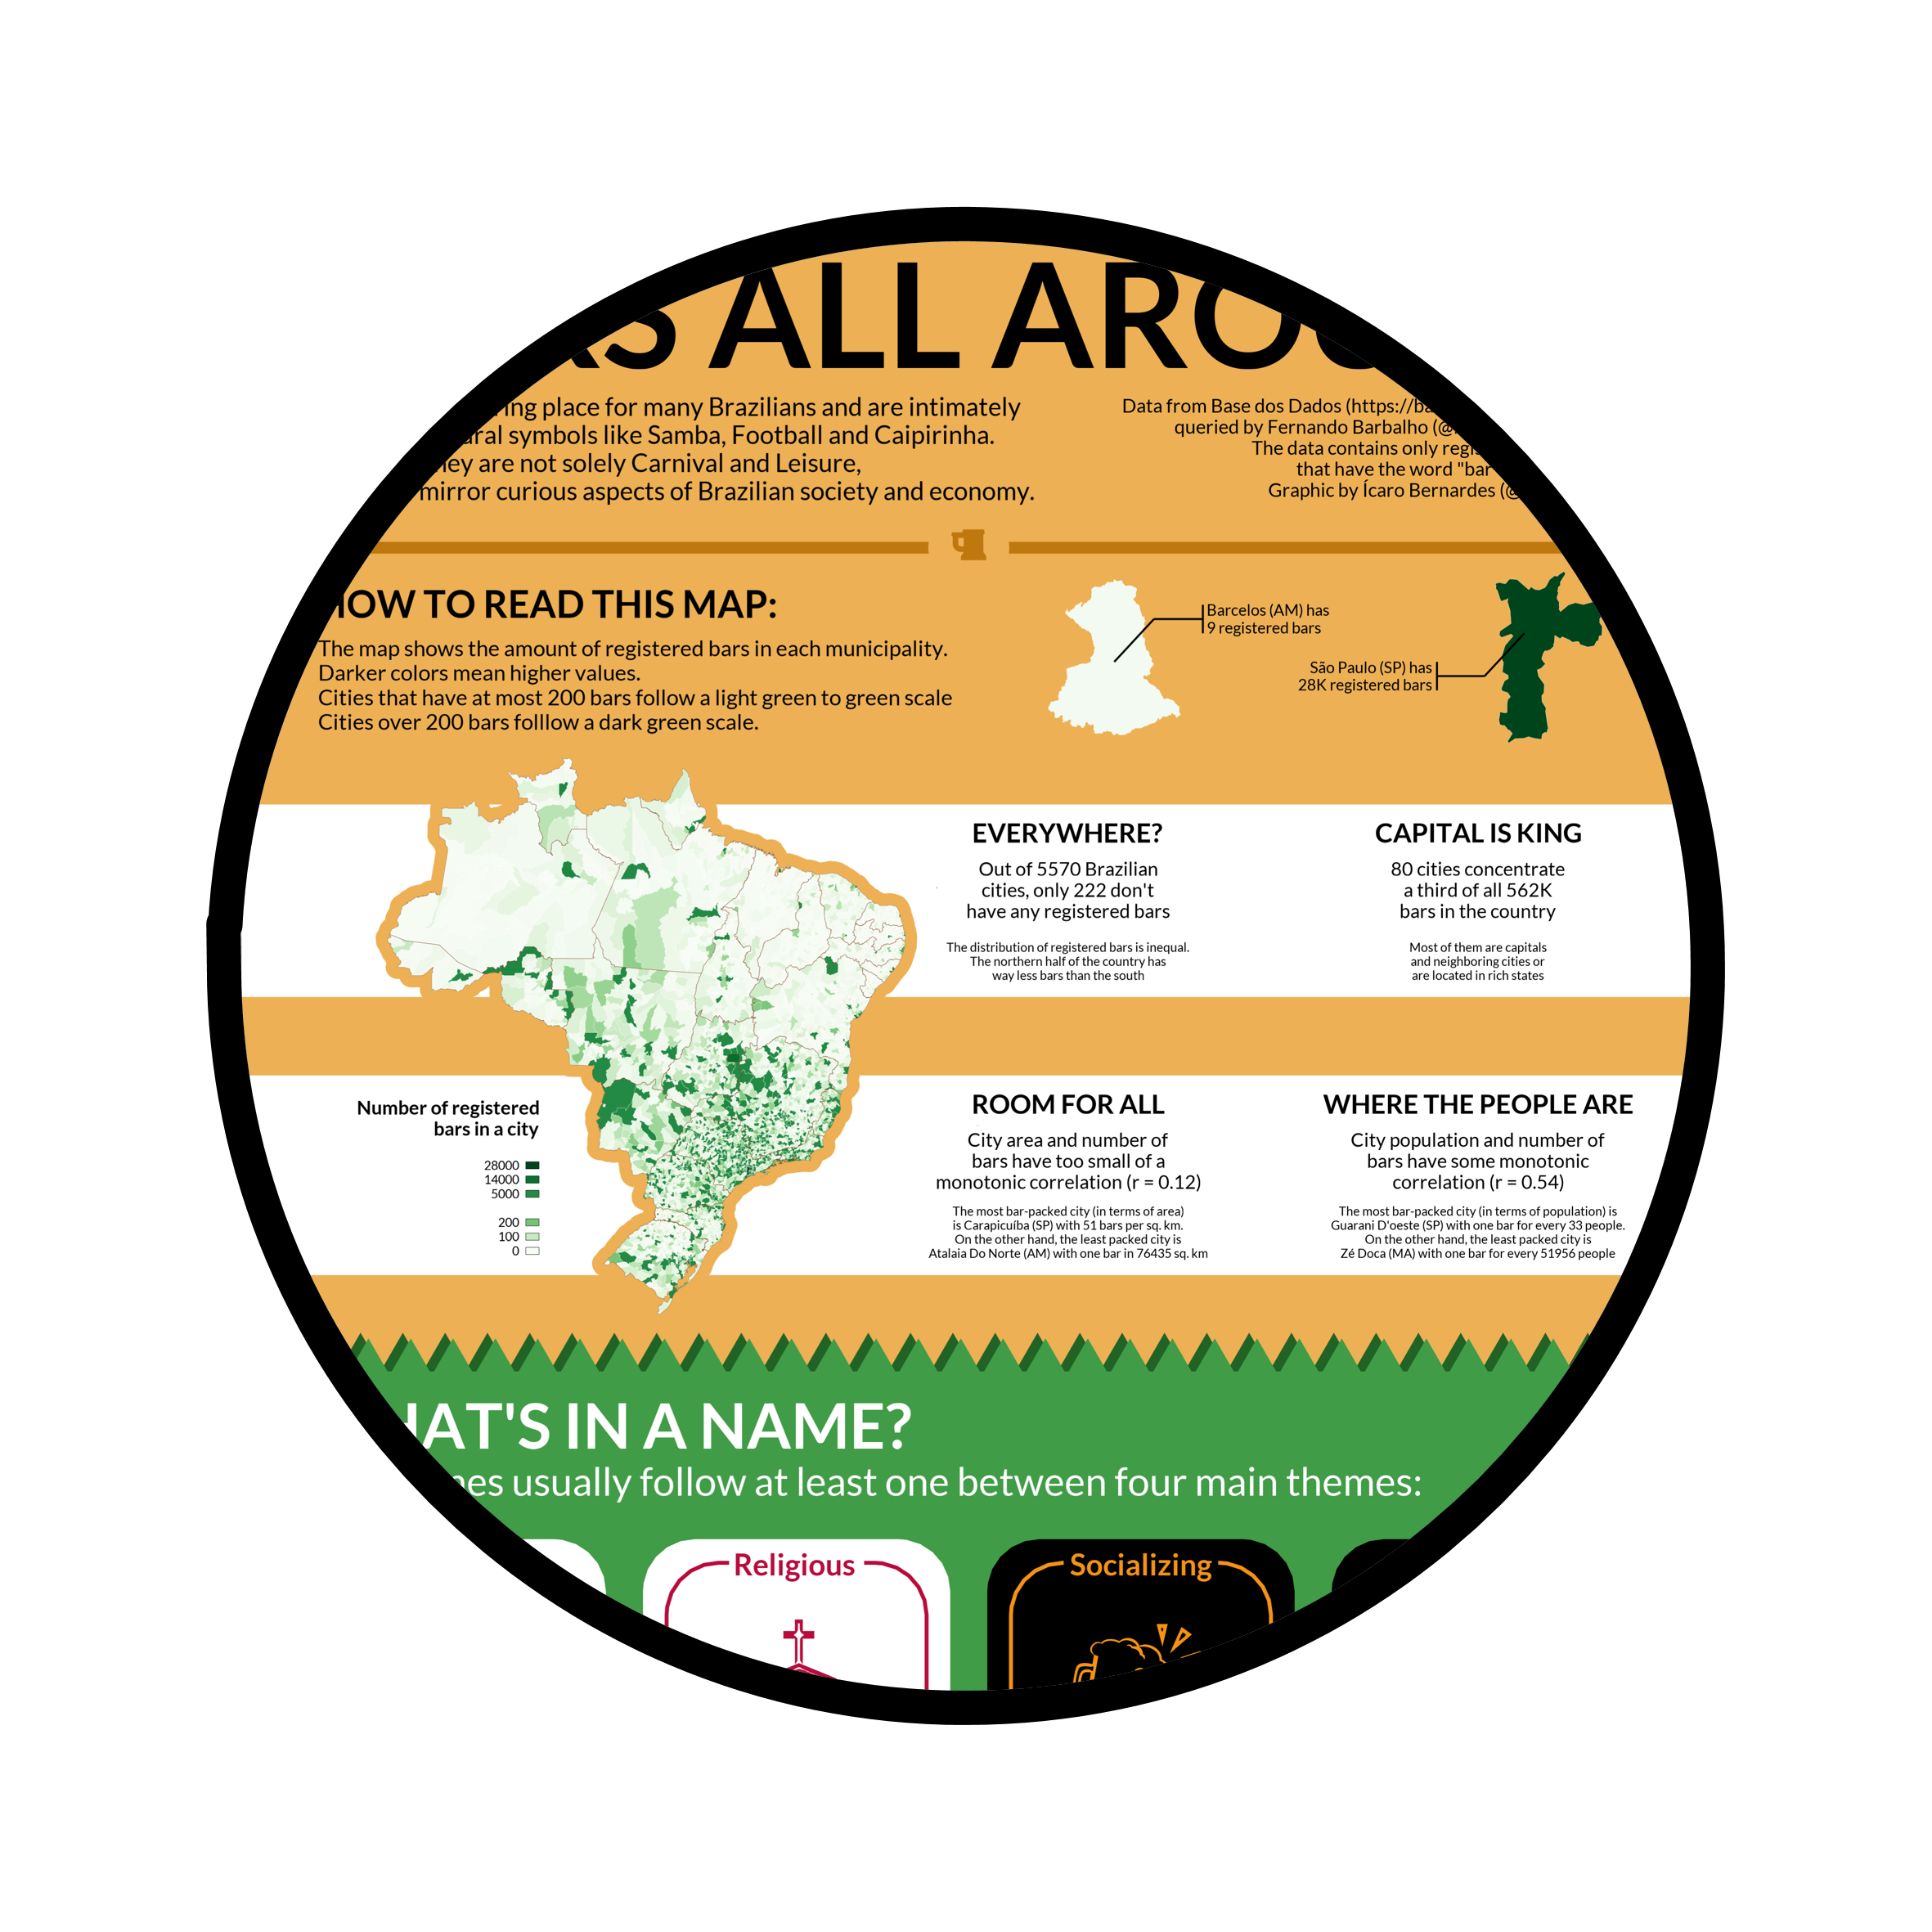
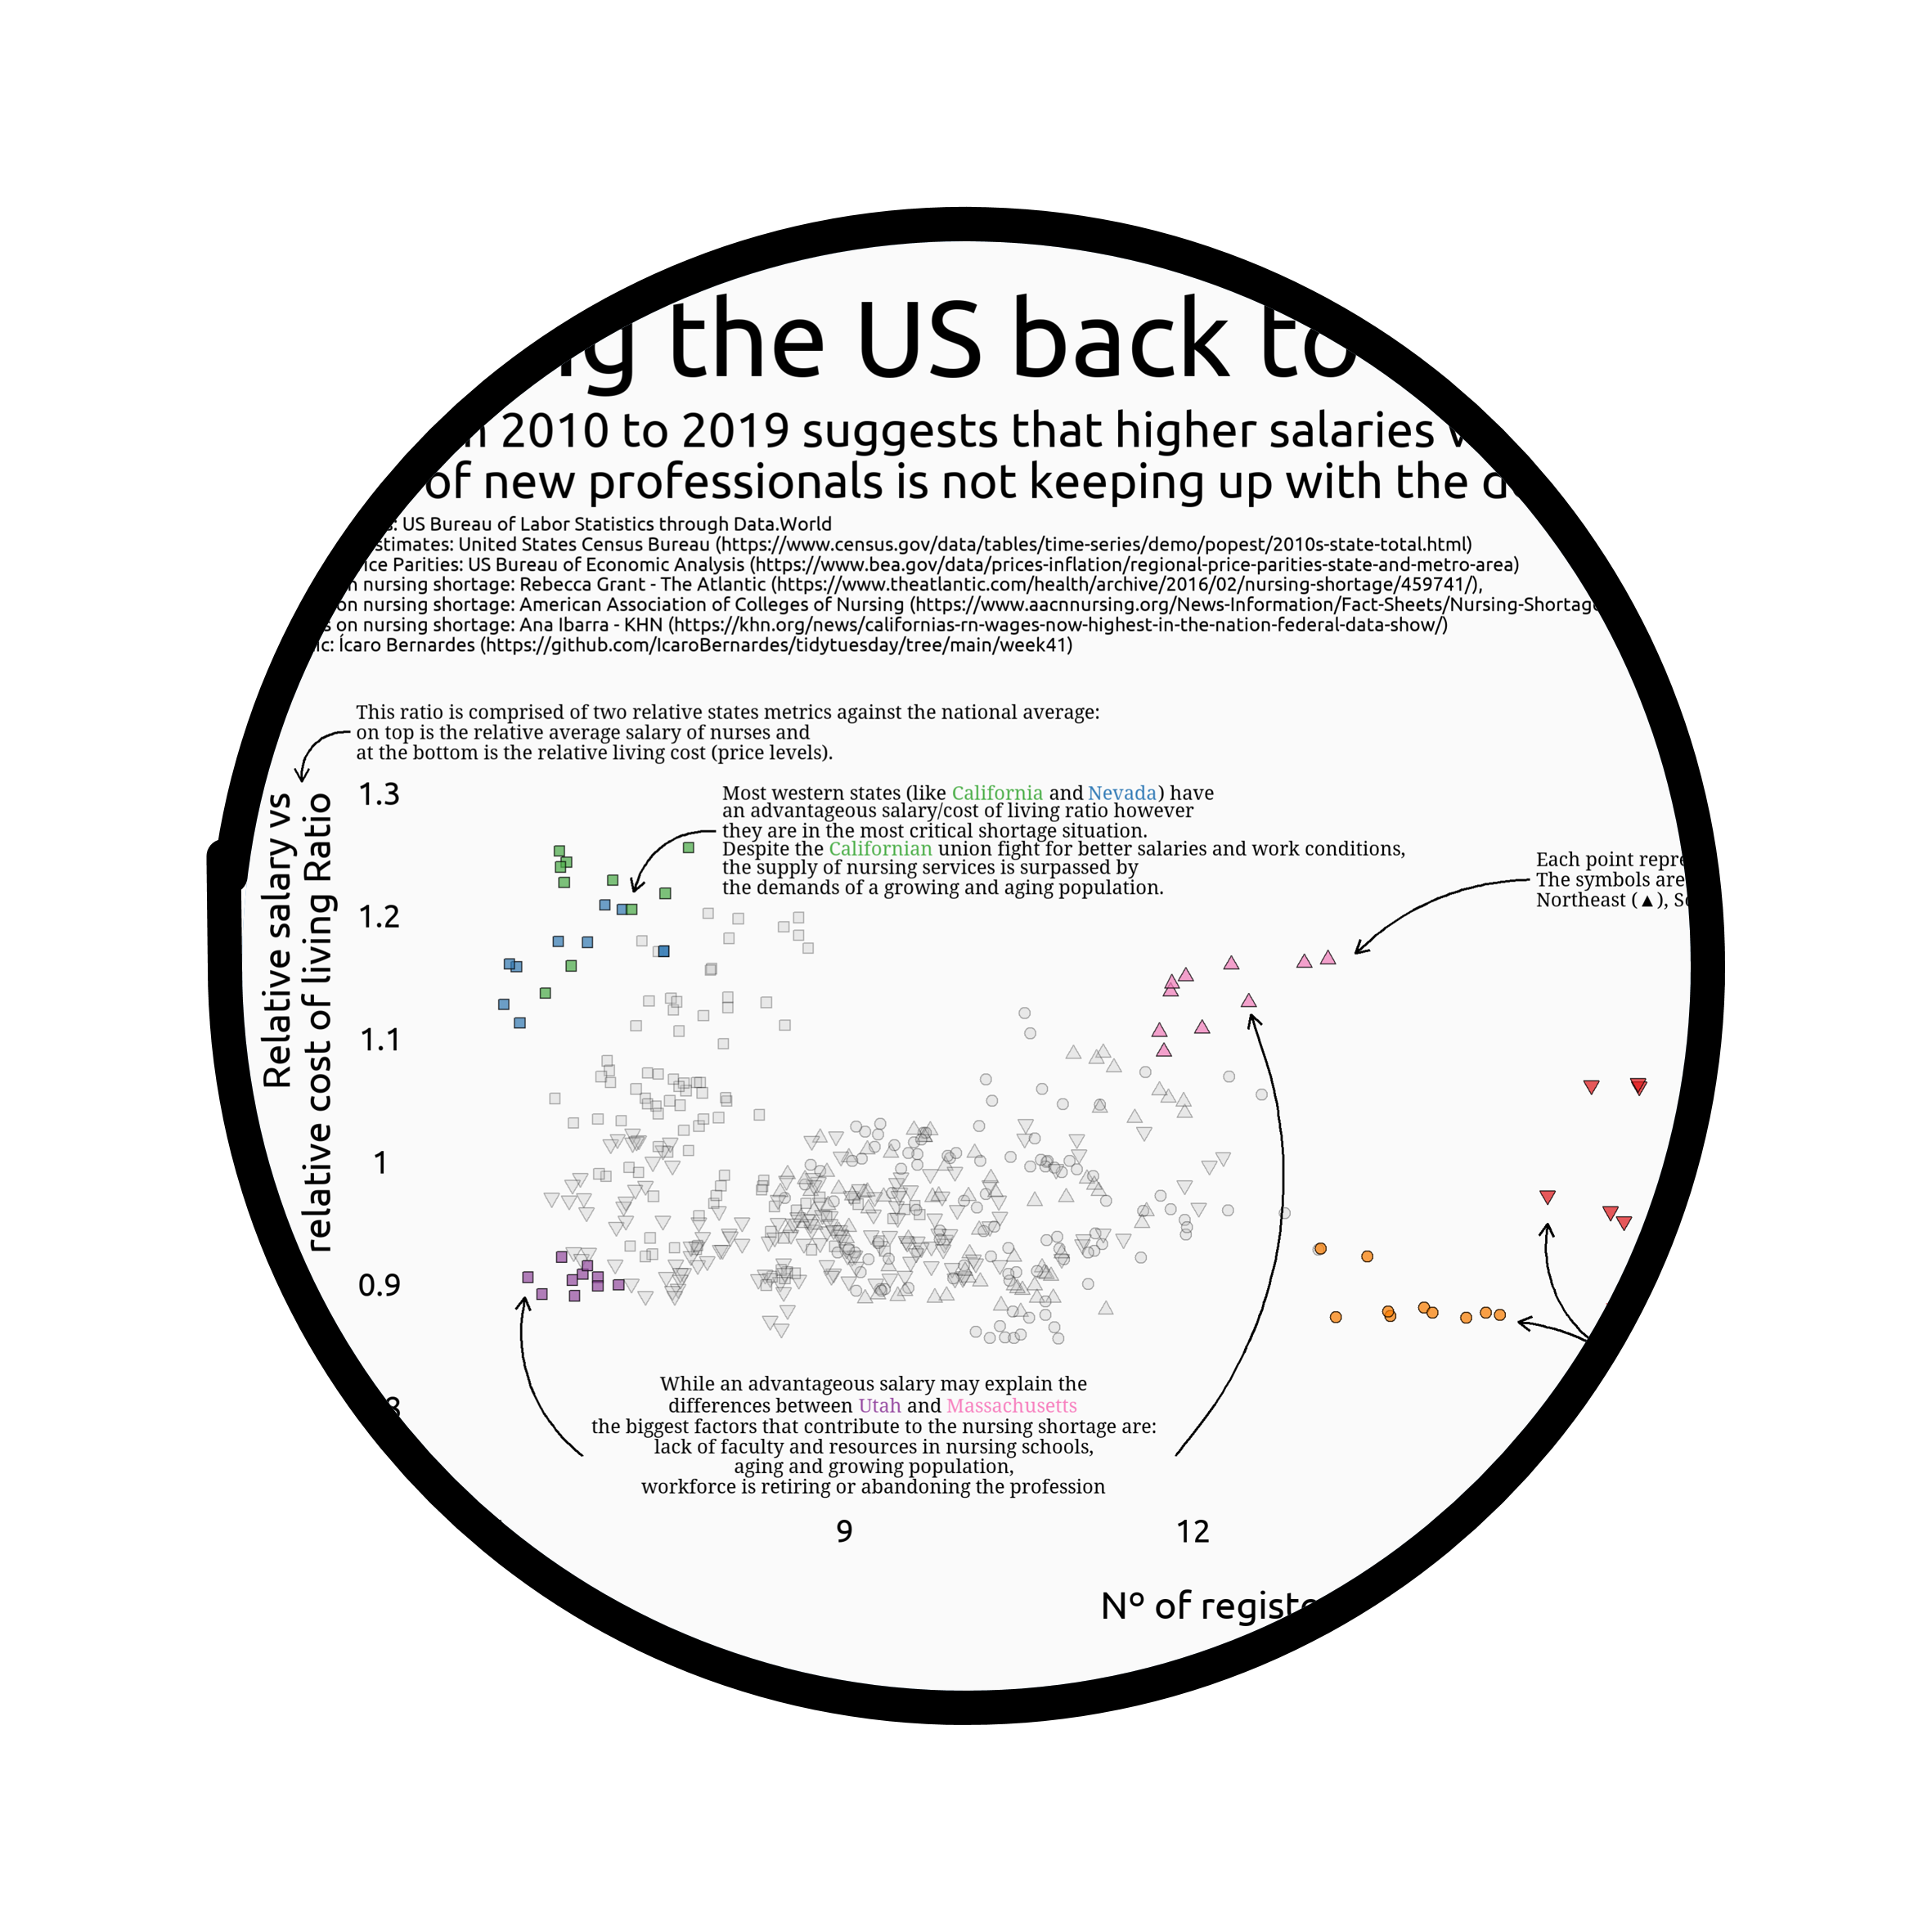
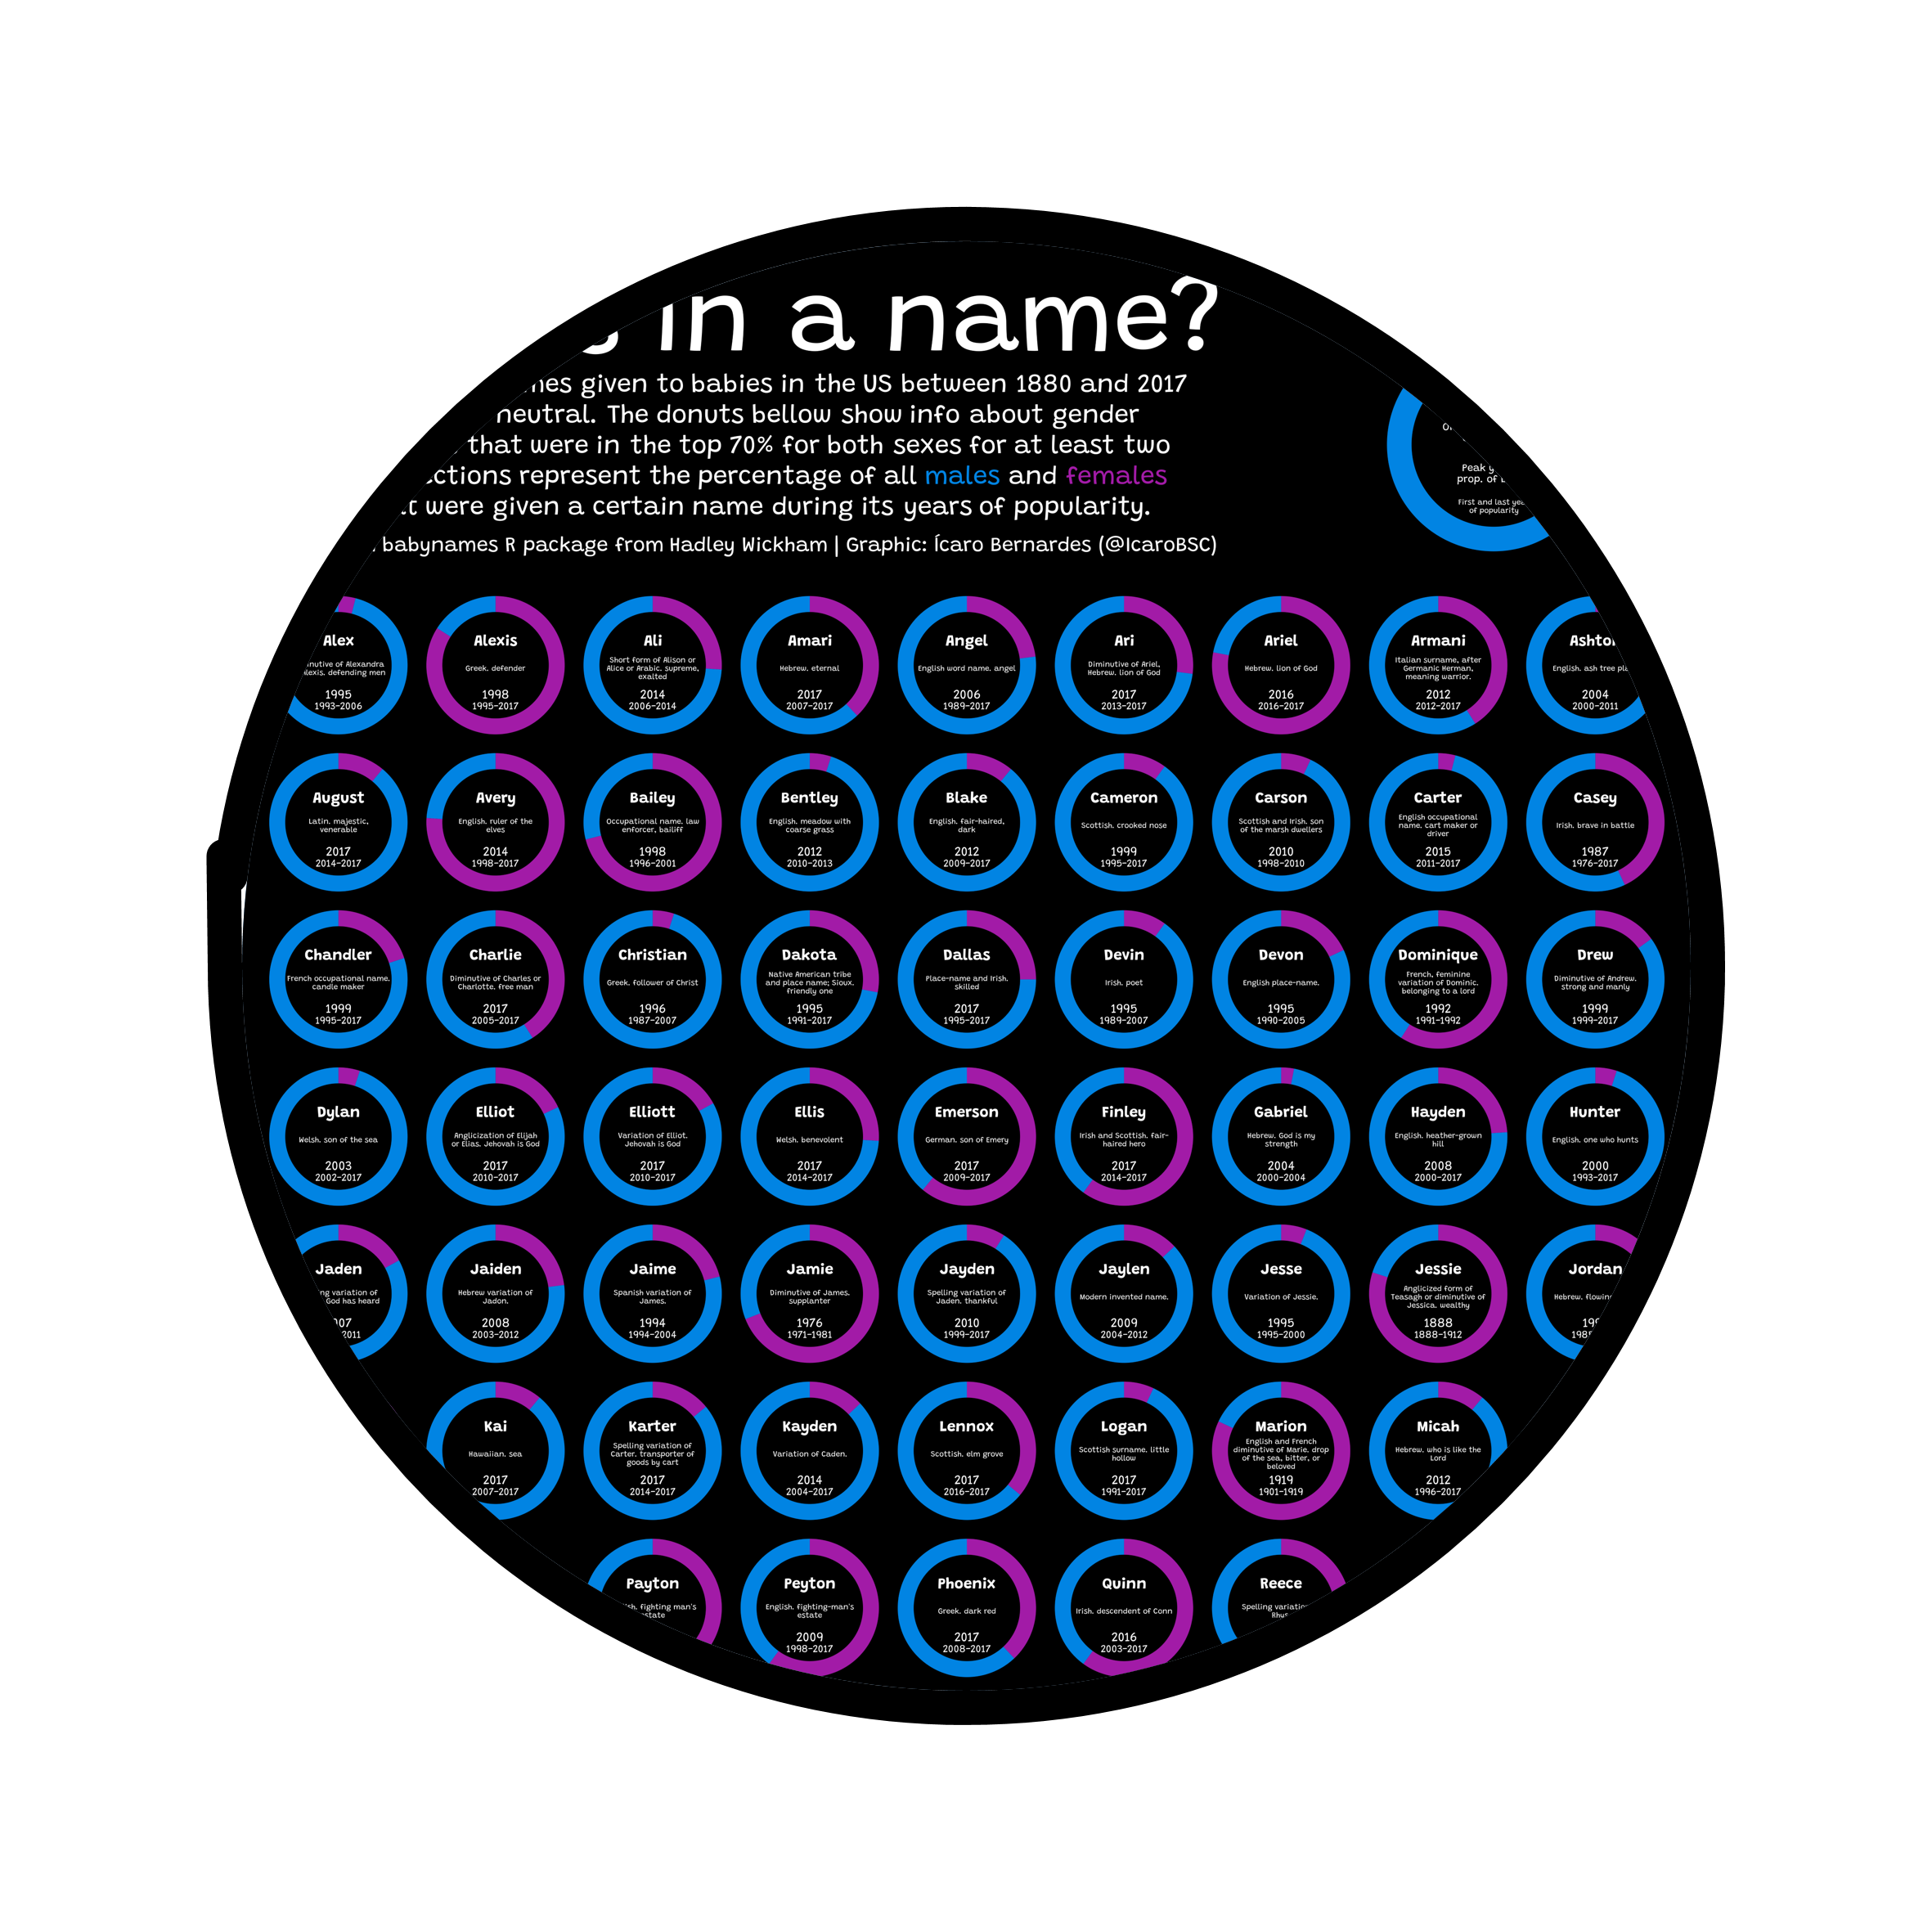
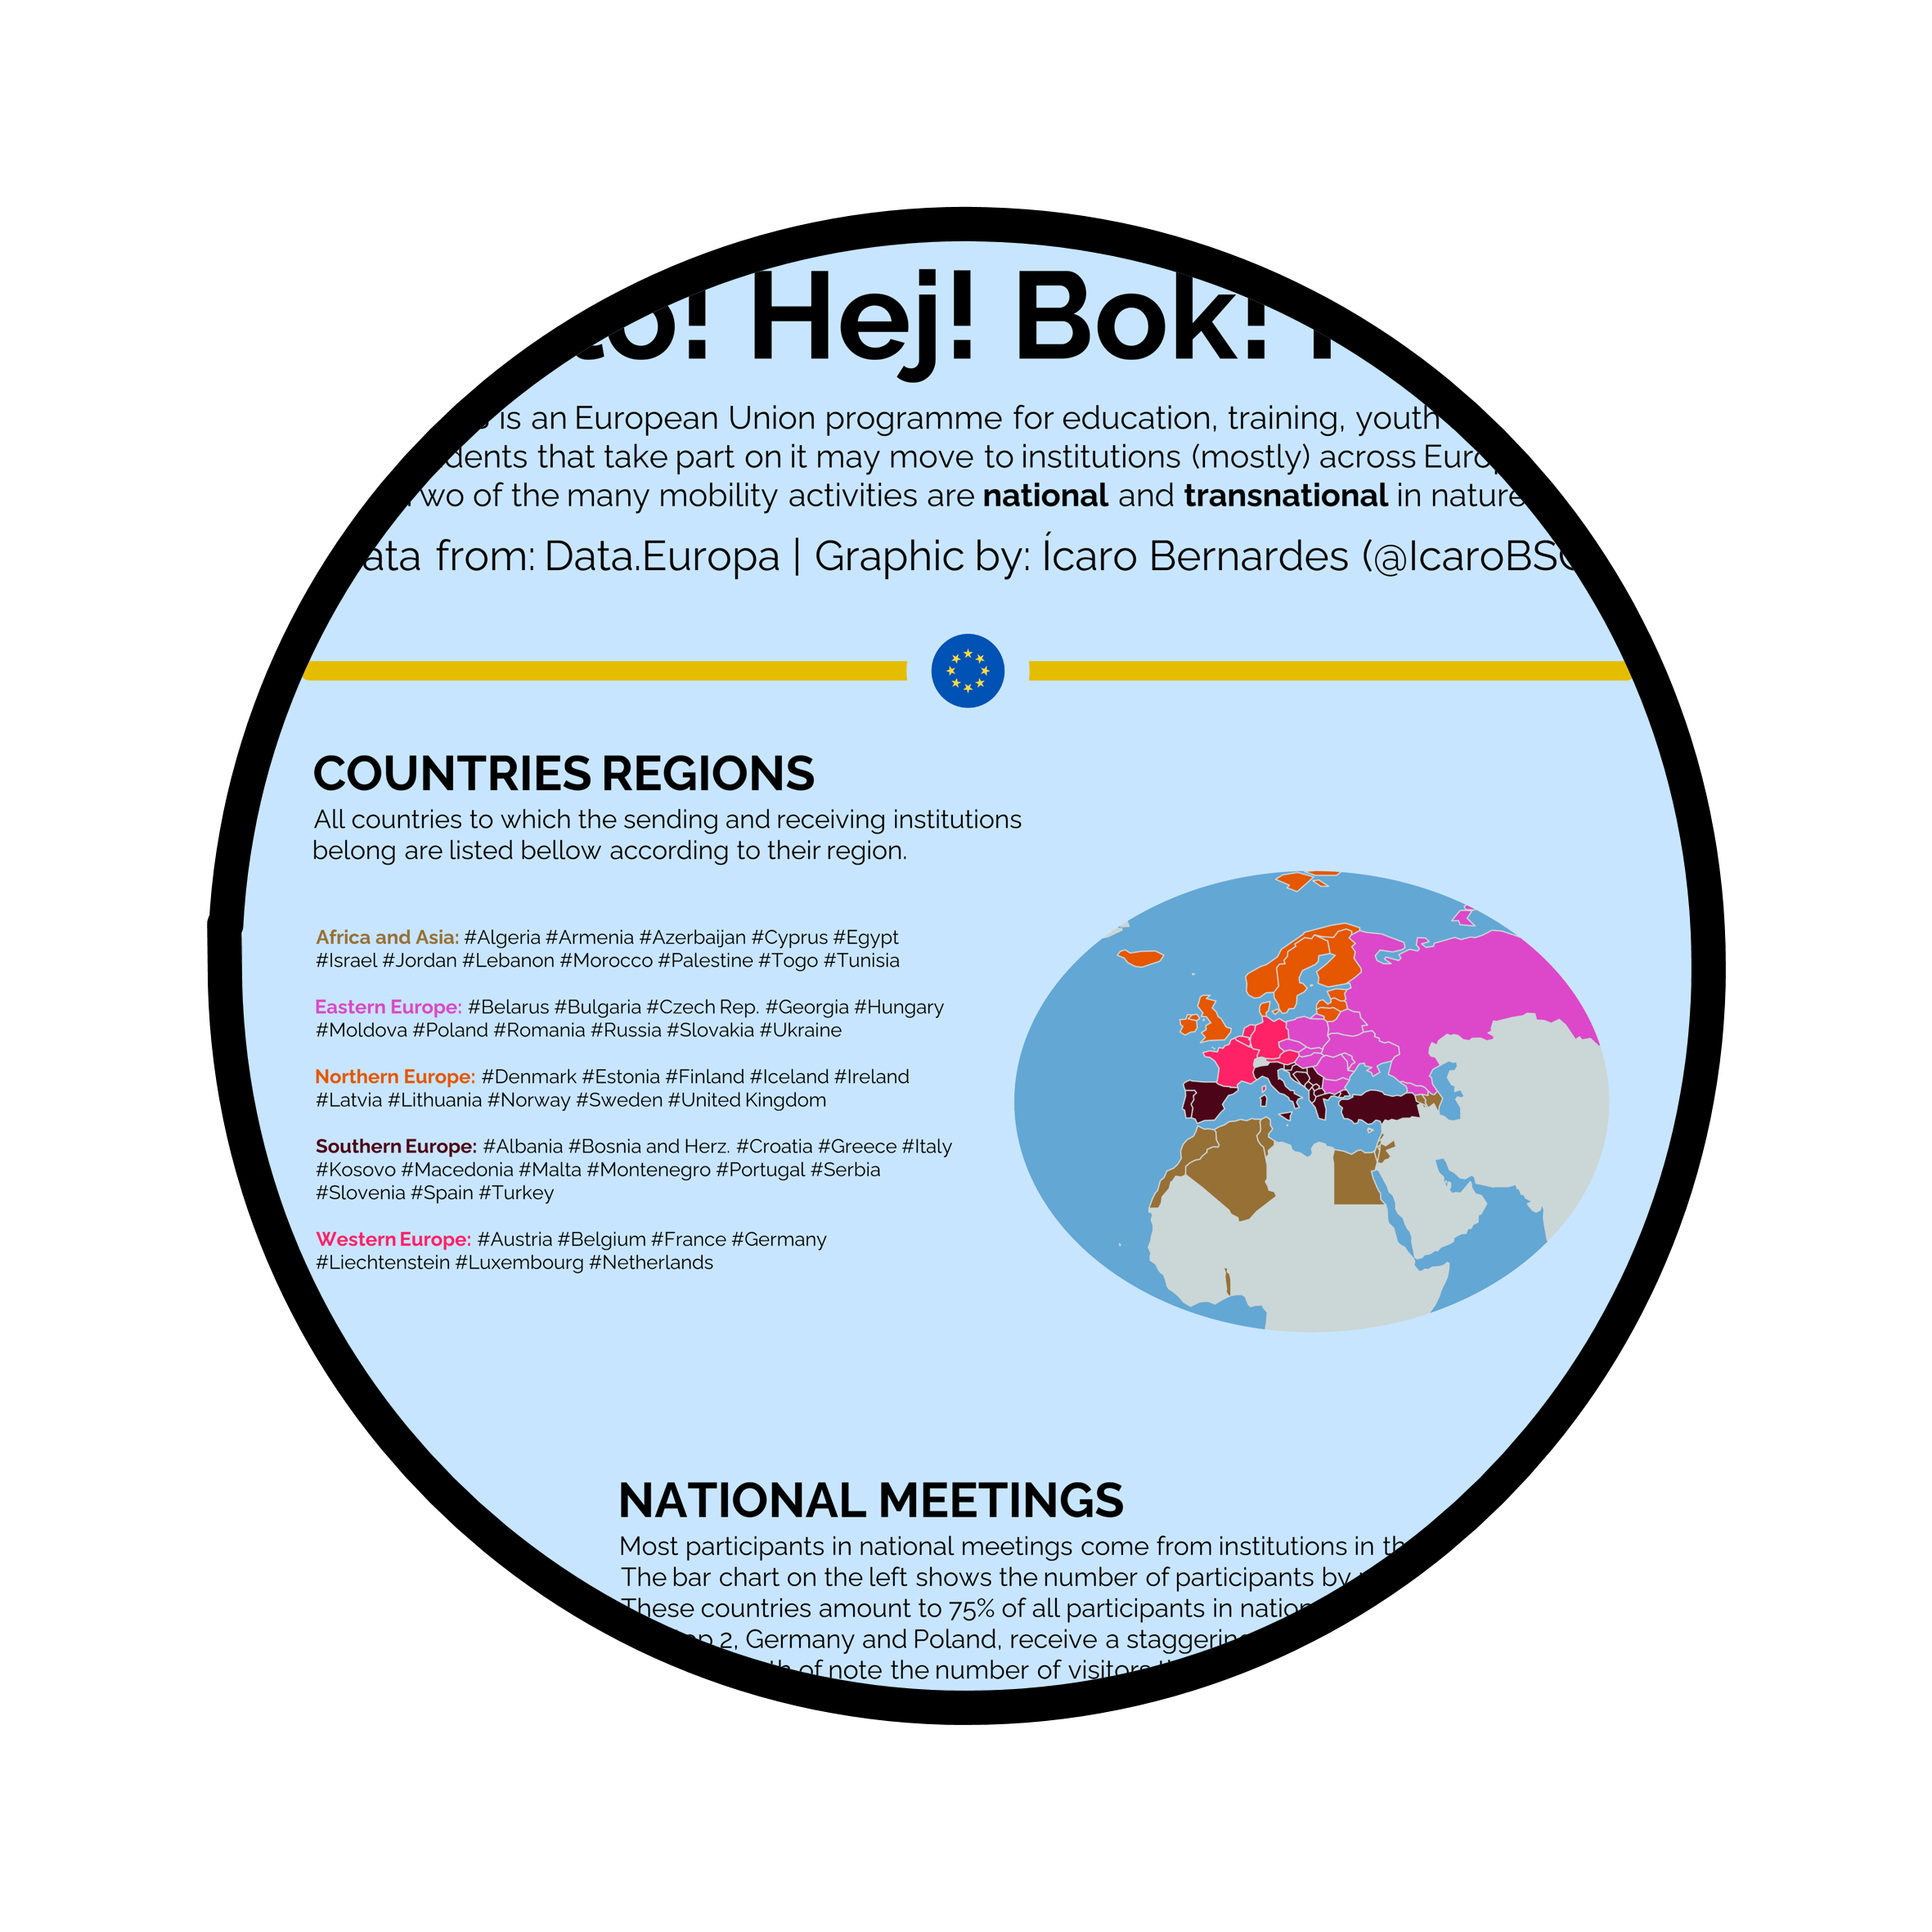
This challenge allowed me to produce a greater variety of charts. I was able to do pictograms, tables, maps, posters and strip charts in R and Figma.
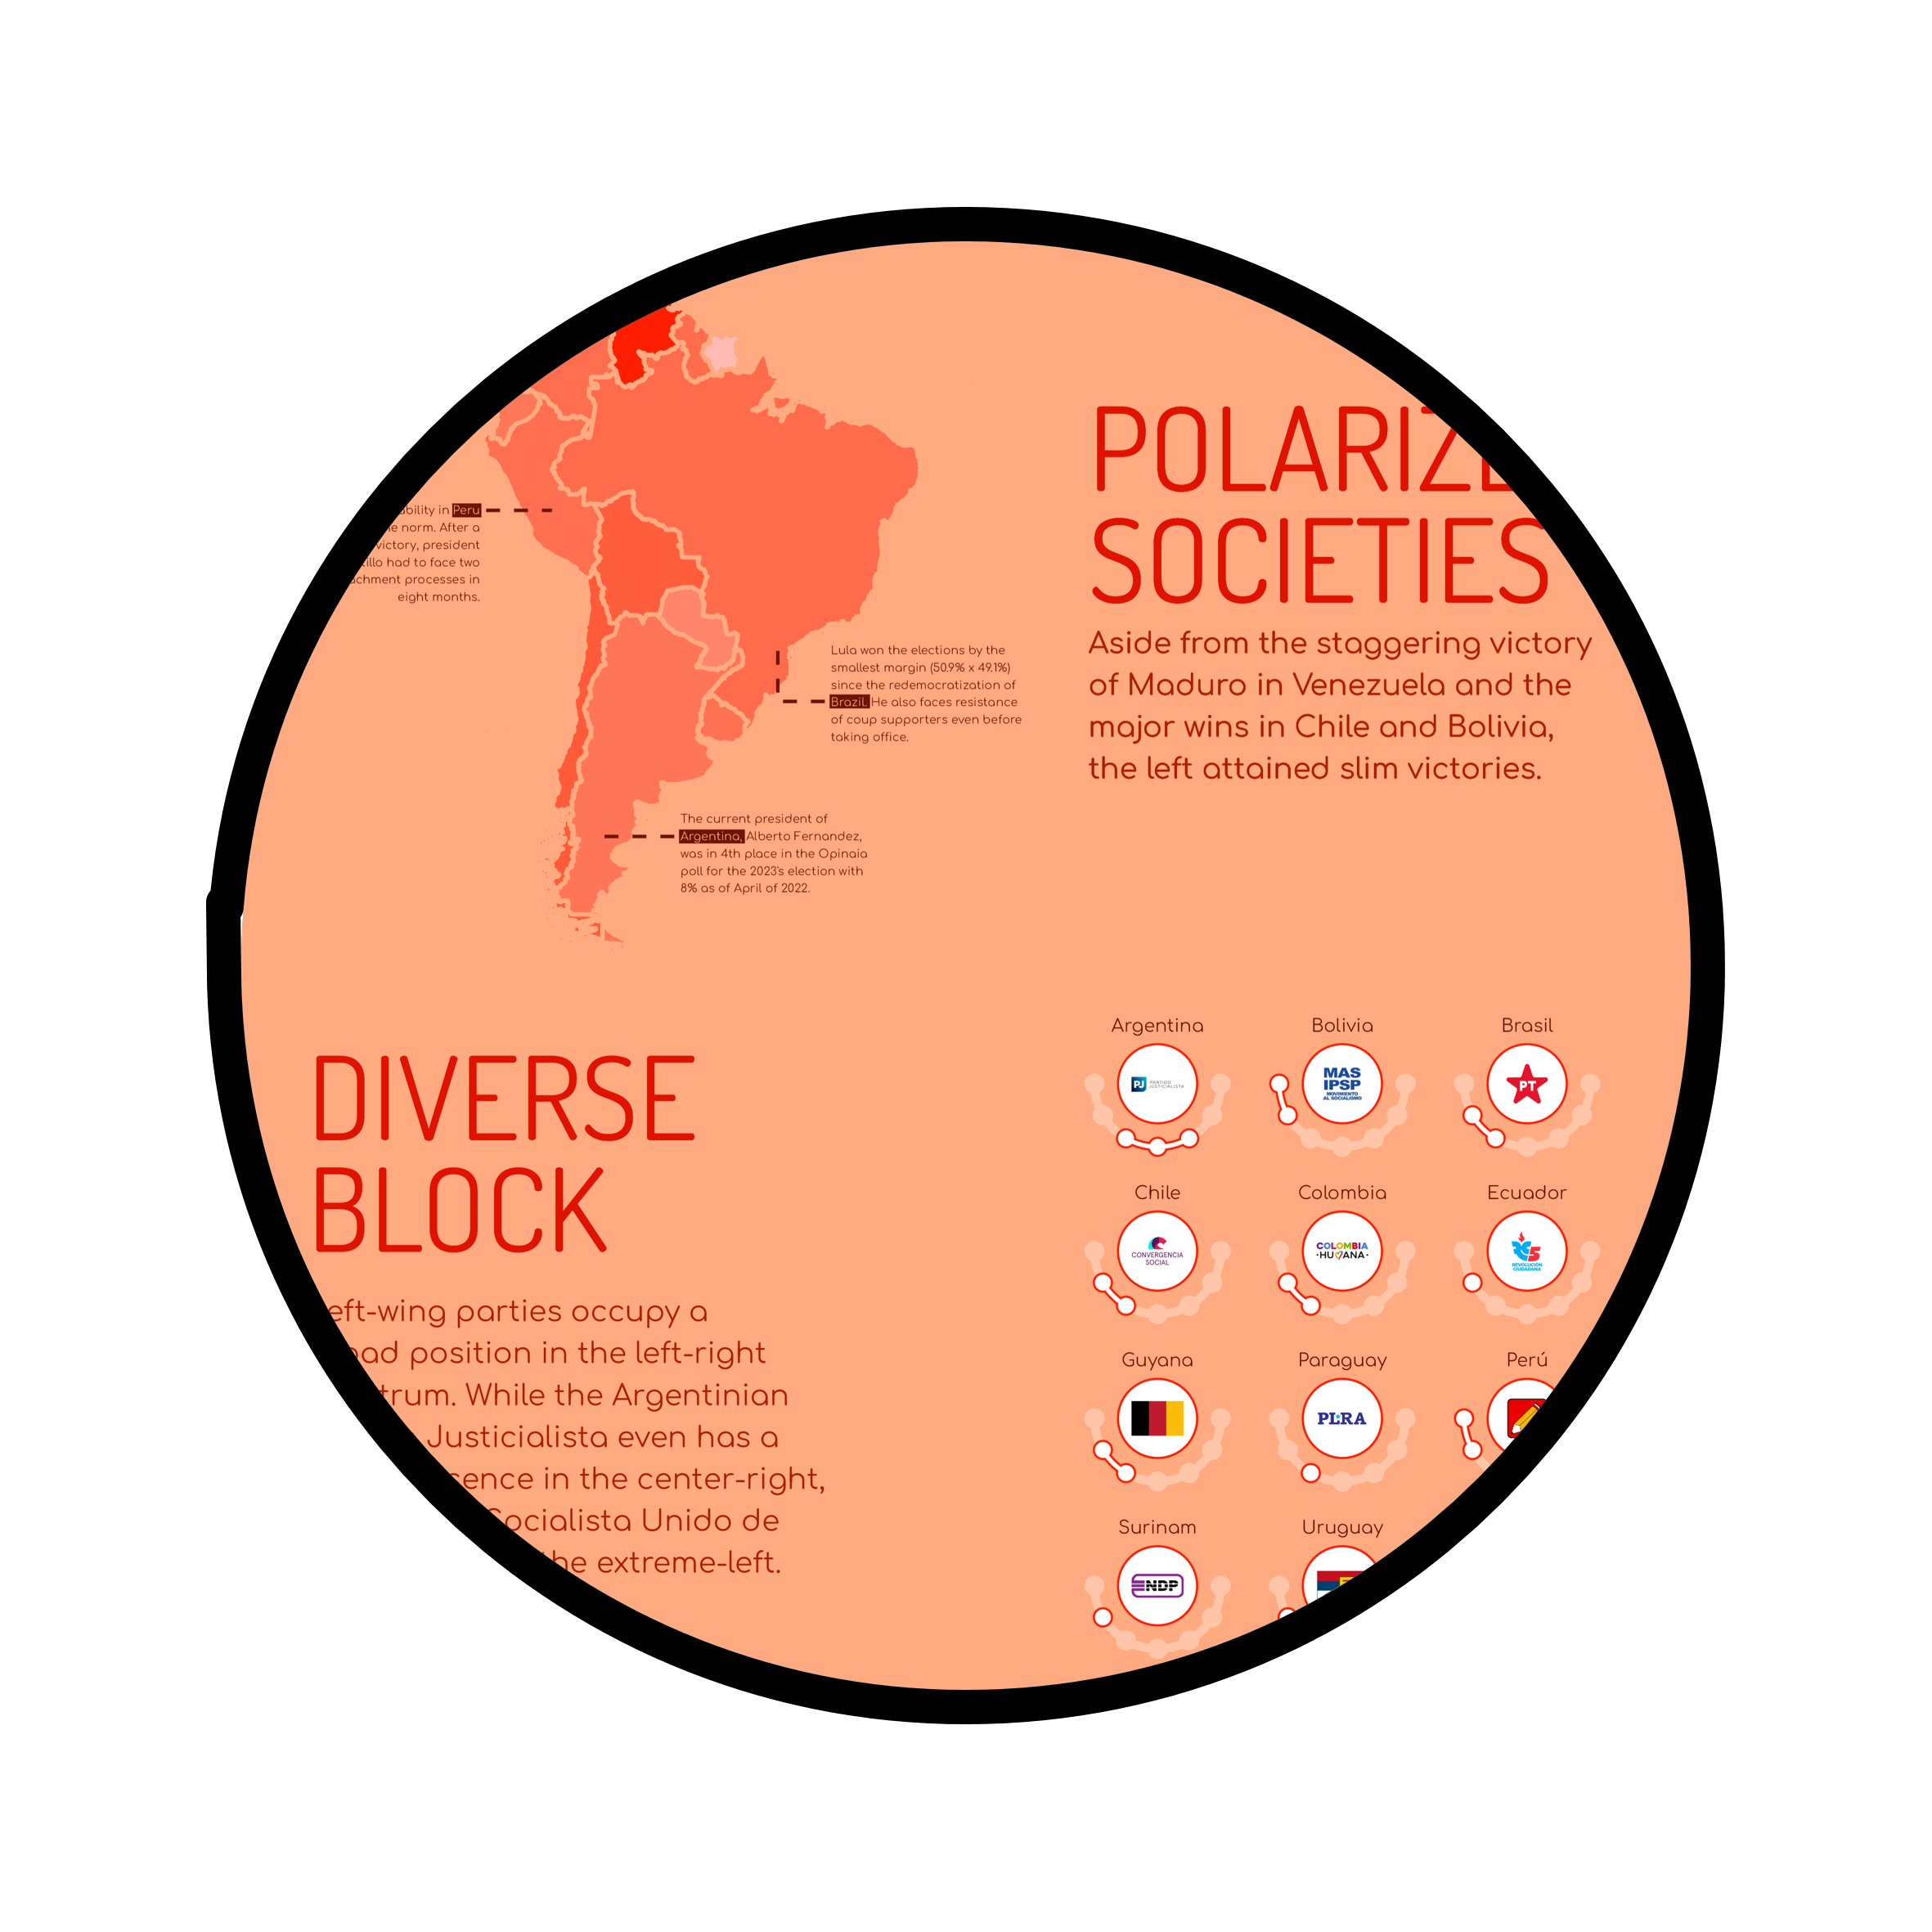
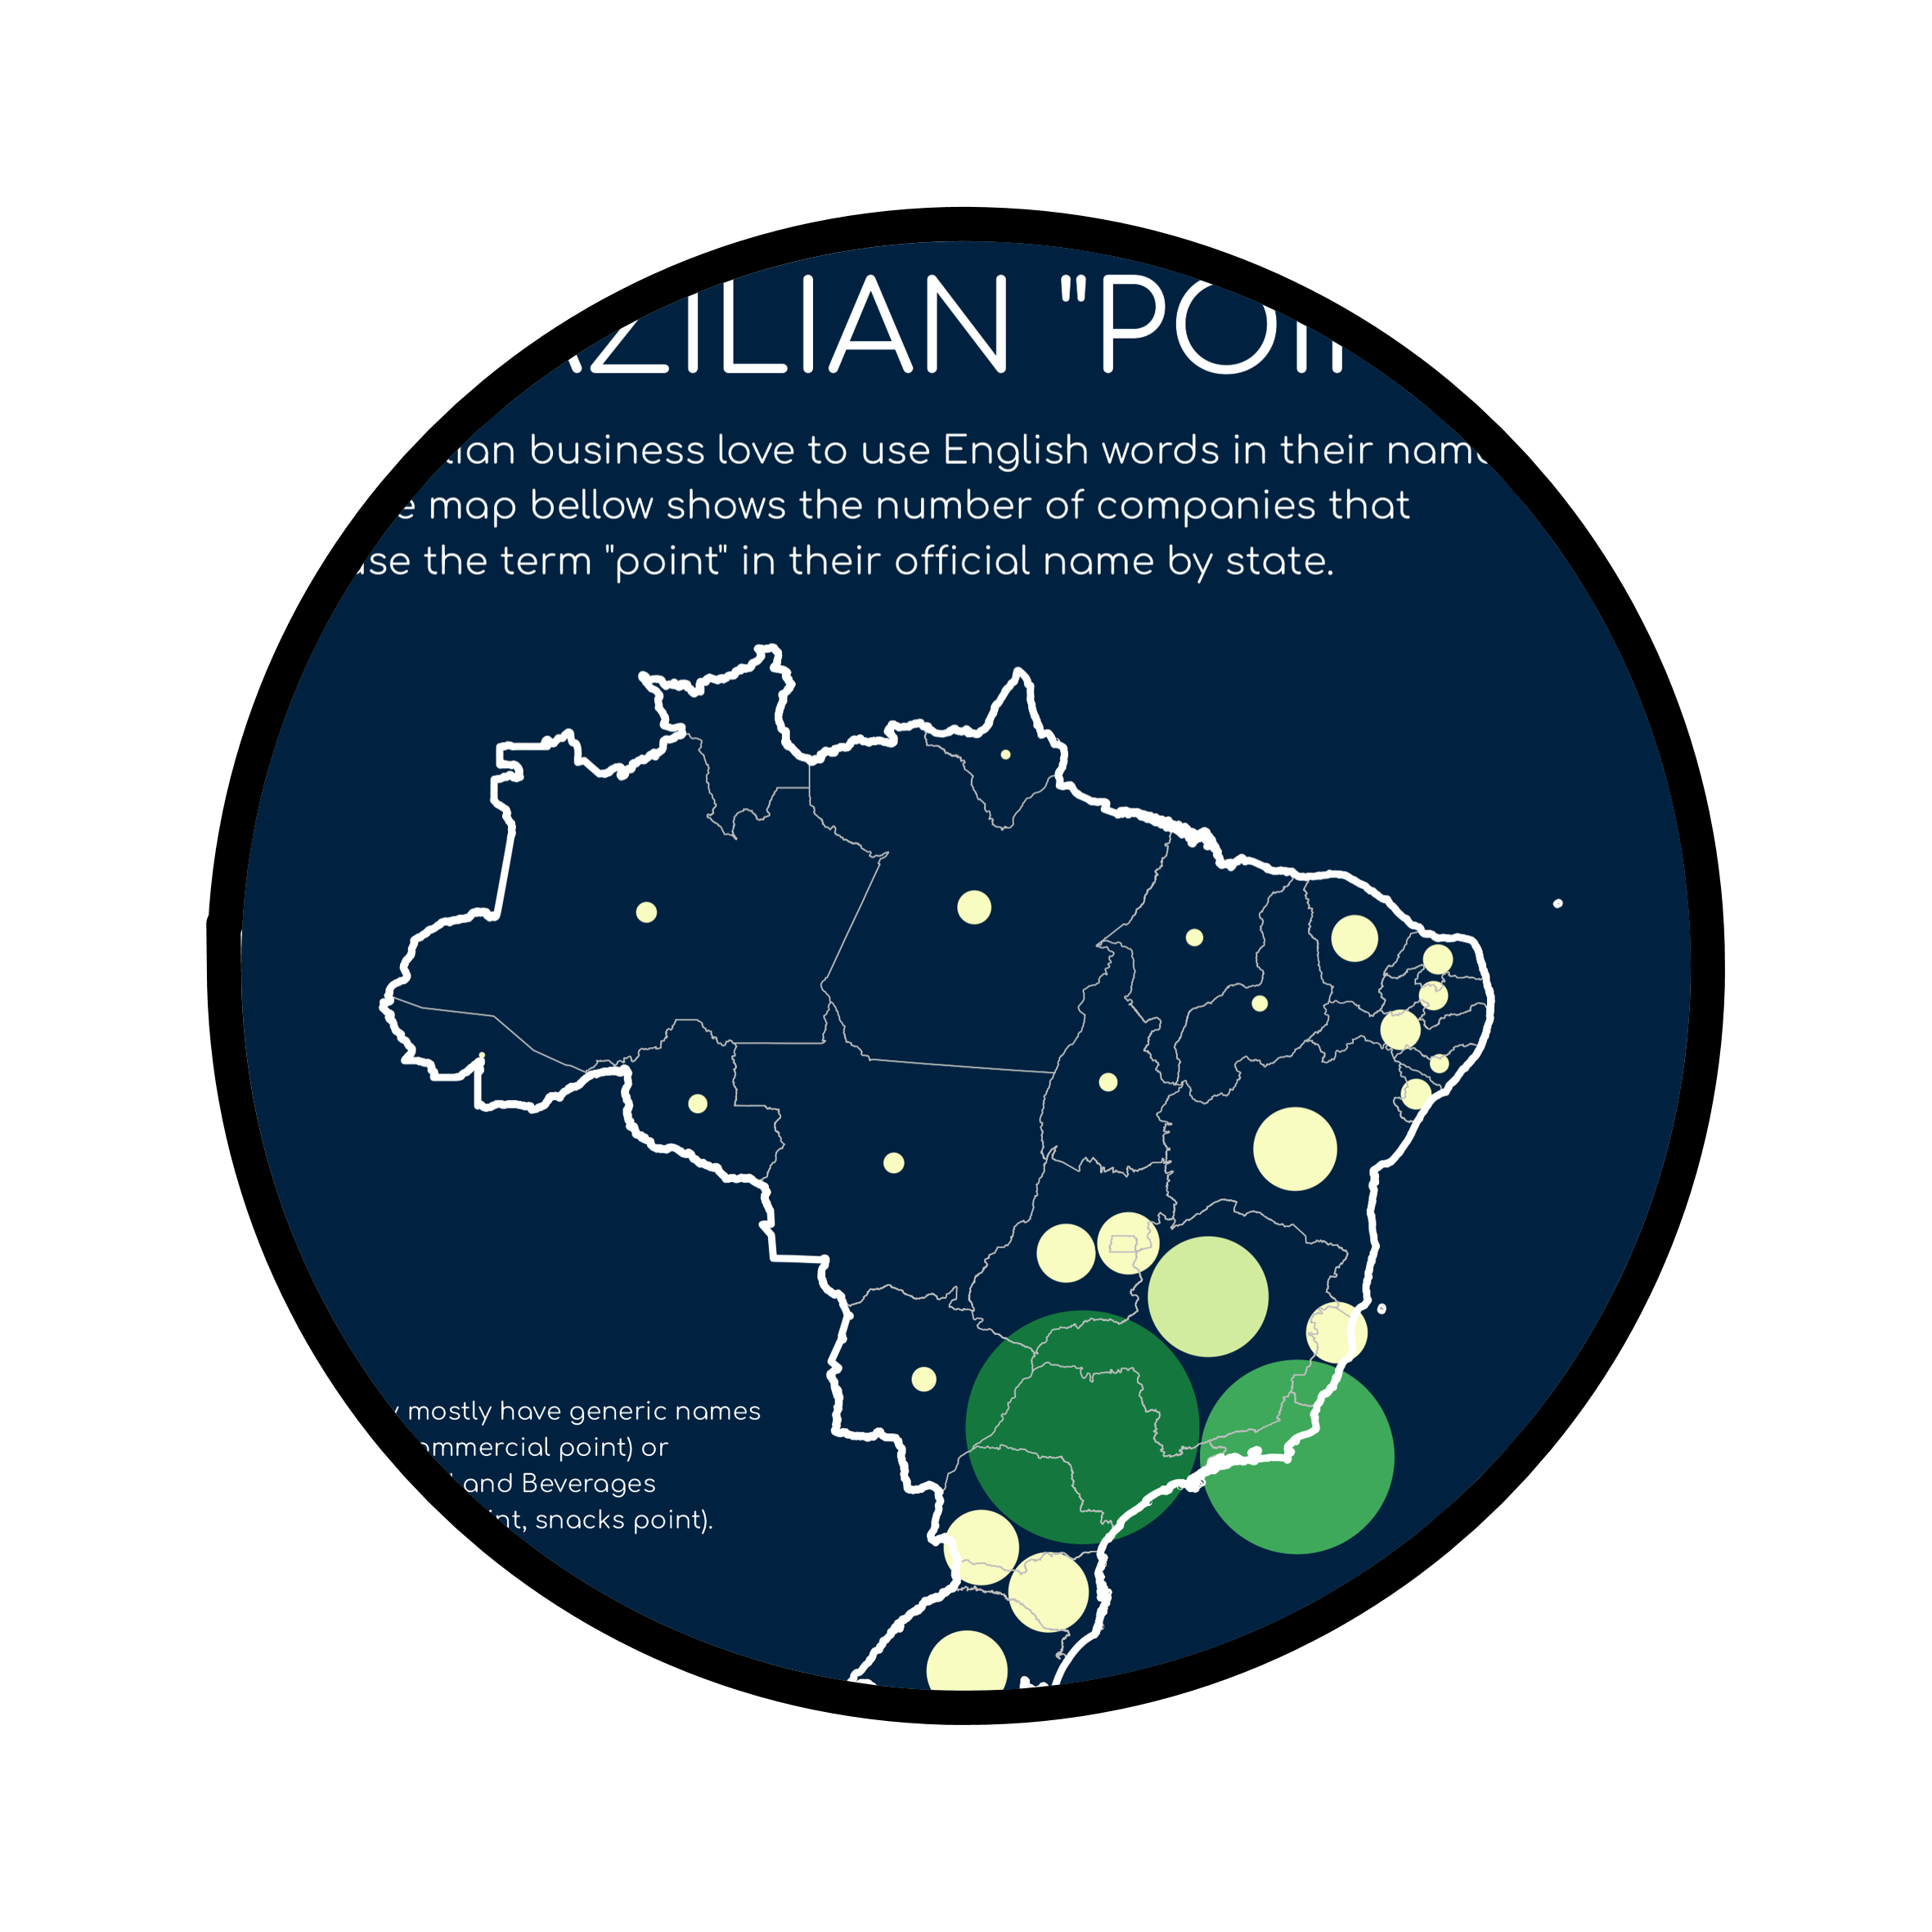
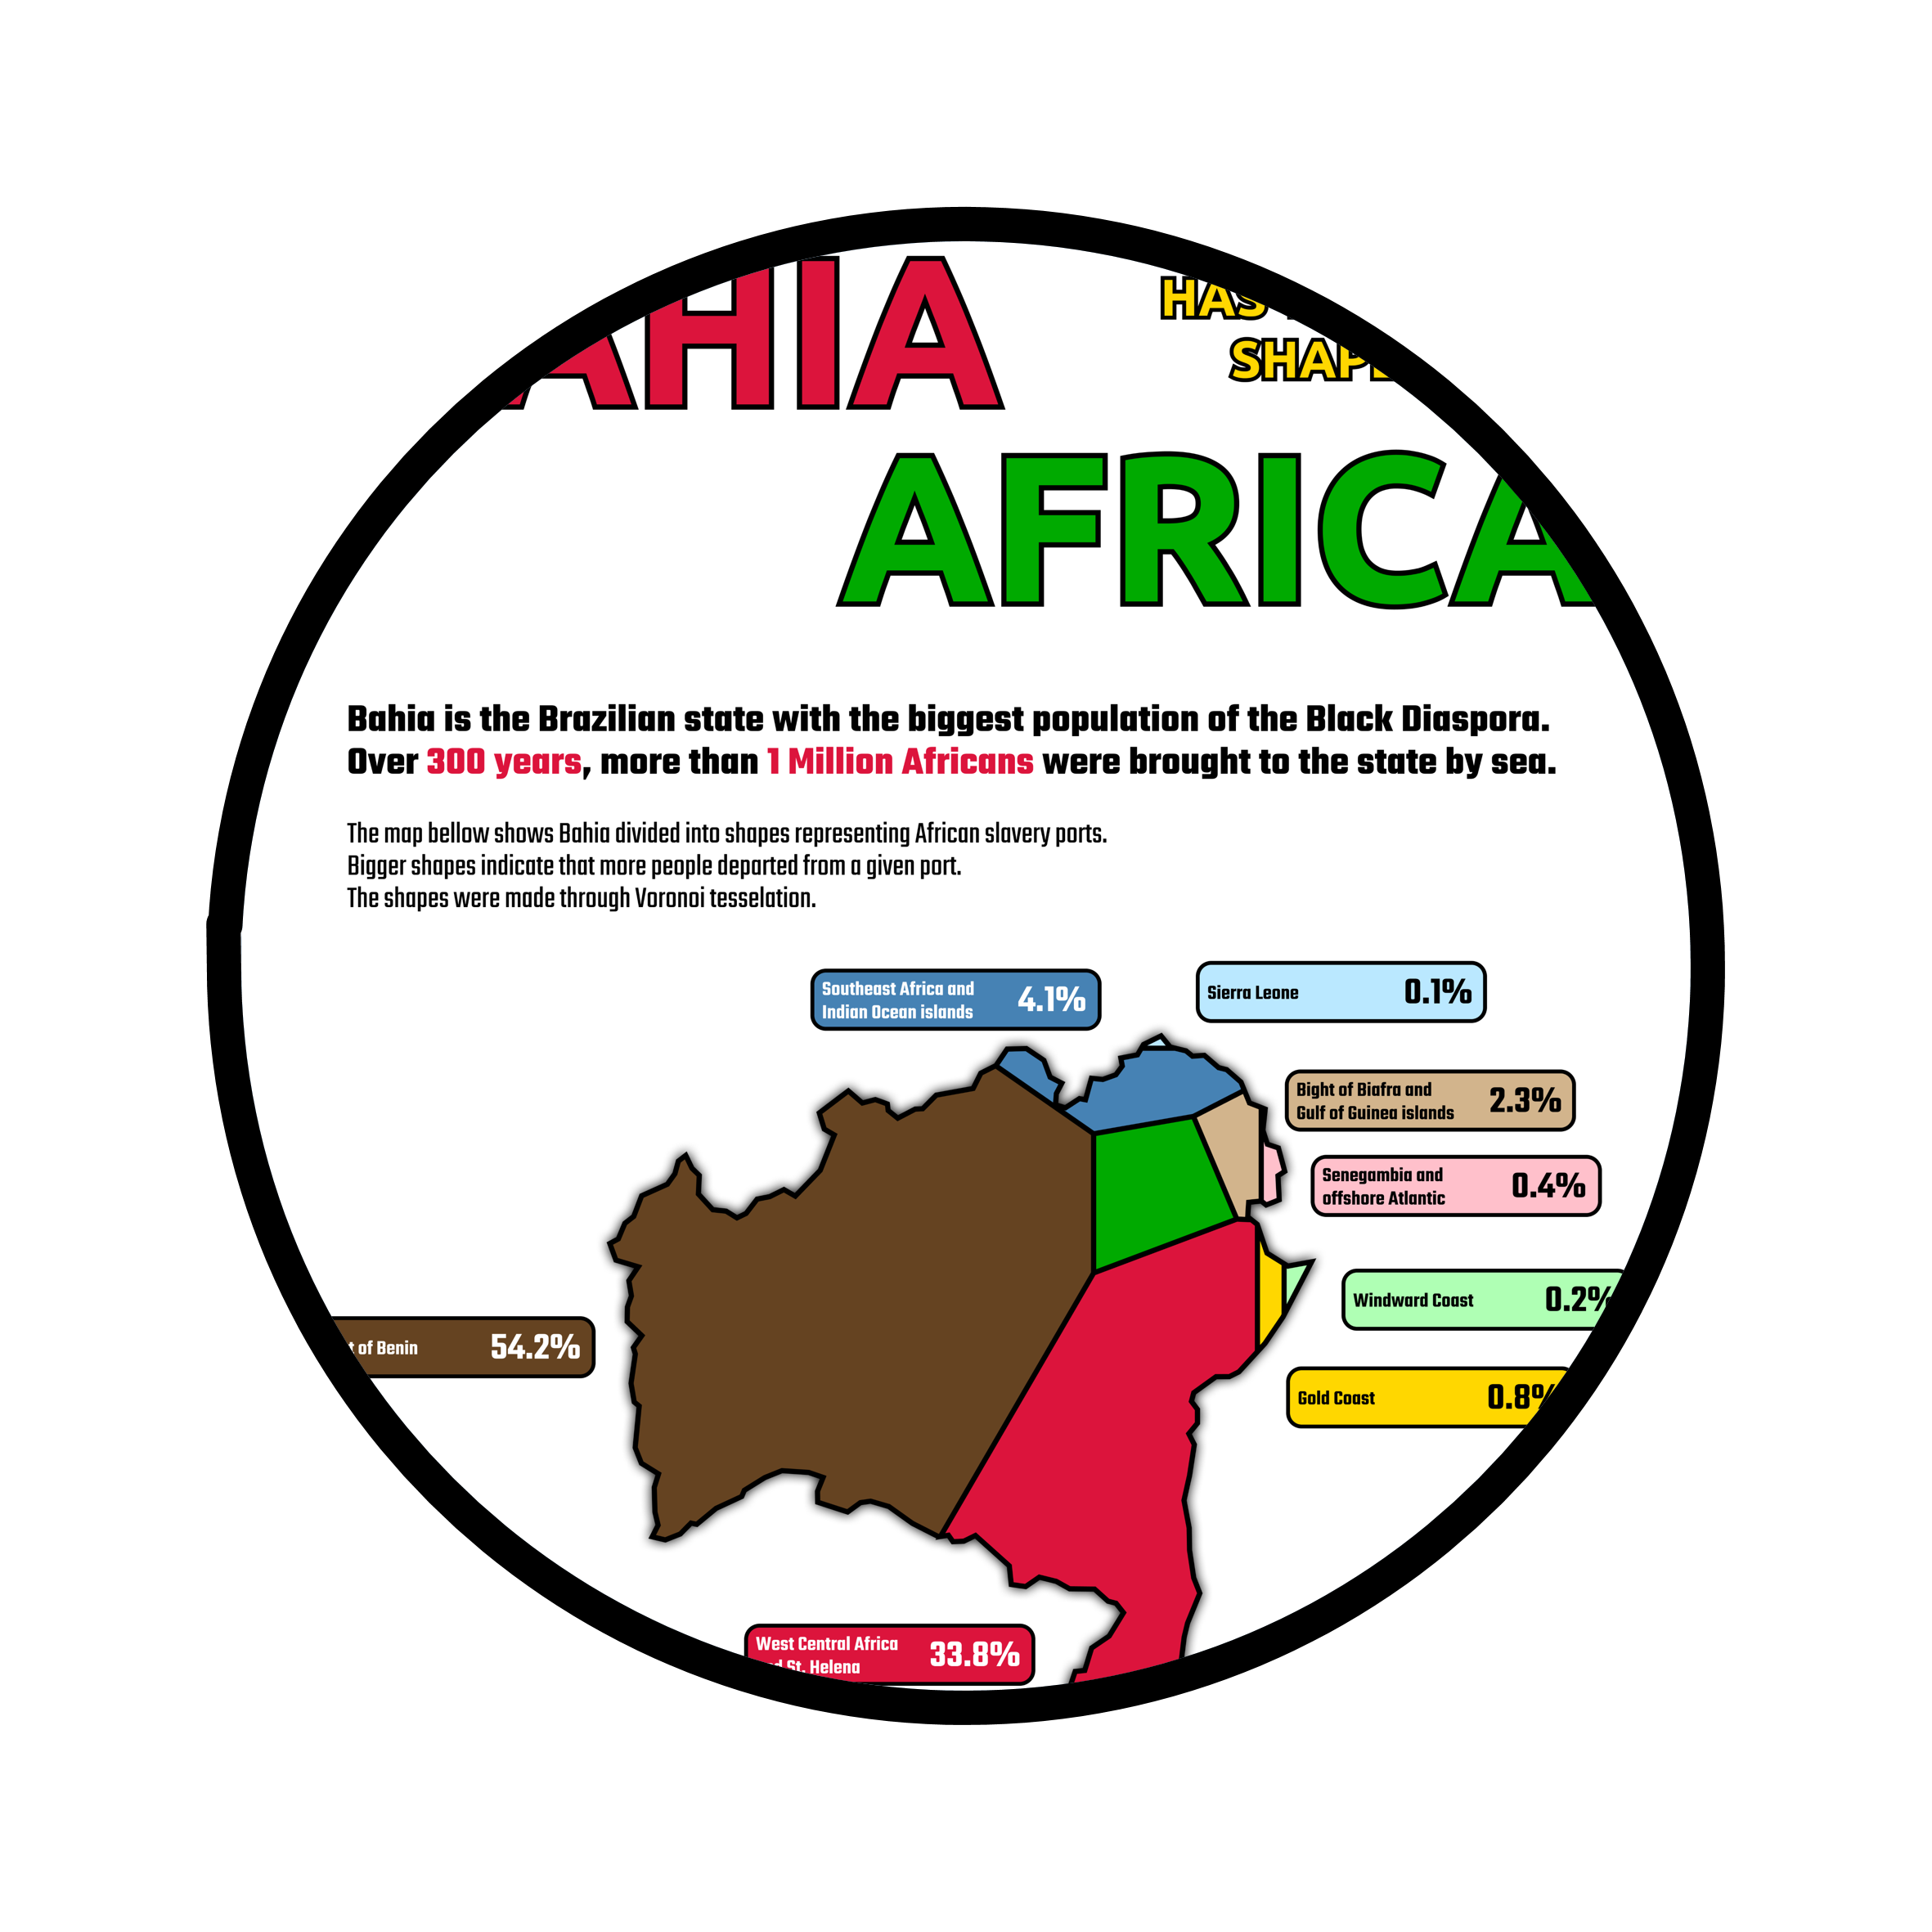
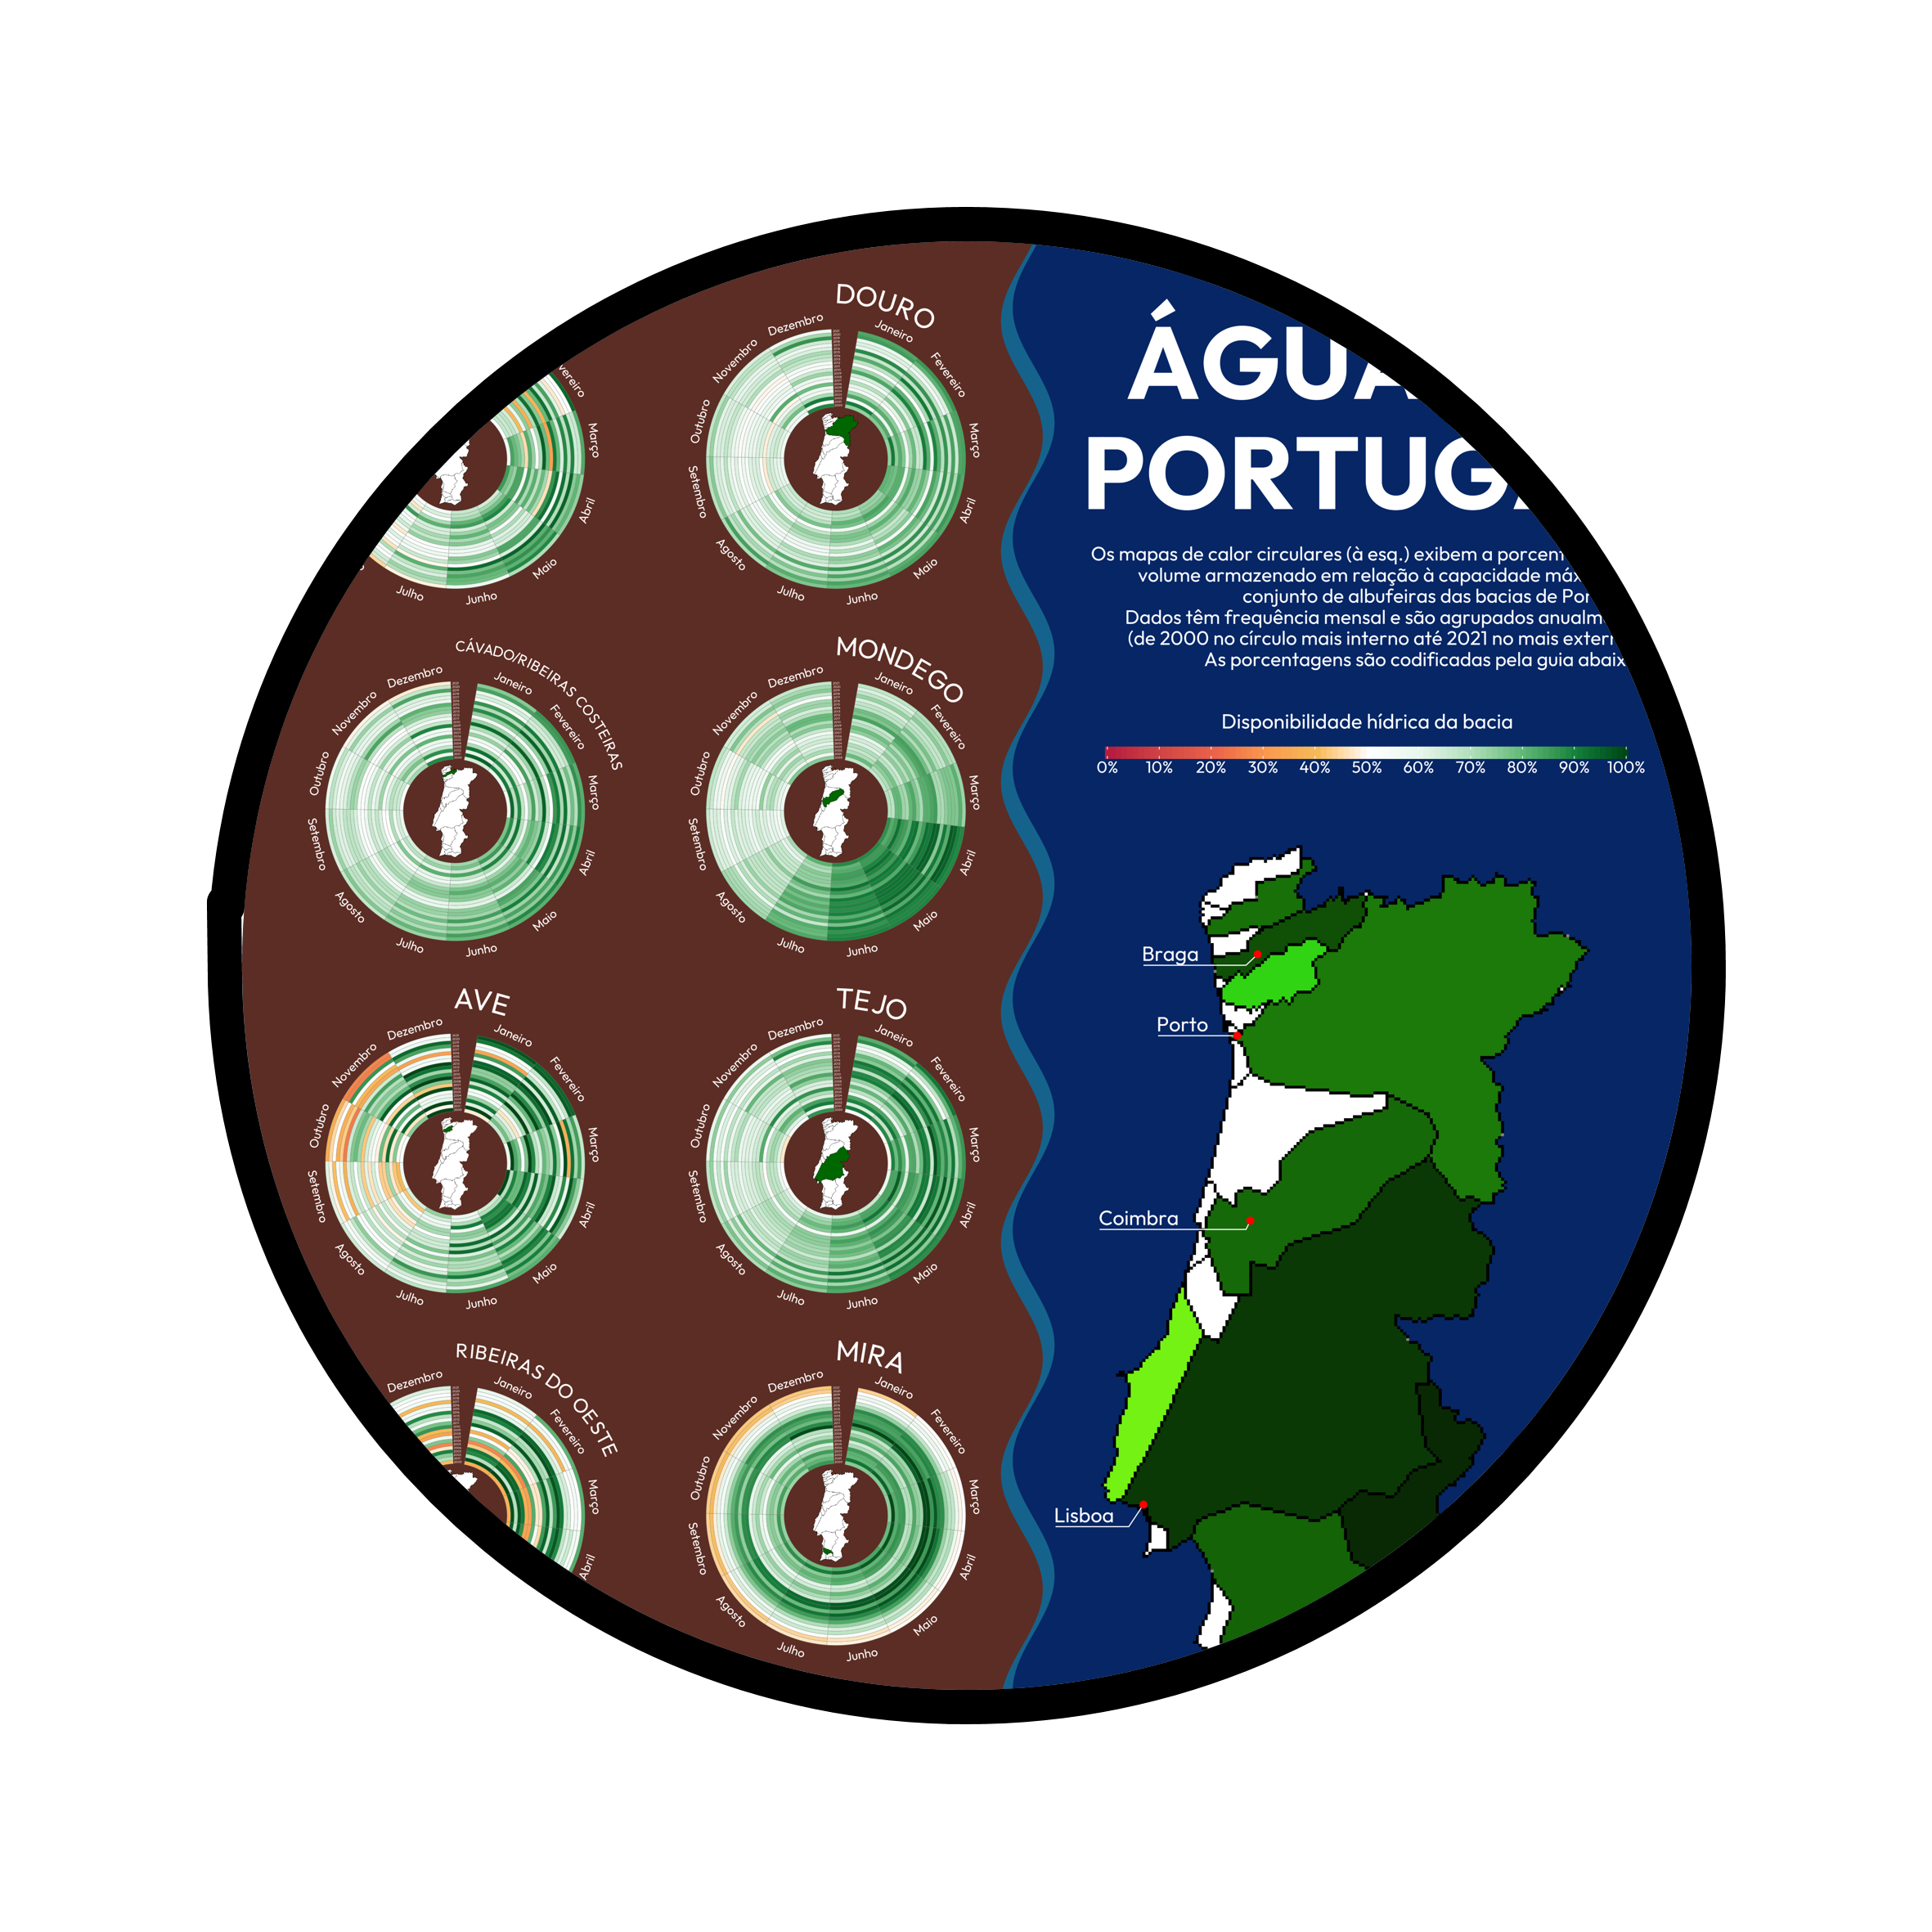
I was able to make more use of Figma and the {tmap} package in this one.
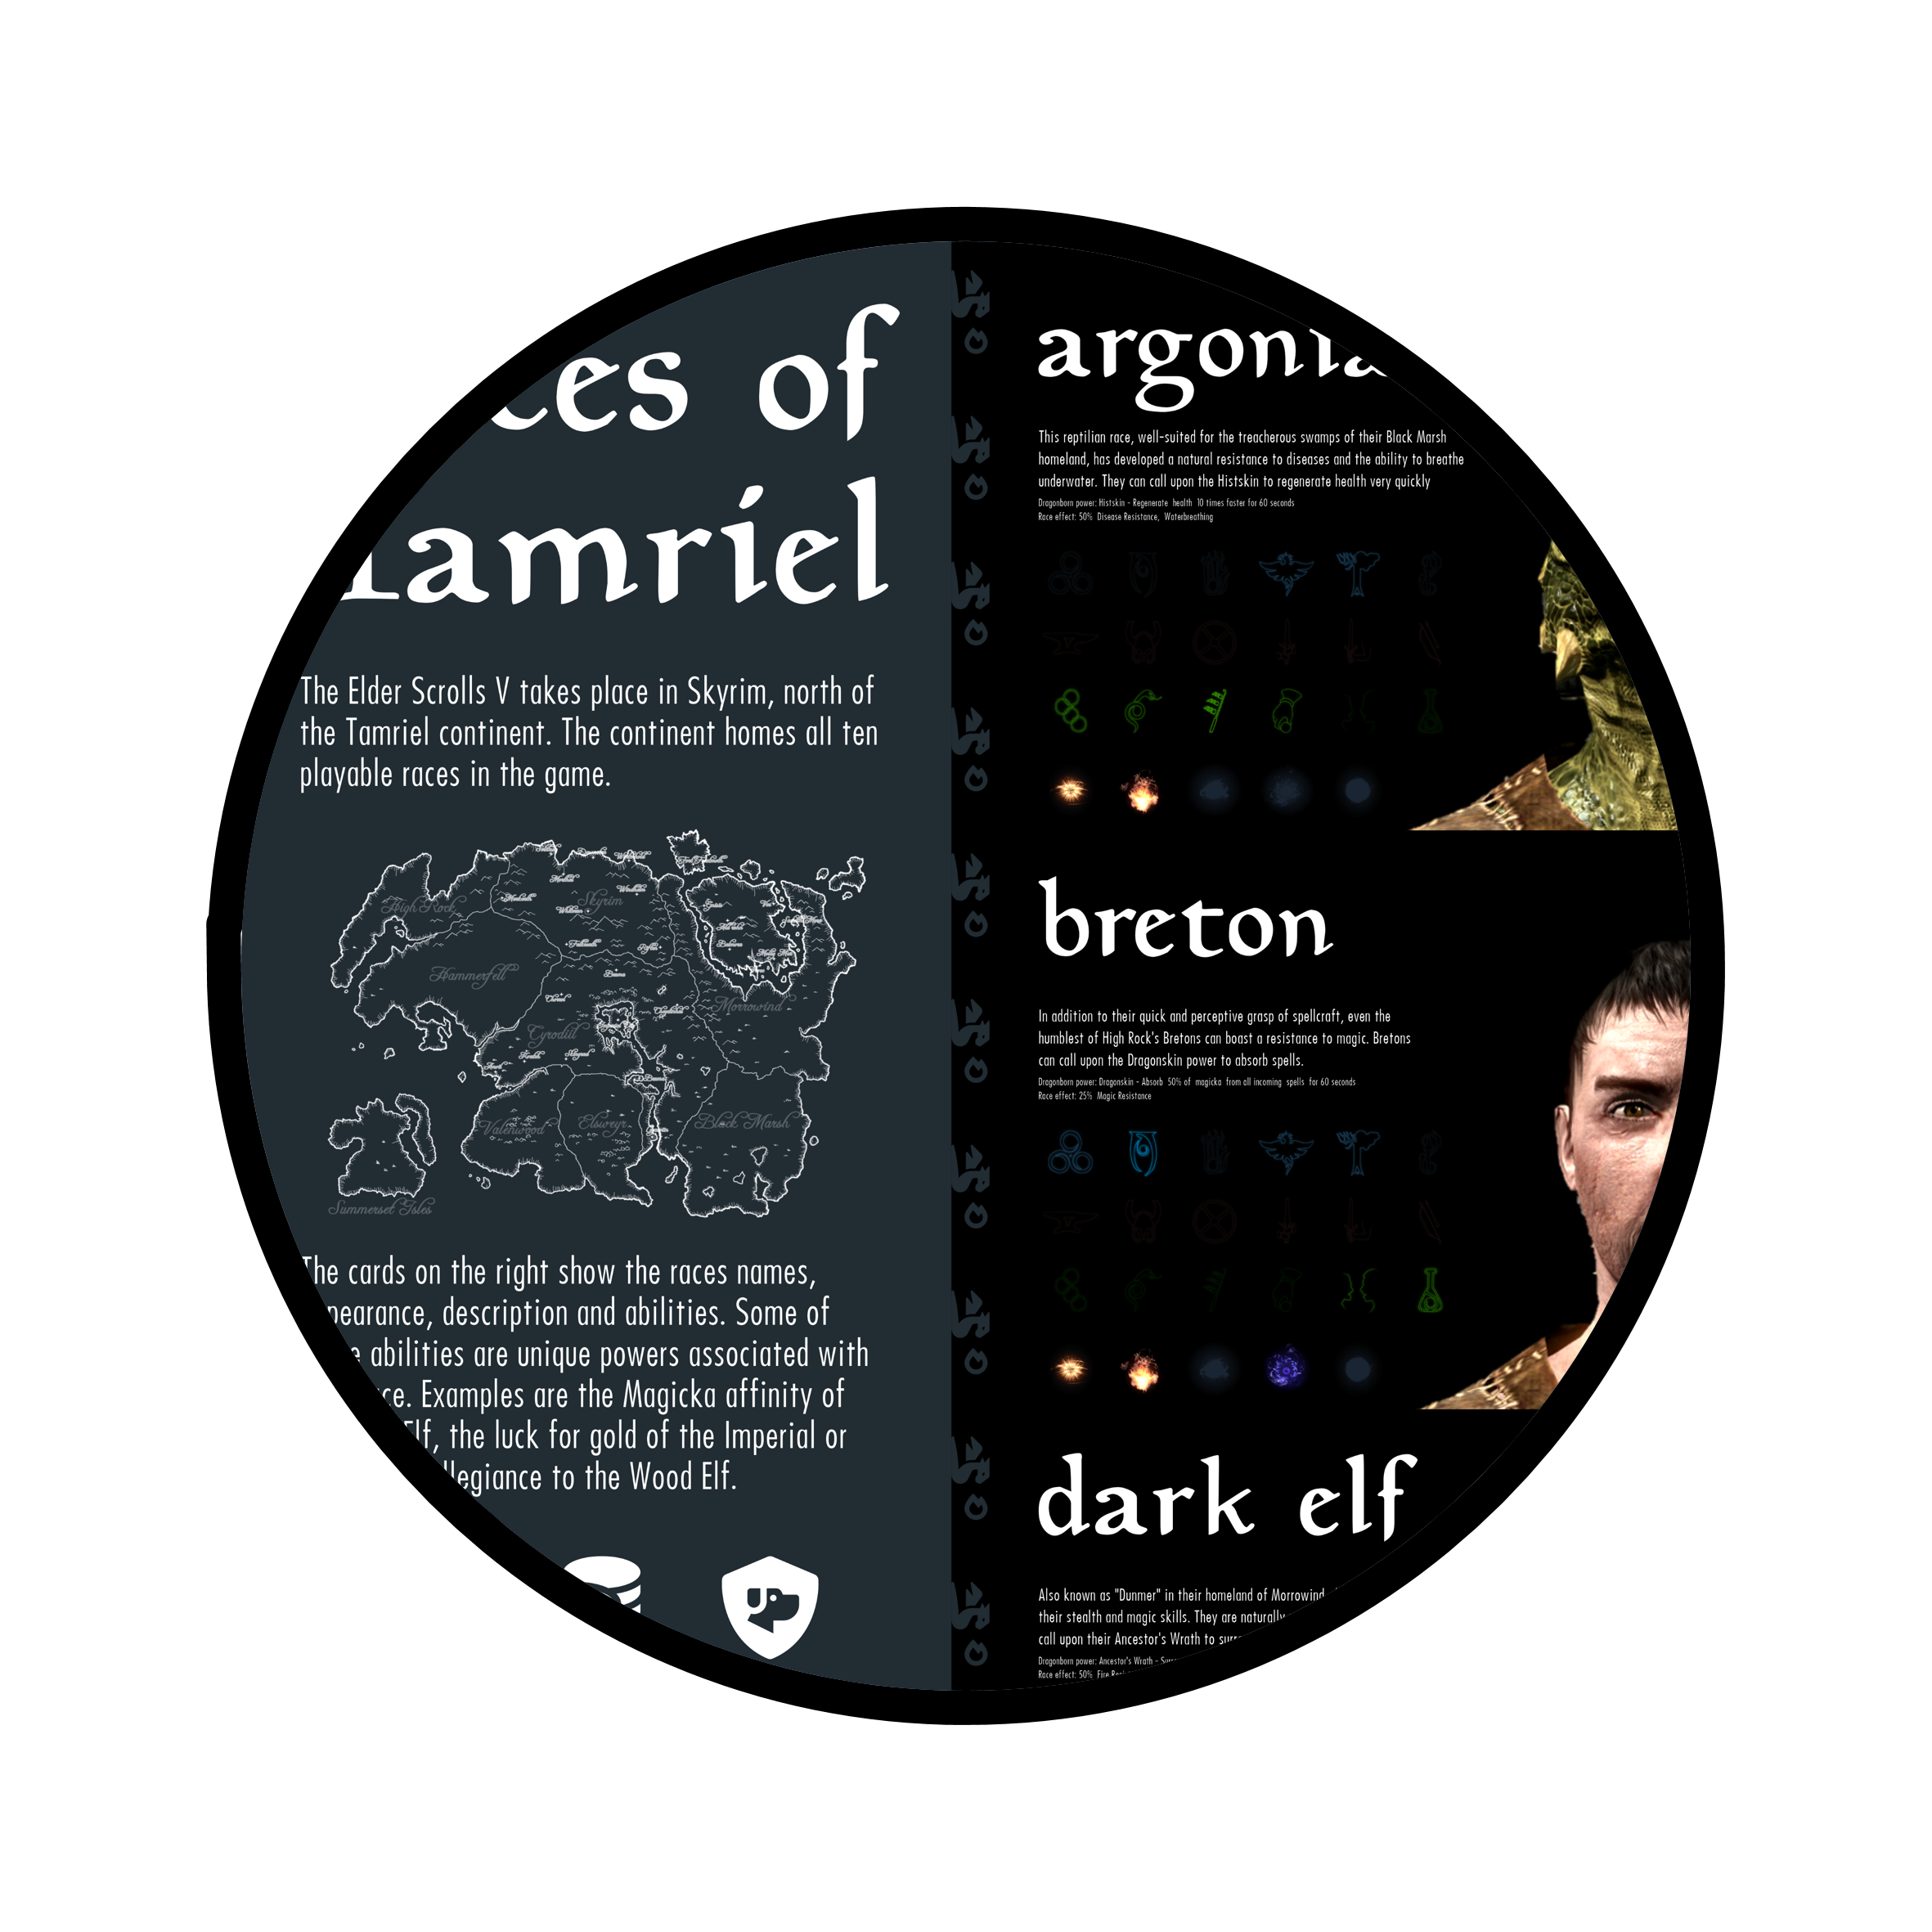
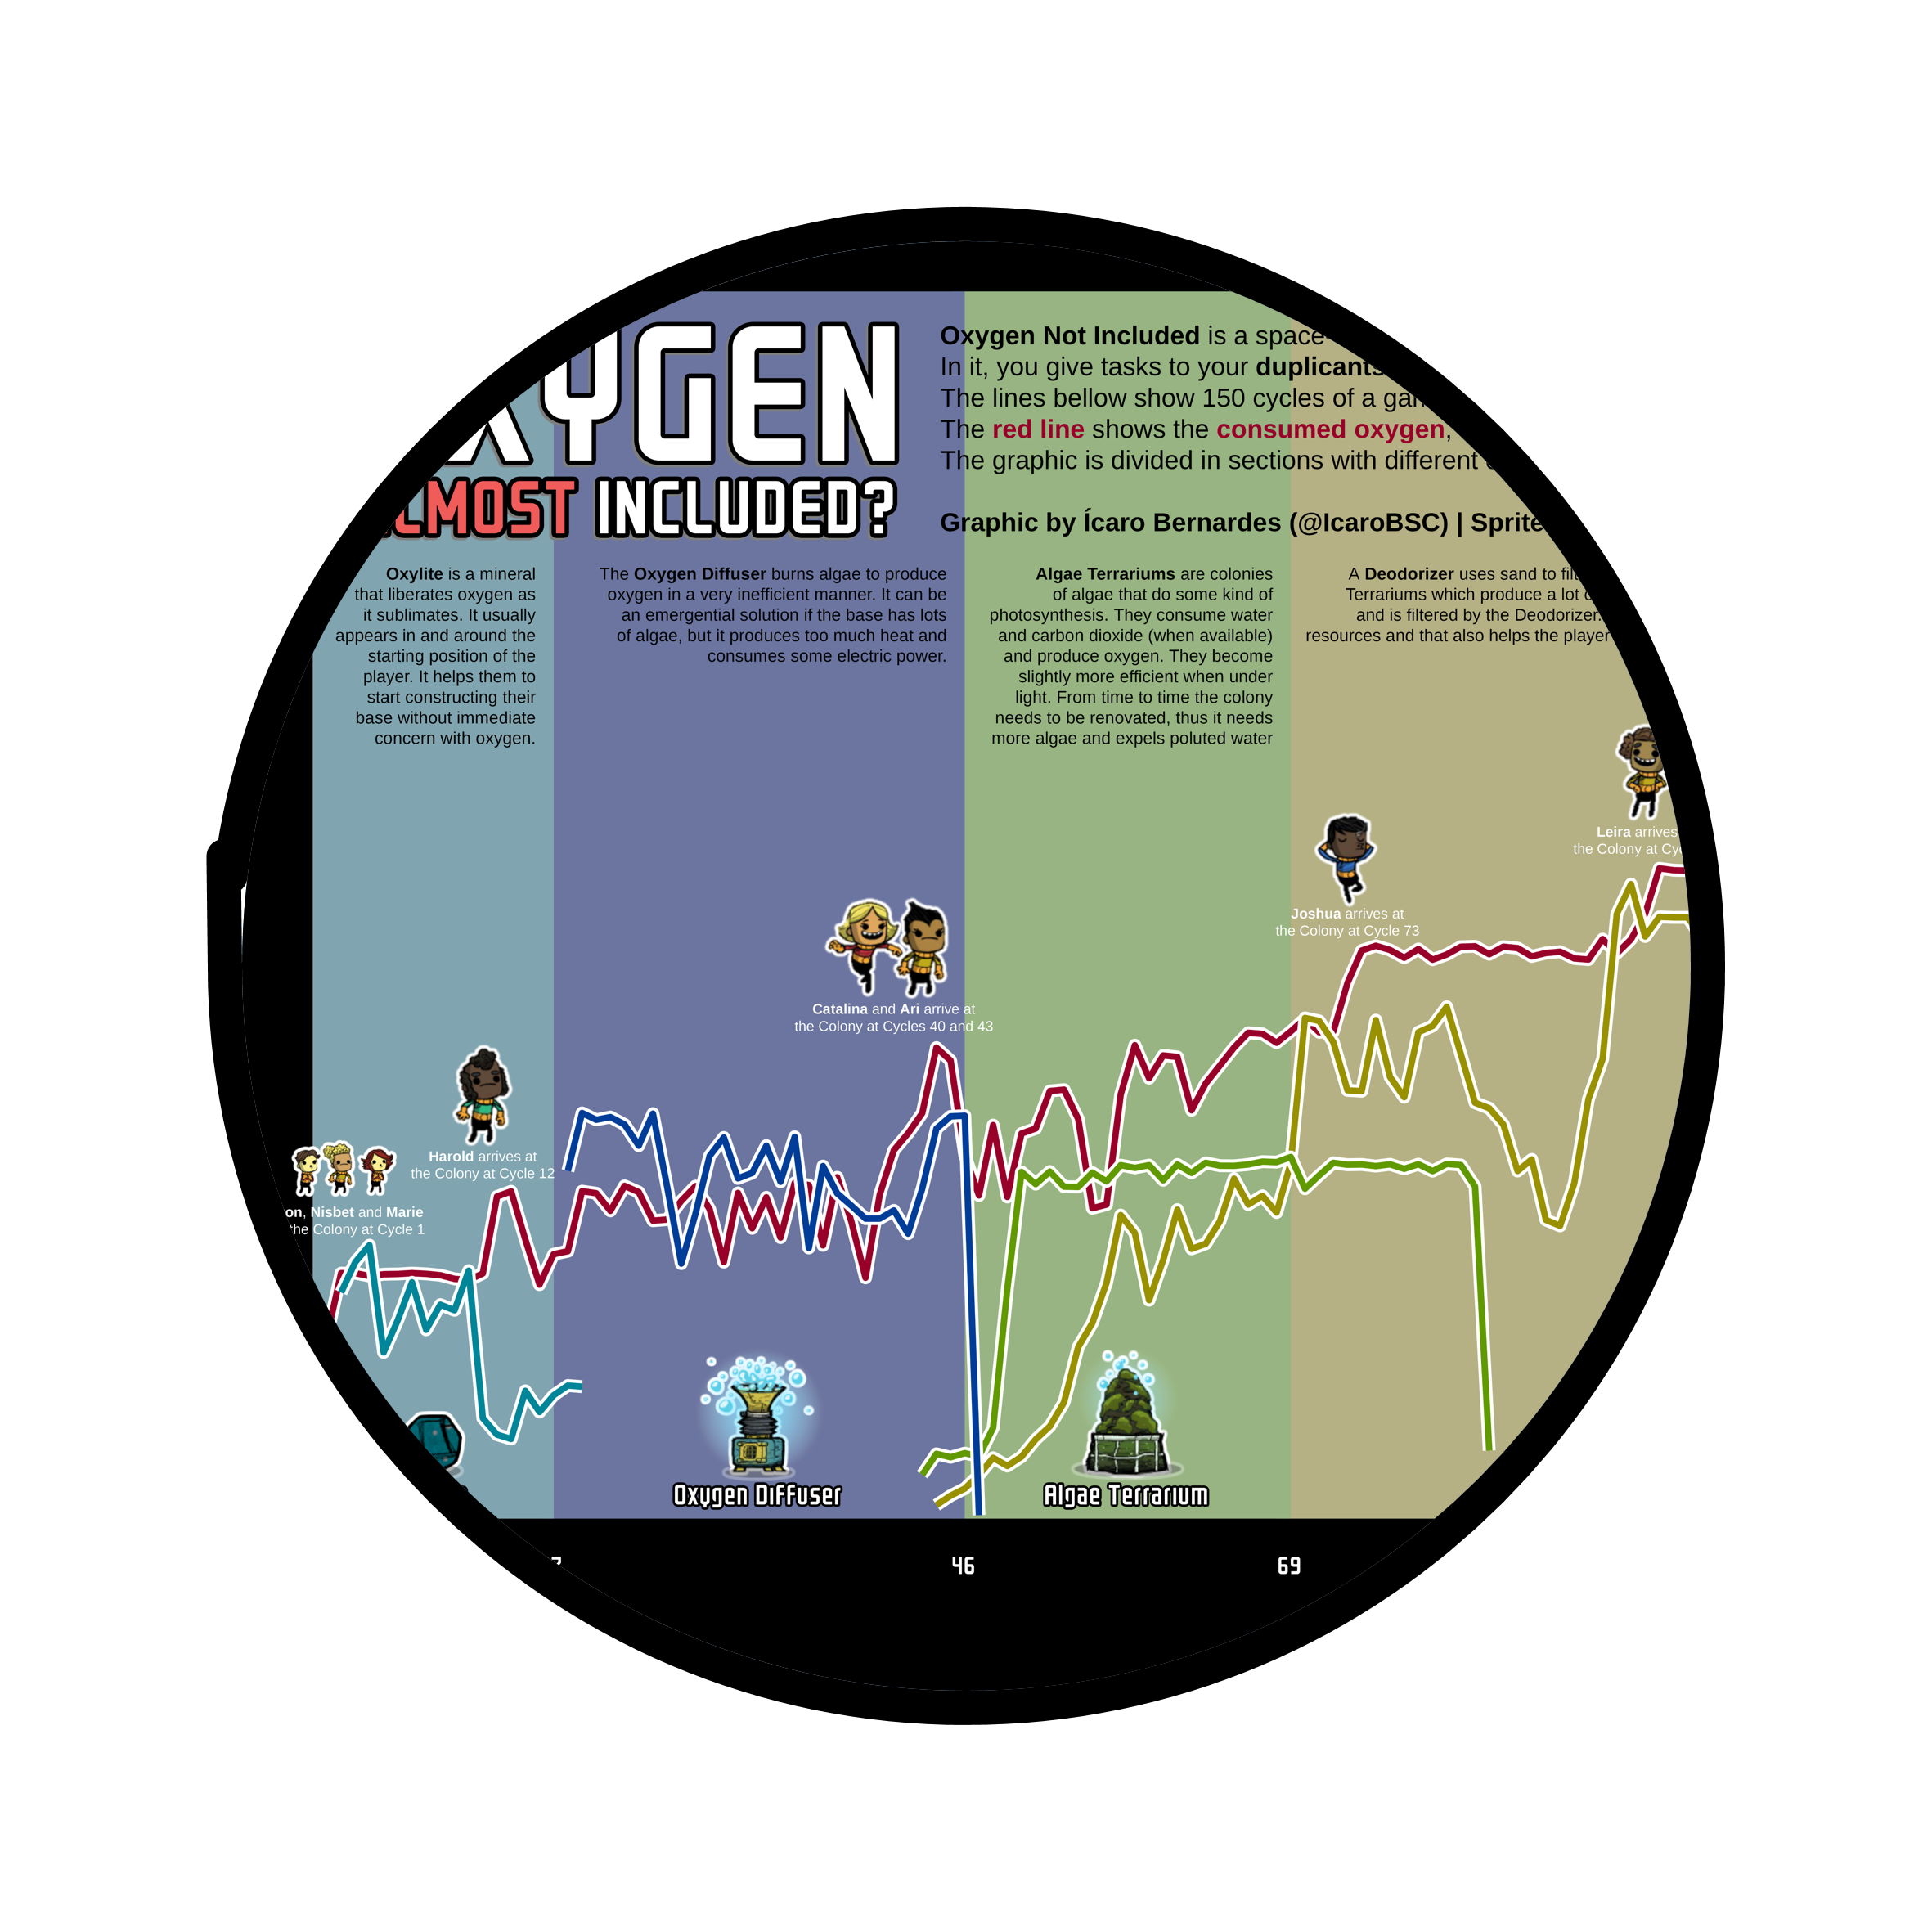
This is my space to jam. I love videogames a lot, so it's a joy to make dataviz works out of them.
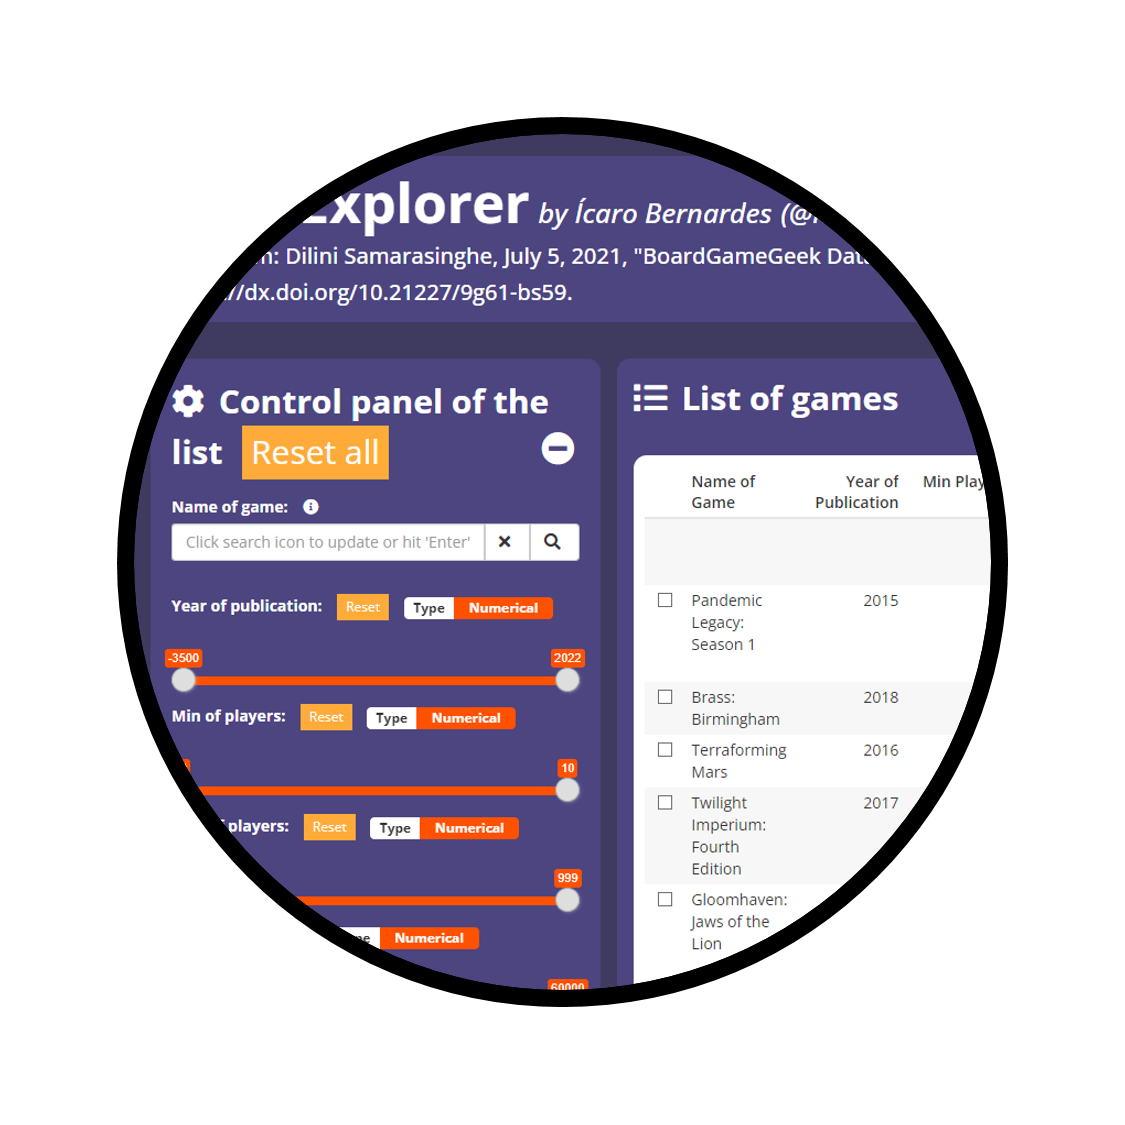
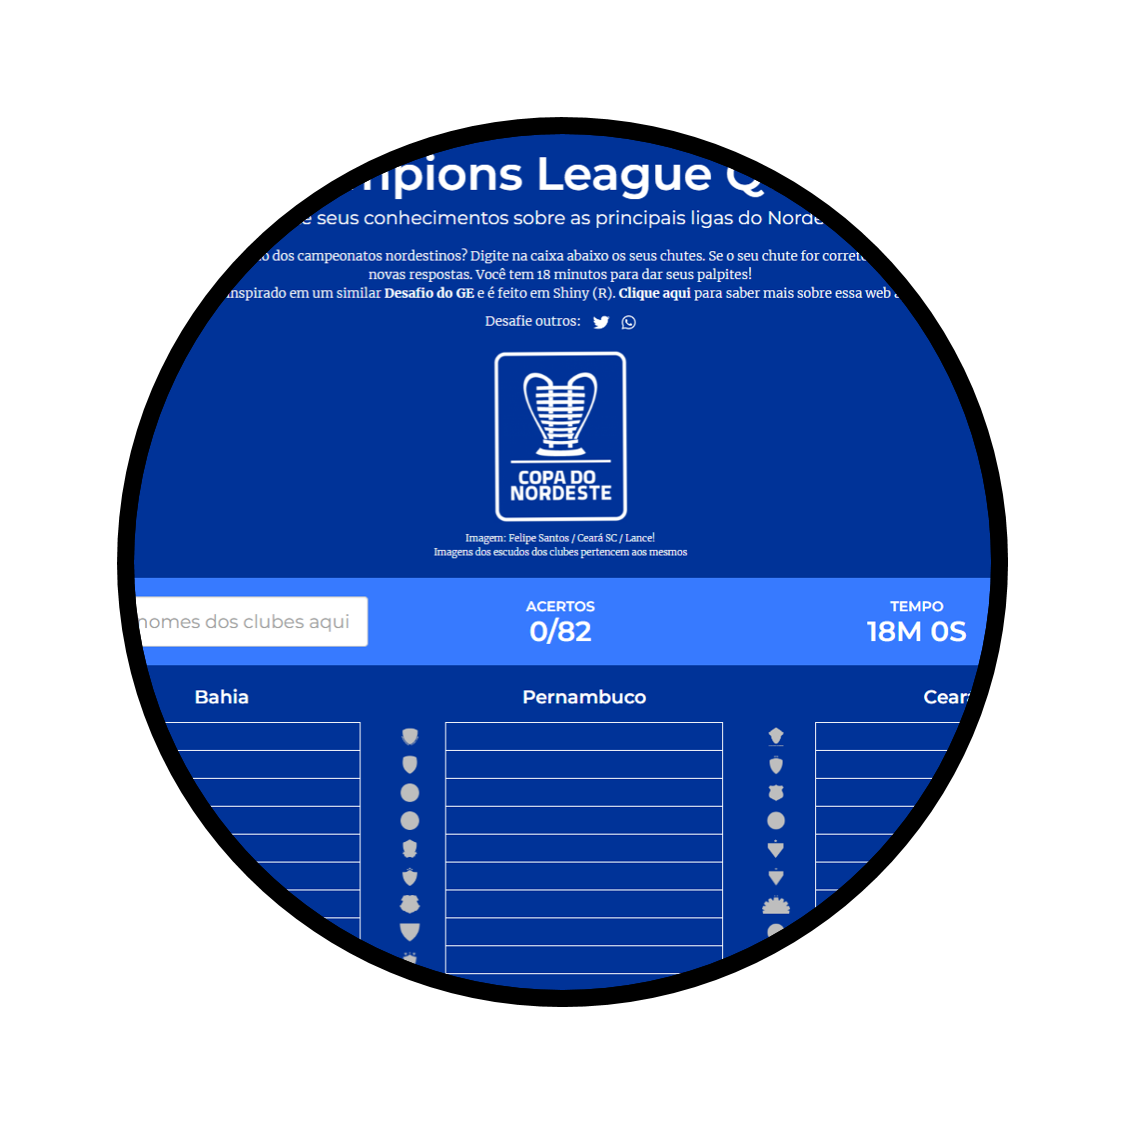
I made two simple apps to try some tricks. I made the BGG Explorer for the RStudio Table Contest of 2021. Since the UI and server have repetitive structures and logic I relied a lot on {purrr} to build them. The Lampions League Quiz is a timed quiz also built with lots of {purrr} and {shinyjs} as well.

{dubois} was the first R package I ever created. The idea was to allow users to produce Du Bois inspired posters like the ones I made for the DuBoisChallenge but with their own data. I created only one function, but stopped when I learned others had produced similar packages with less constraints. Currently, I am developing the {carnaval} package. It is an unique package that provides easy access to both datasets on the Carnaval parade competition and color palettes inspired by the carioca Samba Schools. The package focuses on the main league of the competition (“Grupo Especial”).
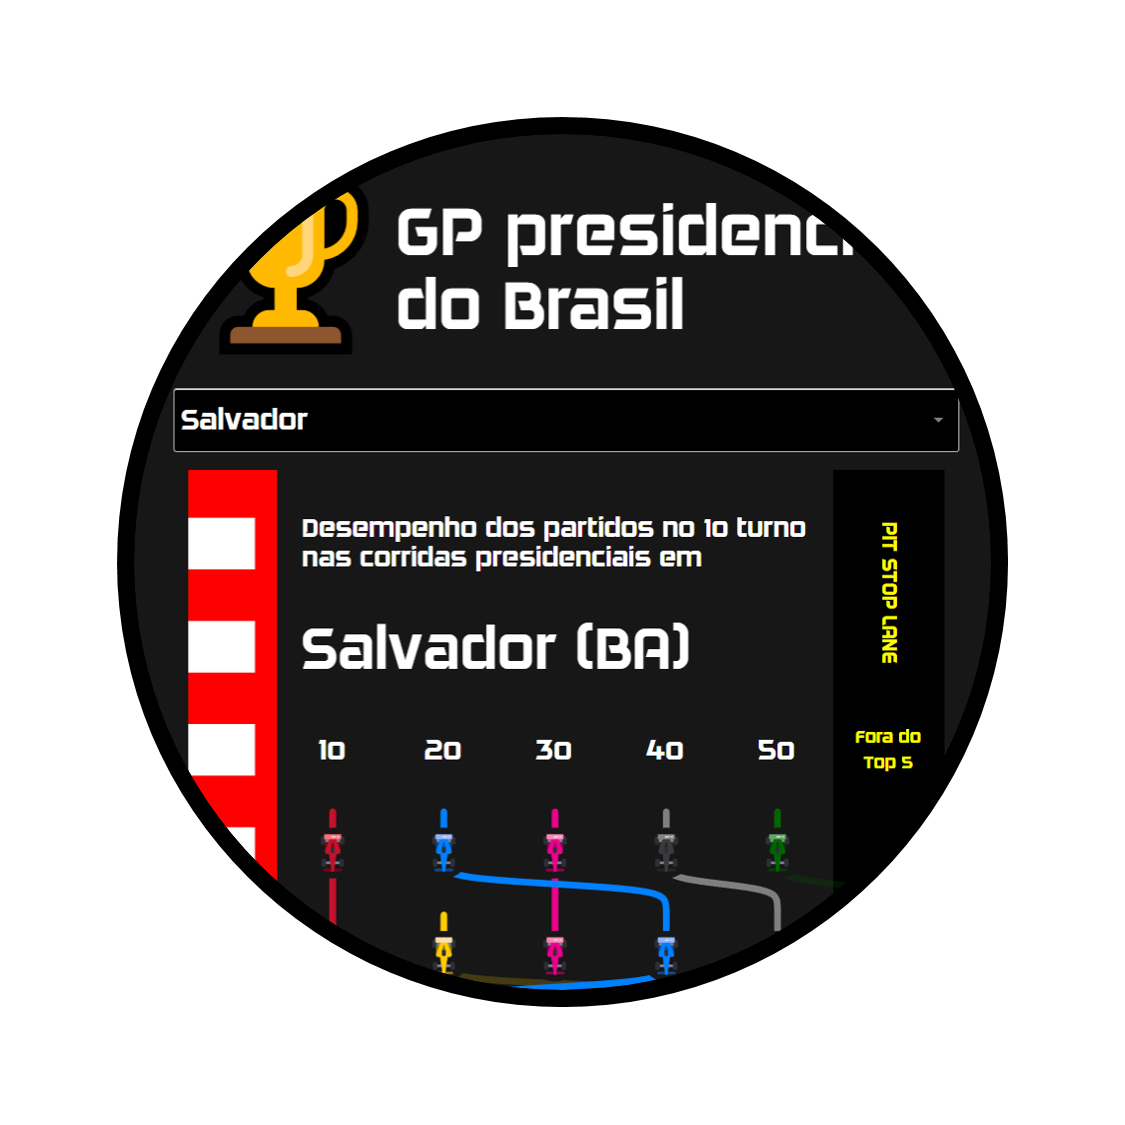
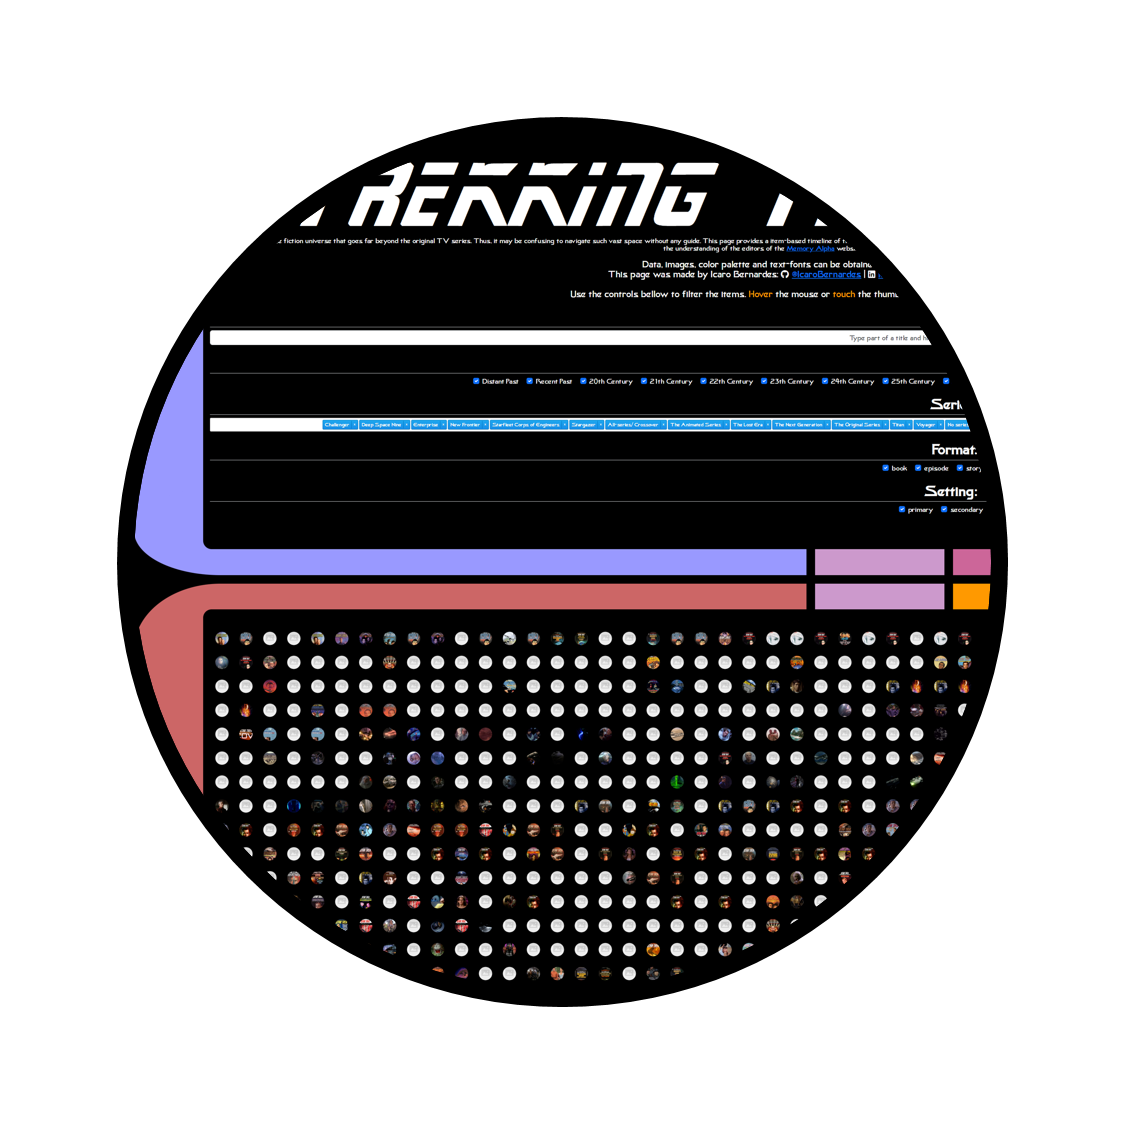
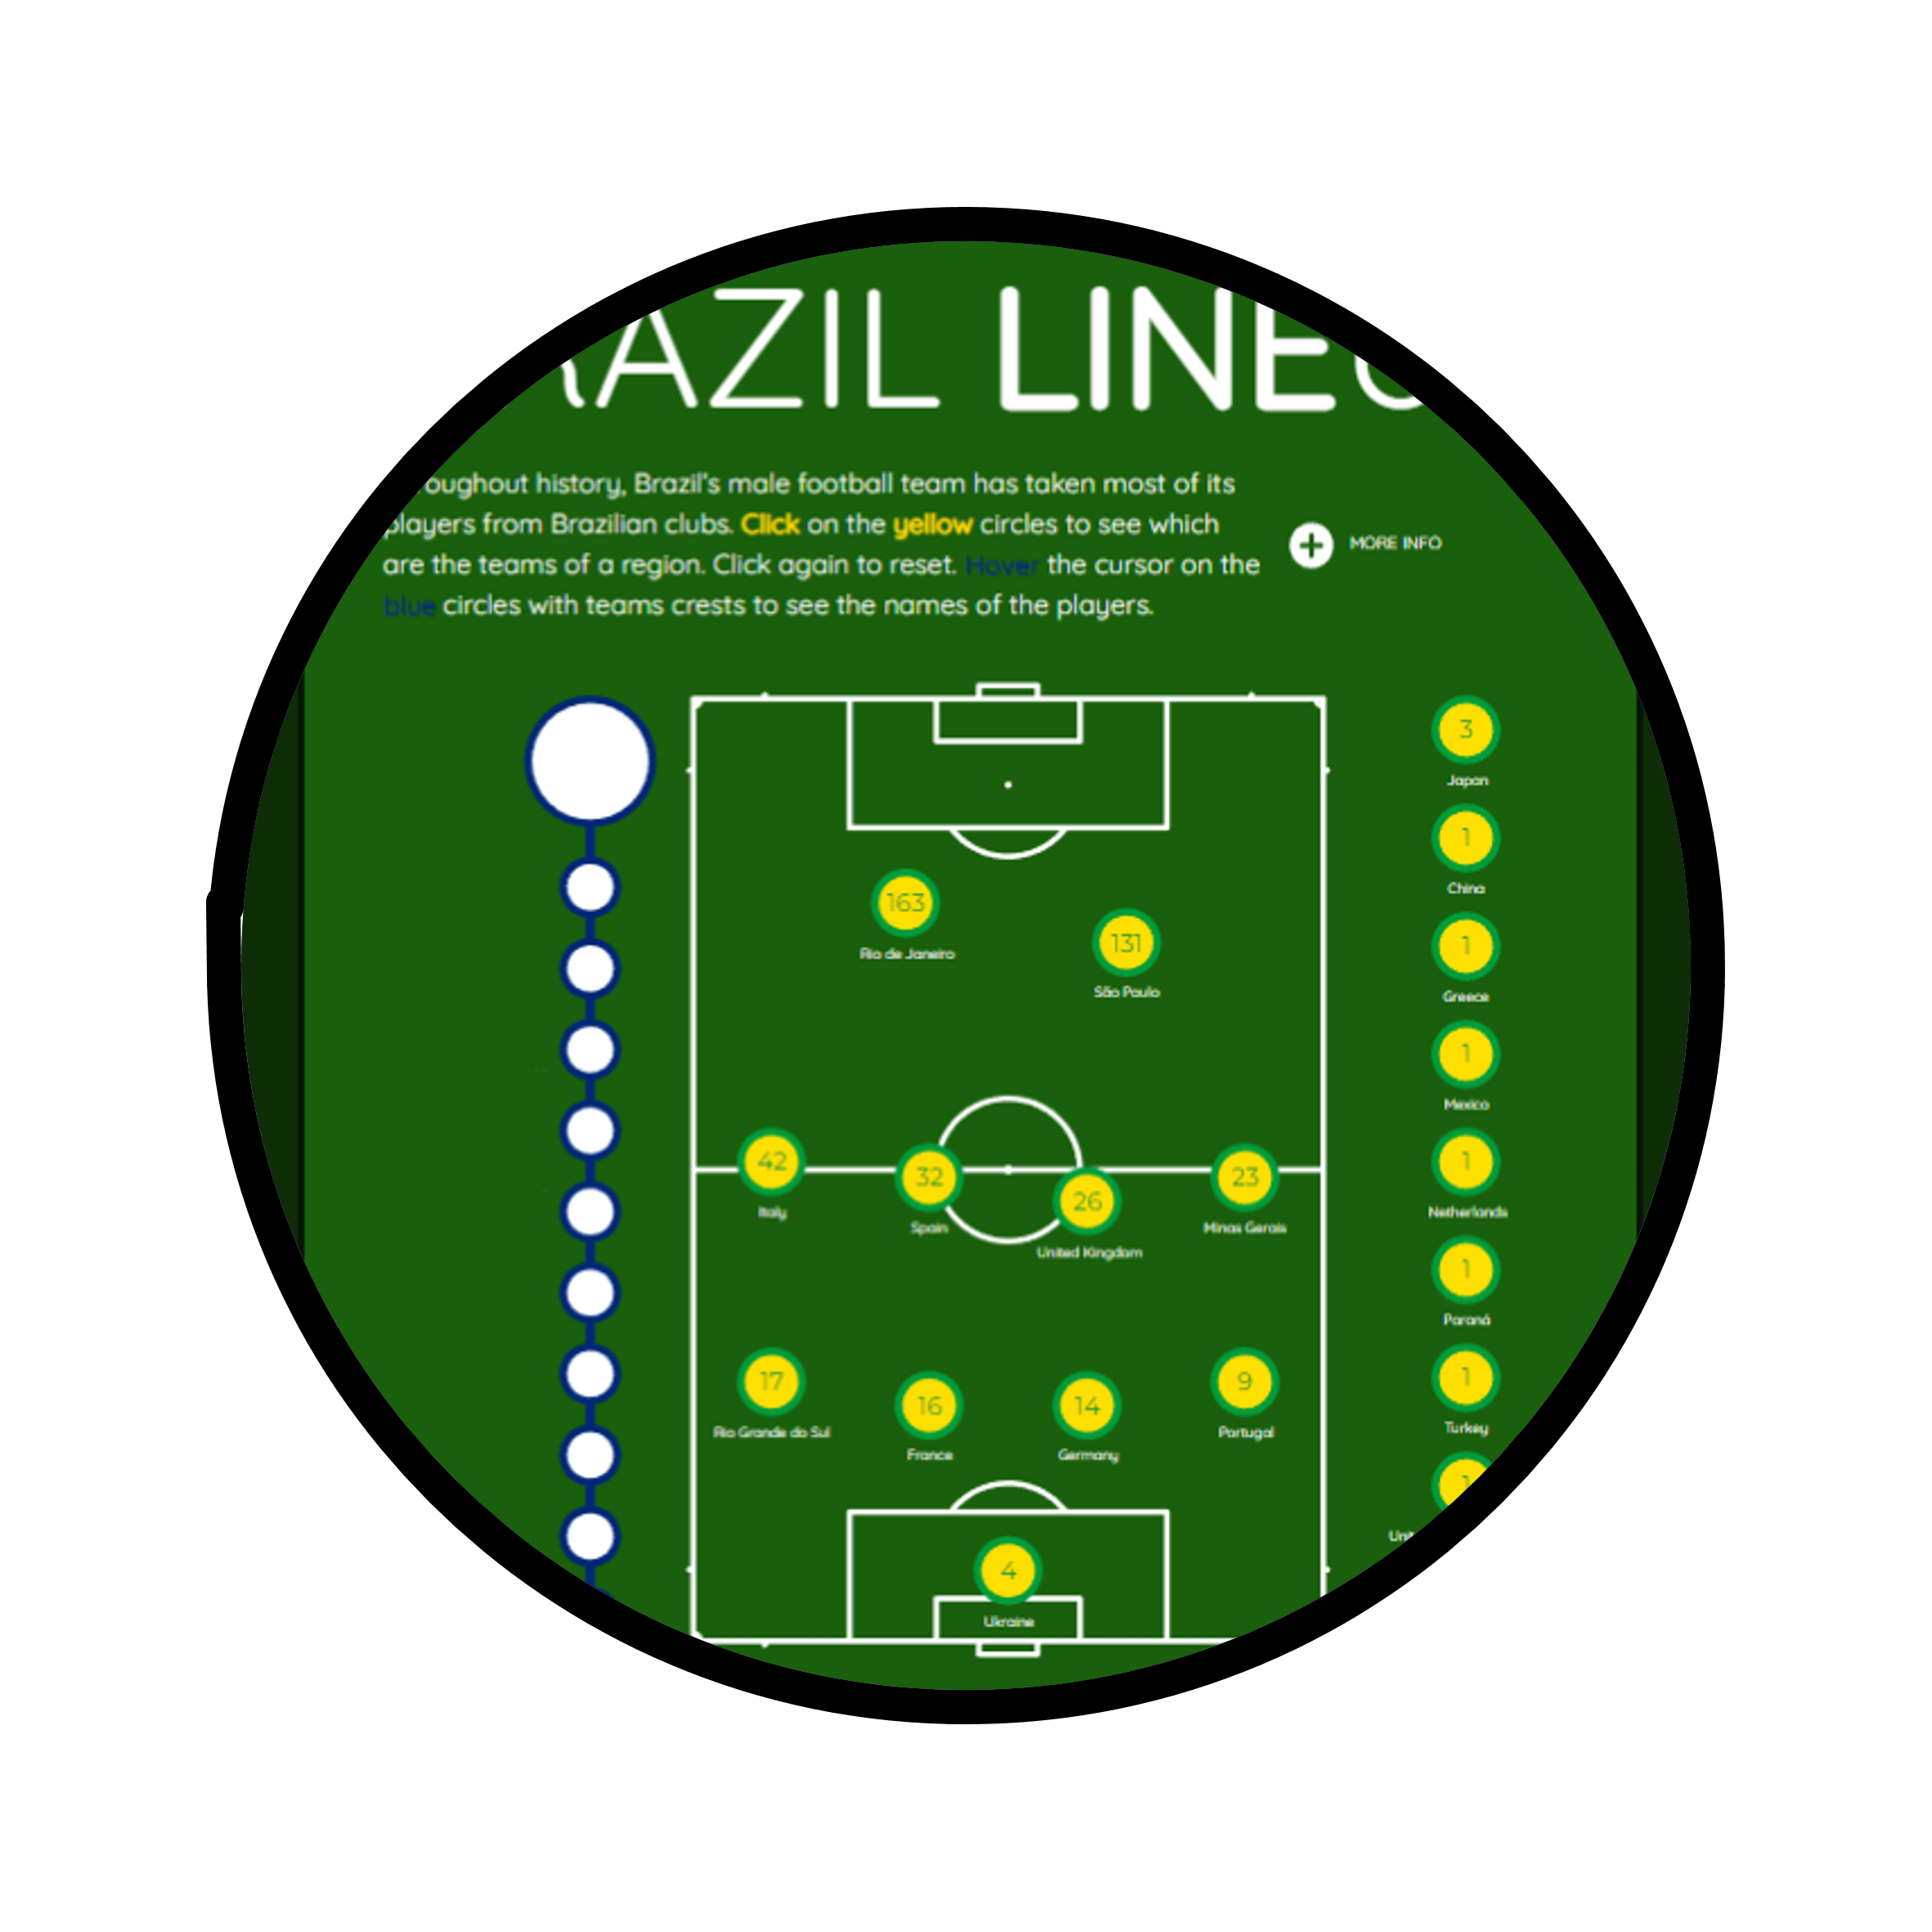
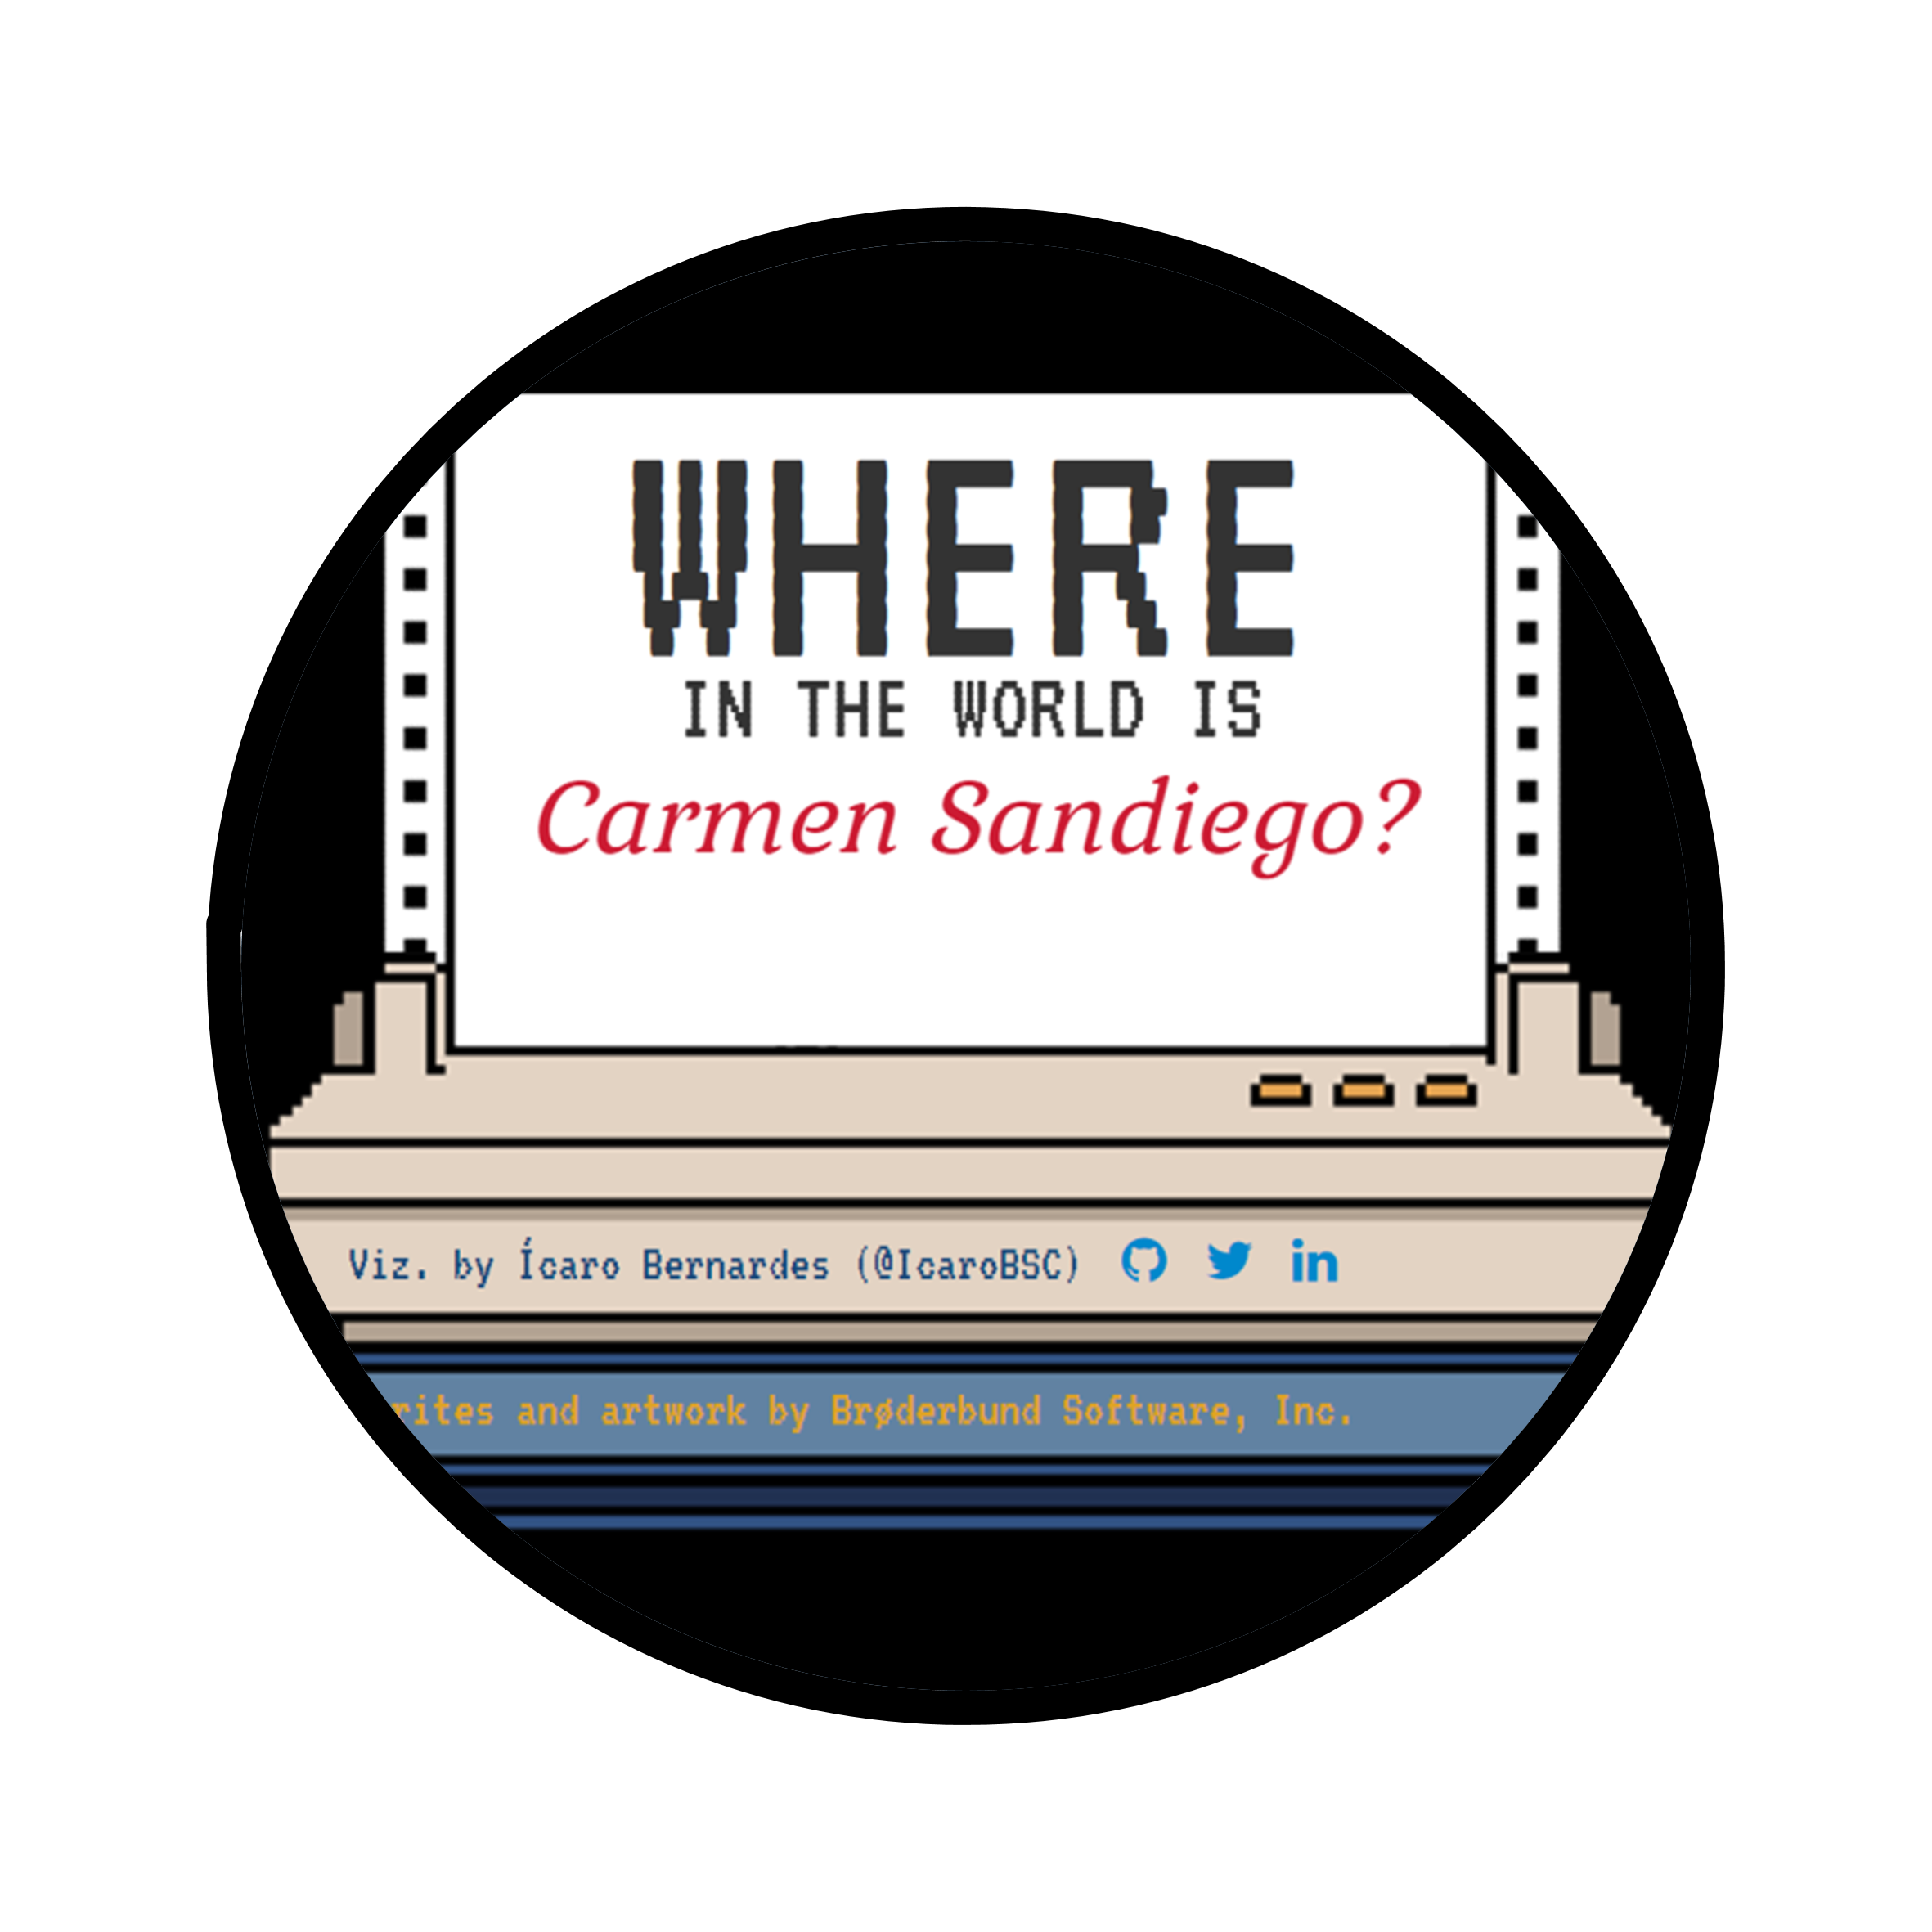
I created these pages because I want to be able of building interactive pieces without being constrained to shiny. All of them are hosted using GitHub Pages. The W.E.B. DuBois Gallery is the only page I made without R functions. It shows the works I made for the DuBoisChallenge and the originals that inspired them. The GP Presidencial do Brasil shows votes for president in the 10 biggest cities of each Brazilian state. It shows the interactive poster of the chosen city using an iframe. Trekking Time provides a item-based timeline of the events of the Star Trek universe. The server logic and tooltips are made with JS. Brazil Lineup and Where in the World is Carmen Sandiego? are pages that hold interactive works I made with {ggiraph}.

manchete is a project inspired on the News Homepages project. It takes screenshots of the digital versions of the main Brazilian newspapers and publishes them on Twitter (MancheteBot) and Telegram (Manchete). This bot was developed by Bruno Mioto and myself.
![]()
![]()
- 💬 I would love to talk about: Dataviz with ggplot2 and its extensions as well as data handling with tidyverse
- 📫 How to reach me: icaro@bitanalytics.dev.br
- 📄 Know about my experiences at my Linkedin profile
![]()
![]()
![]()
See more: