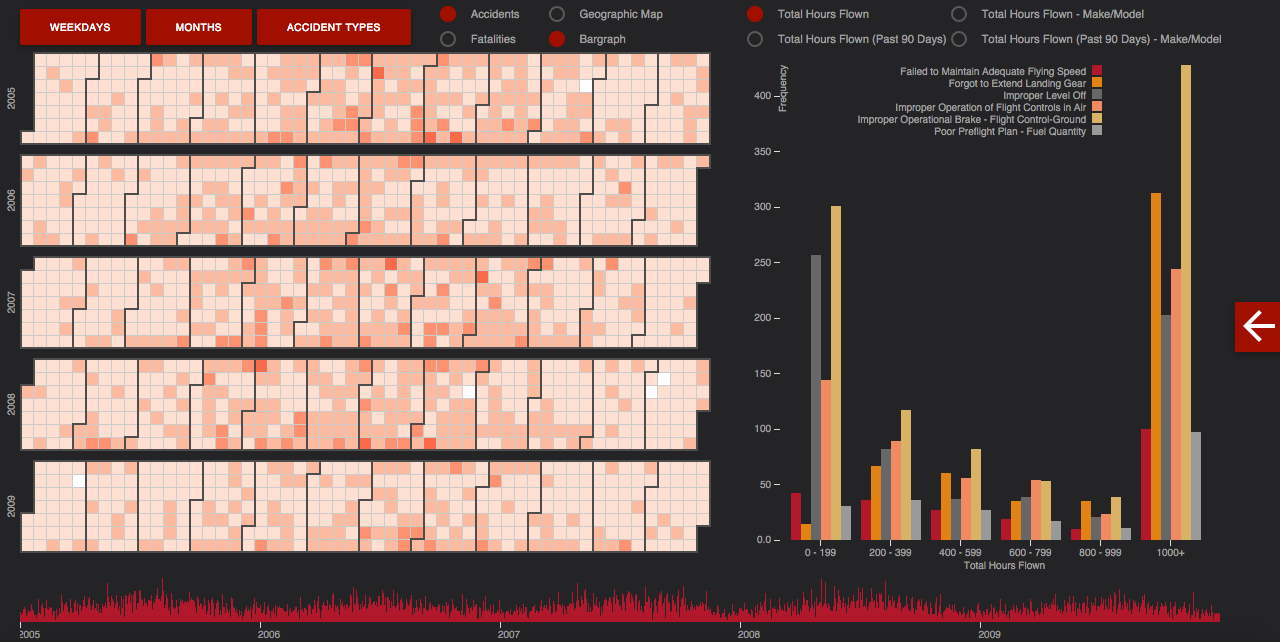
###Abstract The FAA does not dedicate much resources on analyzing accident data involving small, non-commercial aircraft. Potentially valuable findings are hidden beneath large quantities of accident data, with no viable way to parse and extrapolate said data. We present MAYDAY, a visual tool aimed to alleviate this difficulty by culling the comparatively irrelevant data and displaying the relevant information in an easily accessible visual format. We focus on presenting an overall calendar heatmap displaying frequency of accidents in 5-year ranges and several more selective side components to depict relationships within the data. Thus, temporal trends and previously uninvestigated correlational relationships will become far more readily observable to domain users and researchers. Within this visualization dashboard, we demonstrate our approach to determining which attributes are most relevant to domain researches, as well as our decisions of the final visual interface.
###Raw Data The raw data can be obtained from the FAA's incident/accident database, which is linked on the homepage of the demo. The data is in a .csv format and located inside the public/data directory.
###Running Locally Install Node.js on the local machine, clone the repository, and execute the following command:
npm start
###Live demo Visit the visualization's demo
###Final Proposal Visit the final documentation
###Video Visit the demonstration
