VisualMSI is a tool to detect and visualize microsatellite status from NGS data, by simulating the PCR behavior. VisualMSI extracts the PCR adapters from the reference genome, and tries to map them to the sequencing reads. If the adapters are successfully mapped to a read/pair, its inserted length enbraced by the adapter will be calculated. VisualMSI performs statistics based on the inserted length distribution. This method is very similar as the PCR-based MSI detection method, which is usually considered as the golden standard method for clinical usage.
For each MSI target locus, VisualMSI computes the information entropy of its inserted length distribution. The information entropy value is a indicator for the MSI status, the higher the information entropy is, the higher the probility that this MSI locus is instable.
VisualMSI can run in tumor-normal paired mode or case-only mode, and the tumor-normal mode is suggested if the paired normal sample is available. If the paired normal sample is given, VisualMSI will evaluate the earth mover's distance (EMD) between the distributions of tumor data or normal data. Since the normal data is usually considered as MSI-stable, the EMD value indicates how instable the tumor data is when comparing to the normal data. The higher the EMD value is, the higher probility that this MSI locus is instable.
- Sample HTML report: http://opengene.org/VisualMSI/msi.html
- Sample JSON report: http://opengene.org/VisualMSI/msi.json
- Sample TEXT report: http://opengene.org/VisualMSI/msi.txt
- Dataset for testing: http://opengene.org/VisualMSI/tumor.sorted.bam and http://opengene.org/VisualMSI/normal.sorted.bam
- Tumor-normal paired mode:
visualmsi -i tumor.sorted.bam -n normal.sorted.bam -r hg19.fasta -t targets/msi.tsv- Case-only mode (no paired normal data given):
visualmsi -i tumor.sorted.bam -r hg19.fasta -t targets/msi.tsvThis binary is only for Linux systems, http://opengene.org/VisualMSI/visualmsi
# this binary was compiled on CentOS, and tested on CentOS/Ubuntu
wget http://opengene.org/VisualMSI/visualmsi
chmod a+x ./visualmsi# step 1: download and compile htslib from: https://github.com/samtools/htslib
# step 2: get VisualMSI source (you can also use browser to download from master or releases)
git clone https://github.com/OpenGene/VisualMSI.git
# build
cd VisualMSI
make
# Install
sudo make installYou should provide following arguments to run visualmsi
- the reference genome fasta file, specified by
-ror--ref= - the target setting file, specified by
-tor--target= - the input BAM file, specified by
-ior--in=. If the normal data is available, specify it by-nor--normal= - the plain text result is directly printed to STDOUT, you can pipe it to a file using a
>
The reference genome should be a single whole FASTA file containg all chromosome data. This file shouldn't be compressed. For human data, typicall hg19/GRch37 or hg38/GRch38 assembly is used, which can be downloaded from following sites:
hg19/GRch37: ftp://ftp.ncbi.nlm.nih.gov/sra/reports/Assembly/GRCh37-HG19_Broad_variant/Homo_sapiens_assembly19.fastahg38/GRch38: http://hgdownload.cse.ucsc.edu/goldenPath/hg38/bigZips/hg38.fa.gz Remember to decompress hg38.fa.gz since it is gzipped and is not supported currently.
The target file is a TSV (tab-separated values) file giving the MSI locuses. To add a MSI target locus at chr:position, you can add a row with values (chrom, position, name). You can see the example from targets/msi.tsv:
#CHROM  POSITION  NAME
chr4  55598216  BAT25
chr2  47641568  BAT26
chr14 23652365  NR-21
chr11 102193518 NR-27
chr2  95849372  NR-24
Please note that this file is based on hg19 coordination.
VisualMSI reports results in HTML/JSON/TEXT formats, you can take a look at following examples:
- Sample HTML report: http://opengene.org/VisualMSI/msi.html
- Sample JSON report: http://opengene.org/VisualMSI/msi.json
- Sample TEXT report: http://opengene.org/VisualMSI/msi.txt
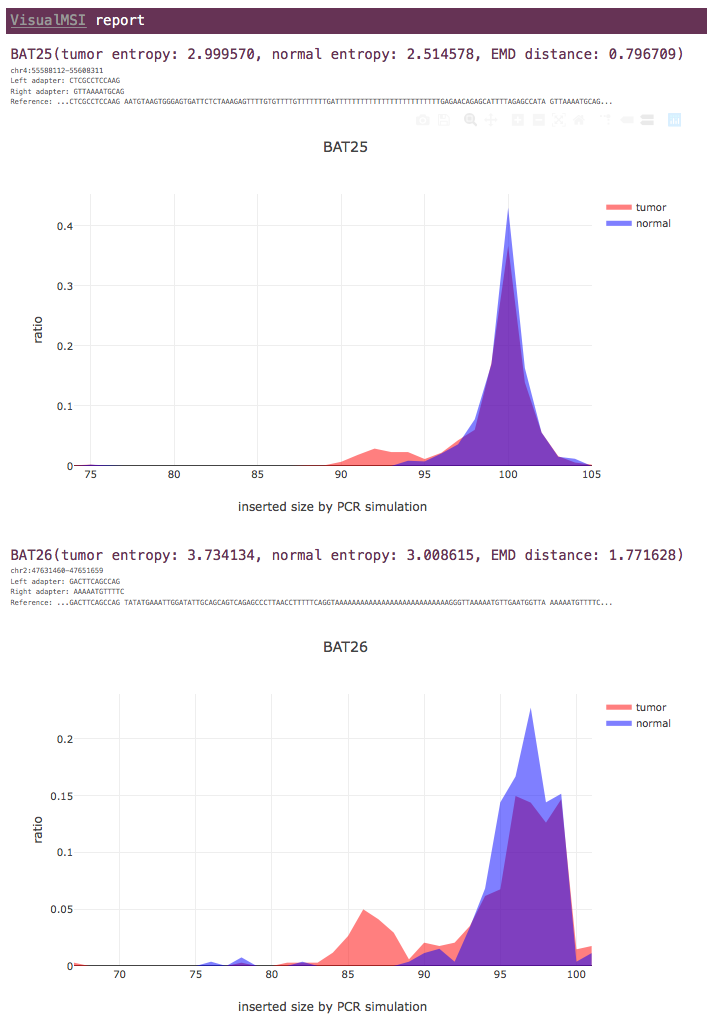
For each MSI locus, the entropy values of tumor and normal data are shown, as well as the earth mover's distance (EMD) value.
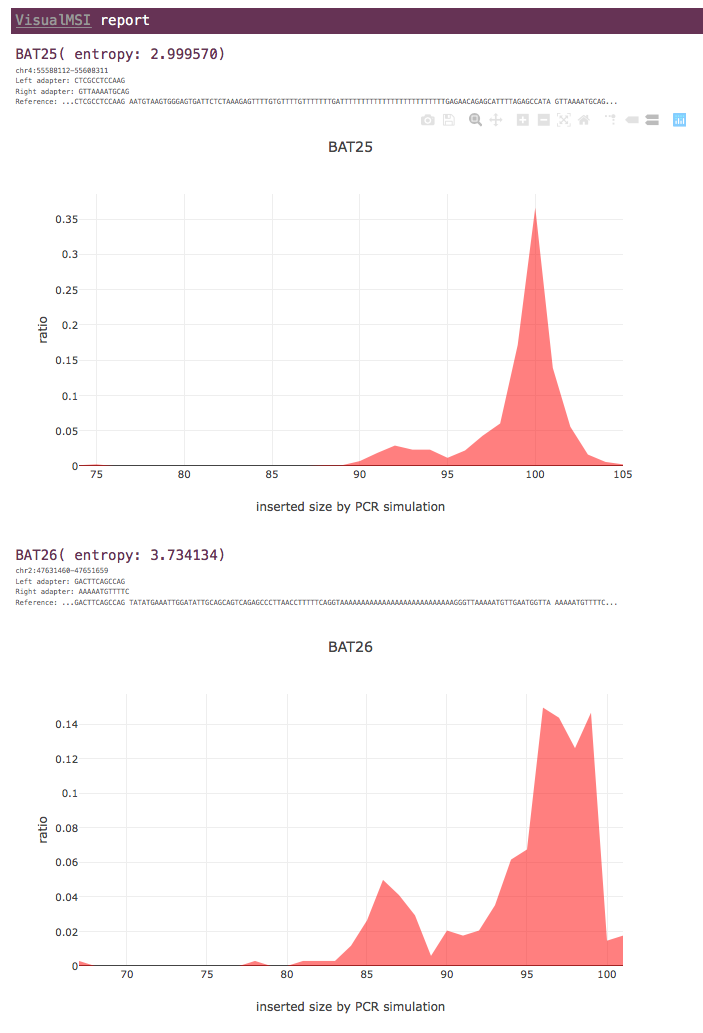
For each MSI locus, only the entropy value of tumor data is shown.
Please cite VisualMSI as following:
Chen, S., Qu, H., Yang, B., Huang, T., Zhang, X., Liu, Y., ... & Gu, J. (2019). Detect and visualize tumor microsatellite instability status from next-generation sequencing data by simulating PCR techniques. Journal of Clinical Oncology 37, no. 15_suppl.e13052
options:
  -i, --in                     input sorted bam/sam file for the case (tumor) sample. STDIN will be read from if it's not specified (string [=-])
  -n, --normal                 input sorted bam/sam file for the paired normal sample (tumor-normal mode). If not specified, VisualMSI will run in case-only mode. (string [=])
  -t, --target                 the TSV file (chr, start, end, name) to give the MSI targets (string)
  -r, --ref                    reference fasta file name (should be an uncompressed .fa/.fasta file) (string)

  # options for setting thresholds
  -a, --adapter_len            set the length of the adapter for PCR simulation (5~30). Default 12 means the left and right adapter both have 12 bp. (int [=12])
  -l, --target_inserted_len    set the distance on reference of the two adapters for PCR simulation (20~200). Default 100 means: <left adapter><100 bp inserted><right adapter> (int [=100])
  -d, --depth_req              set the minimum depth requirement for each MSI locus (1~1000). Default 10 means 10 supporting reads/pairs are required. (int [=10])

  # options for specifying the file names of the reports
  -j, --json                   the json format report file name (string [=msi.json])
  -h, --html                   the html format report file name (string [=msi.html])

  # other options
      --debug                  output some debug information to STDERR.
  -?, --help                   print this message