liveplot is a system for minimal hassle, on-the-fly, dataset visualization in python. If you want maximum customizability, or plot types other than line plots and image plots, look elsewhere. But if you just want to see your data as it comes in to your script, with minimal effort, and without the possibility of graphics bugs crashing your script, this might be for you.
Liveplot works in two processes, one of which is a pyqt application hosting the window, the other is your script, which sends data to the window over a named pipe. The intended workflow is to open the window once (per session) and keep it open, rather than restarting it for every run of the script. Ideally, multiple scripts can communicate with the same window, and data remains available in the window until it is overwritten.
pyqtgraph will be installed automatically from PyPI if not found
Install from PyPI
pip install liveplot
or from the source directory
python setup.py install
and start the window
python -m liveplot
on windows, if you have py2exe, build the executable
python setup.py
which should produce dist/liveplot.exe
If the window has been successfully started, open a client and plot
from liveplot import LivePlotClient
import numpy as np
plotter = LivePlotClient()
xs = np.linspace(0, 10, 100)
plotter.plot_xy('my test data', xs, np.sin(xs))
Individual plots are specified by their name, which can be any unique string. Attempting to create two different types of plot with the same name is currently an error. See more examples with the test suite,
python liveplot_test.py
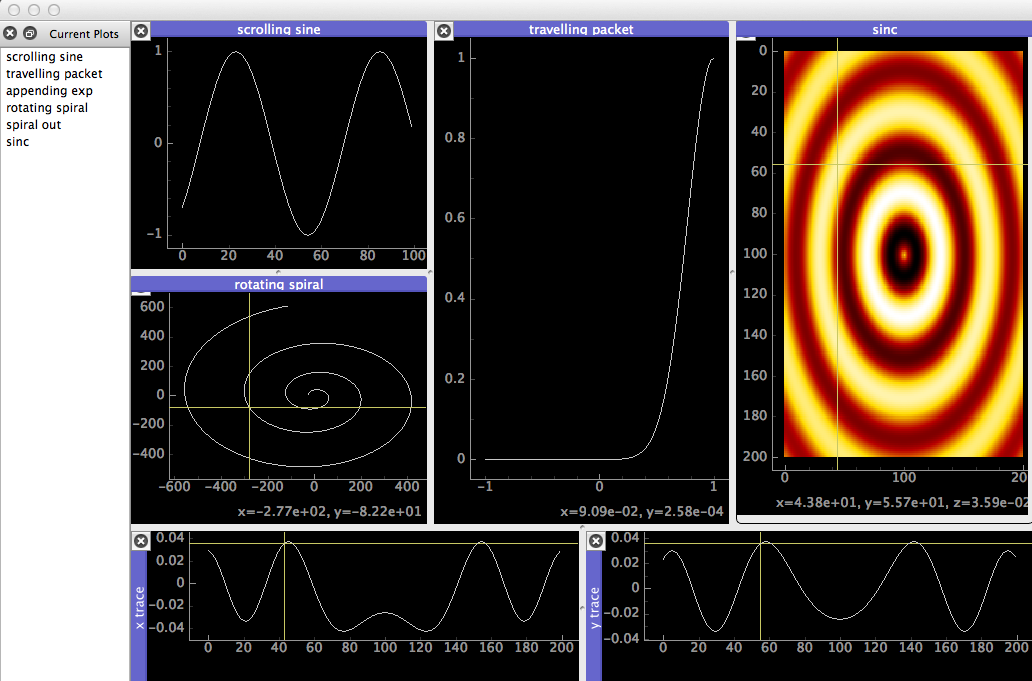
Several methods of plotting are supported, including cumulative, parametric, and 2D-Image.
By default Macs restrict the size of shared memory that can be allocated to a
single process. To overcome this, copy sysctl.conf to /etc, or append it if
the file is already present. Reboot your system to apply the changes.
In addition to the many wonderful features of native pyqtgraph widgets we have,
- Double click on plots to bring up cross-hair marker
- Cross-hair displays cross-section cuts for image plots
- Restore closed plots by double-clicking the name in the plot list
- Focus on a single plot by maximizing
- Right click on image plots
- toggle histogram & levels scale
- enable/disable auto-rescaling of levels when image is updated