RFE_IoT_SerialPlotter example
This more advanced example shows how to use the Arduino SerialPlotter feature with RF Explorer 3G+ IoT board.
The SerialPlotter tool available in the Arduino IDE, albeit limited, makes it very easy to display a basic graphical RF spectrum for any supported range. In this case we will use a configuration to display the range 902-928MHz, but can be easily modified to any other value.
This sketch configures the IoT analyzer to display a graphical capture of the RF spectrum. To achieve that, it does not report data to be listed in the Serial Monitor as in previous examples. We rather use the Serial Plotter available in Arduino IDE version 1.6.6 or newer. Note: Arduino SerialPlotter is still under development by the Arduino community, so it may add extra features in coming versions; we will do our best to update this example to adapt to any upcoming enhancement.
Load the RFE_IoT_SerialPlotter in the Arduino and display results using the Arduino SerialPlotter. You can reset the Arduino to get a new capture anytime.
Using a direct connection (for instance with the RF Explorer Signal Generator) tuned at 915MHz and configured for a power of -28.5dBm, we will get the below depicted image.
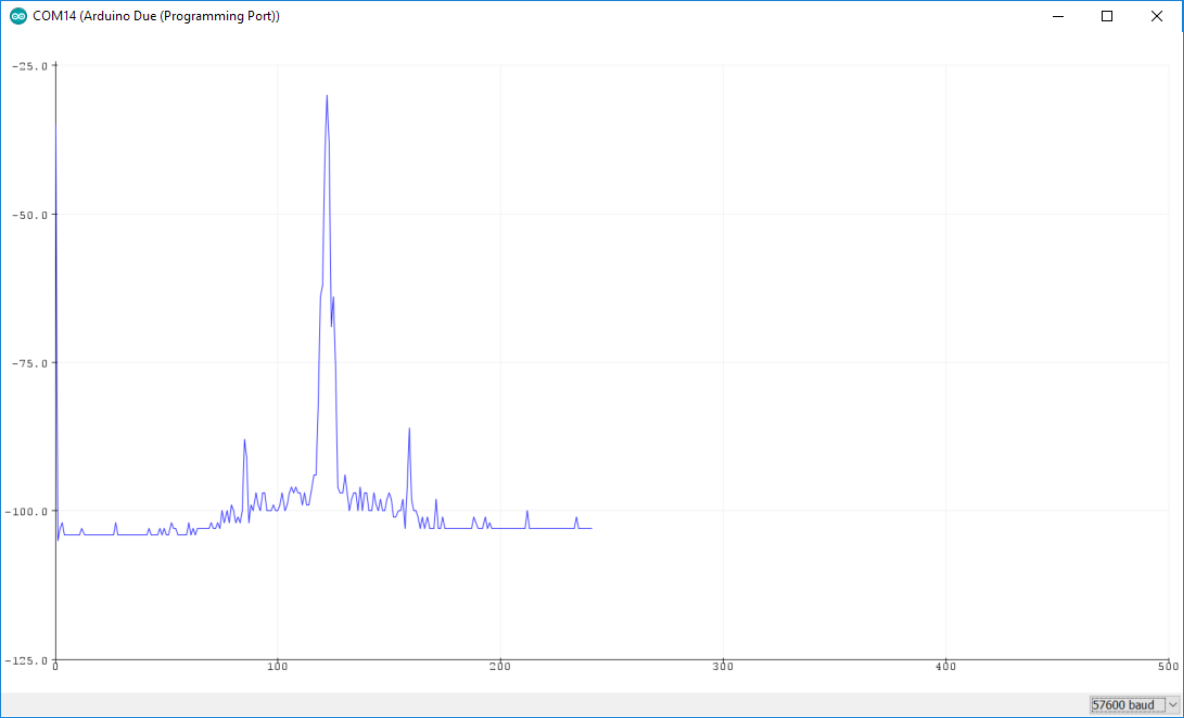
Details on how to interpret the graphical data below:
- The blue trace depict the RF sweep data captured
- The Y axis displays scale in dBm. The image displays a noise floor in the range of about -105dBm, and a peak signal at -28dBm around the center of the sweep.
- The X axis display the ordinal samples, as they get captured in the RF sweep by the IoT board. Unfortunately the Arduino SerialPlotter does not allow to label or scale the X axis in any different way. In the image below, the display includes 240 sample points corresponding to 902 to 928Mhz.
- The SerialPlotter does not include any adjust on the scale, therefore we manually include a first vertical line to setup the Y axis limit. This first vertical line at sample 0 point is not an actual signal, but a SerialPlotter artifact.
More details on how the Serial Plotter is used to display those values in the next section Detailed source code description.
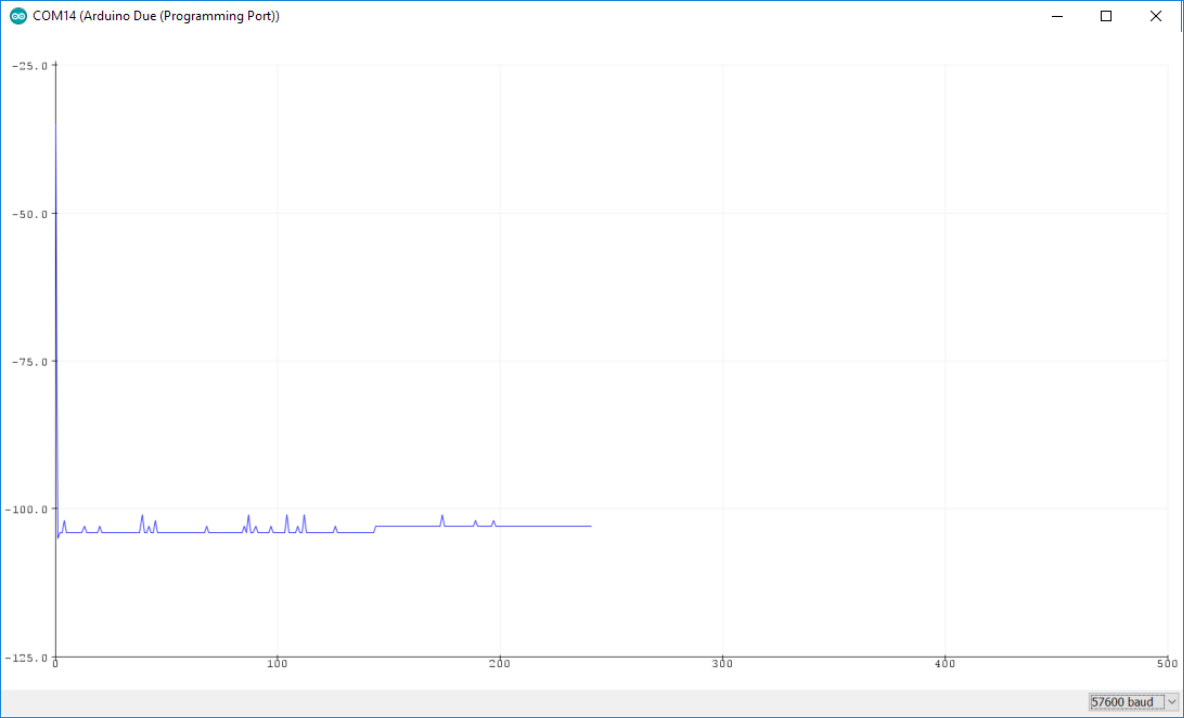
Keeping the SMA port without input signal shows the device noise floor in the range of about -105dBm.
We included two #define values to easily reconfigure the sketch to any arbitrary start/stop sweep configuration, just playing with different values of _START_FREQ_KHZ and _STOP_FREQ_KHZ. Note the frequency is expressed in KHZ to help on using integer numbers and still offer the maximum resolution.
These two constant defined values are protected and compared against the _MIN_FREQUENCY_KHZ and _MAX_FREQUENCY_KHZ available in the RF Explorer 3G+ IoT Arduino library. These values help to detect any wrong setting in the sketch if introduced by mistake and will display a compiler error if not honored.
	#if _START_FREQ_KHZ>=_STOP_FREQ_KHZ
	  #error PLEASE SPECIFY VALID FREQUENCY RANGE
	#endif

	#if ((_START_FREQ_KHZ < _MIN_FREQUENCY_KHZ) || (_STOP_FREQ_KHZ>_MAX_FREQUENCY_KHZ))
	  #error PLEASE SPECIFY VALID FREQUENCY RANGE
	#endif
The setup() function is about the same as used in prior examples RFE_IoT_GetPeak y RFE_IoT_SweepsAndChangeConfig. The only significant difference is the way we wait to achieve a given status in the IoT board before moving to the next step. This is required in this example to guarantee the sweep displayed is exactly the expected one and not any prior configuration of the IoT board.
These wait status code is easily identified by a pair of calls to updateBuffer() and processReceivedString() functions, inside a loop, where condition indicates when the correct configuration was received.
    //Wait for Message received is default configuration from 3G+
    do
    {
        g_objRF.updateBuffer();
        g_nProcessResult = g_objRF.processReceivedString();
    }
    while(!((g_nProcessResult == _RFE_SUCCESS) && (g_objRF.getLastMessage() == _CONFIG_MESSAGE)));

    //Send Command to change RF module configuration
    g_objRF.sendNewConfig(_START_FREQ_KHZ, _STOP_FREQ_KHZ);
In the above code, the state is satisfied when the message received was a _CONFIG_MESSAGE, as well as the processed message was successfully compared to _RFE_SUCCESS. To get additional details on available messages and return values, please visit RF Explorer 3G+ IoT library reference
Right after the condition is met, the sketch code will send a new configuration to the IoT board with a call to sendNewConfig() function.
    //Send Command to change RF module configuration
    g_objRF.sendNewConfig(_START_FREQ_KHZ, _STOP_FREQ_KHZ);
We now need to wait for the new configuration to arrive as otherwise may use upcoming sweeps from older configuration. We use exactly same waiting loop approach. After receiving the new configuration we can now read the first sweep and send it to the SerialPlotter.
To wait for the sweep to arrive, we use an equivalent wait loop but, in this case, we need to check for a valid _SWEEP_MESSAGE.
    do
    {
        g_objRF.updateBuffer();
        g_nProcessResult = g_objRF.processReceivedString();
    }
    while (!((g_nProcessResult == _RFE_SUCCESS) && (g_objRF.getLastMessage() == _SWEEP_MESSAGE) && g_objRF.isValid()));
The Arduino SerialPlotter expect Y integer values to be feed so we just do that for every data point inside the received sweep.
    for (short int nIndexStep = 0; nIndexStep<g_objRF.getConfiguration()->getFreqSpectrumSteps(); nIndexStep++)
    {
        //Print every step of sweep data into Serial Plotter
        g_objRF.getMonitorSerial().println(g_objRF.getSweepData()->getAmplitudeDBM(nIndexStep));
    }
As described earlier, in order to scale the Y axis in a way all captures are displayed the same way, we send a first line with values between -105dBm and -35dBm which seems to work fine. If not doing this, the SerialPlotter will autoscale data - you can try different values or even removal of these lines if prefer a different visual approach.
    g_objRF.getMonitorSerial().println(-35);
    g_objRF.getMonitorSerial().println(-105);
Another limitation in the Arduino SerialPlotter is the lack of a command to clean and repaint the screen. The traced signal will remain in the SerialPlotter till you close and open it again. Therefore we added a final line of code in the sketch to put the RF Explorer 3G+ IoT board into sleep (low power consumption mode) and stop scanning to avoid adding more consecutive scan data into the same SerialPlotter display.