Deadlock, Part 1: Resource Allocation Graph
A resource allocation graph tracks which resource is held by which process and which process is waiting for a resource of a particular type. It is very powerful and simple tool to illustrate how interacting processes can deadlock. If a process is using a resource, an arrow is drawn from the resource node to the process node. If a process is requesting a resource, an arrow is drawn from the process node to the resource node.
If there is a cycle in the Resource Allocation Graph and each resource in the cycle provides only one instance, then the processes will deadlock. For example, if process 1 holds resource A, process 2 holds resource B and process 1 is waiting for B and process 2 is waiting for A, then process 1 and process 2 will be deadlocked.
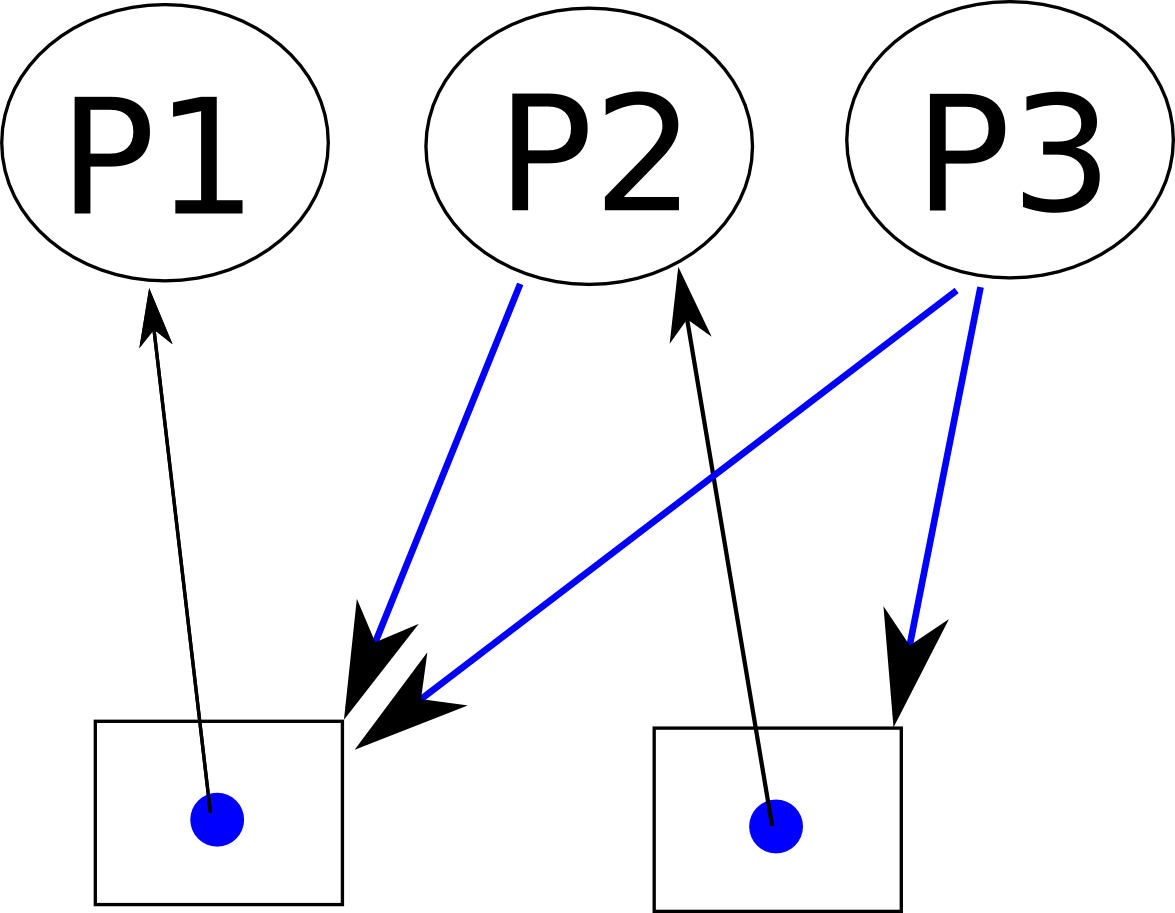
Here's another example, that shows Processes 1 and 2 acquiring resources 1 and 2 while process 3 is waiting to acquire both resources. In this example there is no deadlock because there is no circular dependency.
A lot of times, we don't know the specific order that a resource may be acquired so we can draw the graph directed.

As a possibility matrix. Then we can draw arrows and see if there is a directed version that would lead us to a deadlock.

Consider the following resource allocation graph (assume that the processes ask for exclusive access to the file). If you have a bunch of processes running and they request resources and the operating system ends up in this state, you deadlock! You may not see this because the operating system may *preempt some processes breaking the cycle but there is still a chance that your three lonely processes could deadlock. You can also make these kind of graphs with make and rule dependencies (with our parmake MP for example).
