A pagerduty dashboard, for viewing pagerduty alerts in a different way. In particular, the current implementation focuses on visualizing how much pagerduty interrupts us. The hope is to refactor the metadash project such that this can feel like a natural extension of metadash - ideally this would become metadash-pagerduty at some point.
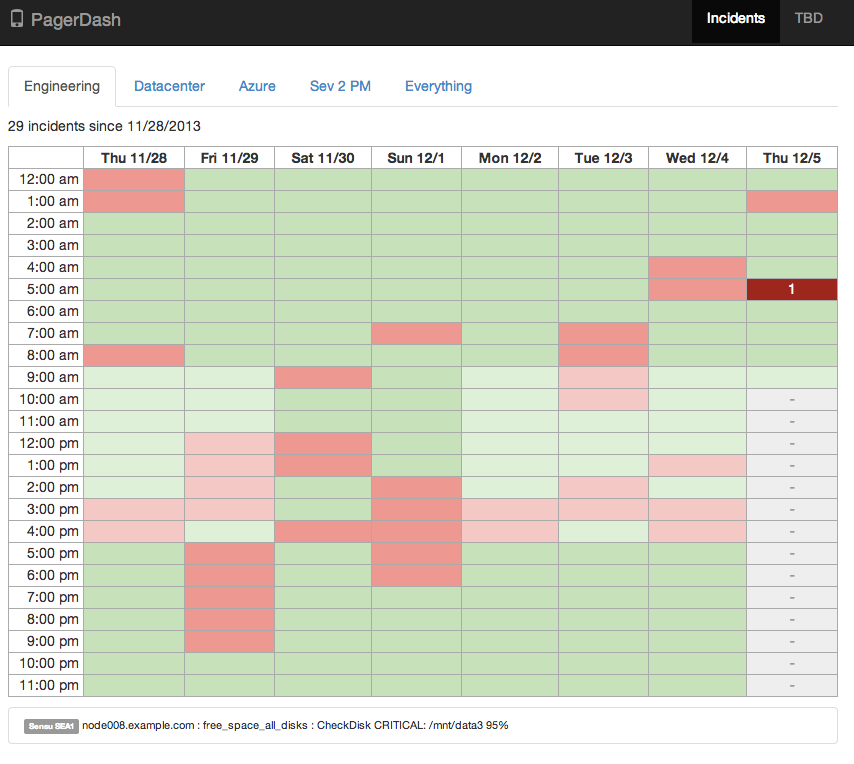
Here's a sample screenshot, but be warned, much of the functionality is incomplete (i.e. the entire top navbar)
Create config.js in the root directory. For better or worse, this is currently an exported js object.
(function(exports){

    'use strict';
    exports.access = {
        authToken: "<PAGERDUTY_AUTHTOKEN>",
        subdomain: "<PAGERDUTY_SUBDOMAIN>"
    };

    exports.links = {
        weekly : [
            {
                label: 'All Engineering',
                query: '?service=<SERVICEID1>|<SERVICEID2>|<SERVICEID3>'
            },
            {
                label: 'Engineering Subset',
                query: '?service=<SERVICEID1>'
            },
            {
                label: 'Non Engineering',
                query: '?service=<SERVICEID4>'
            },
            {
                label: 'Everything',
                query: ''
            }
        ]
    }

})(typeof exports === 'undefined'? this.pagerduty={} : exports);
Test the config with grunt dev server:
npm install grunt-cli -g
npm install bower -g
npm install
bower install
grunt server
Or to build a production release (not yet tested) to the dist folder:
grunt build
For production, drop the config.js into the dist directory, and configure a webserver to serve it statically and proxy api requests with the pagerduty auth token.
I'll add a sample nginx config when I get to that point.