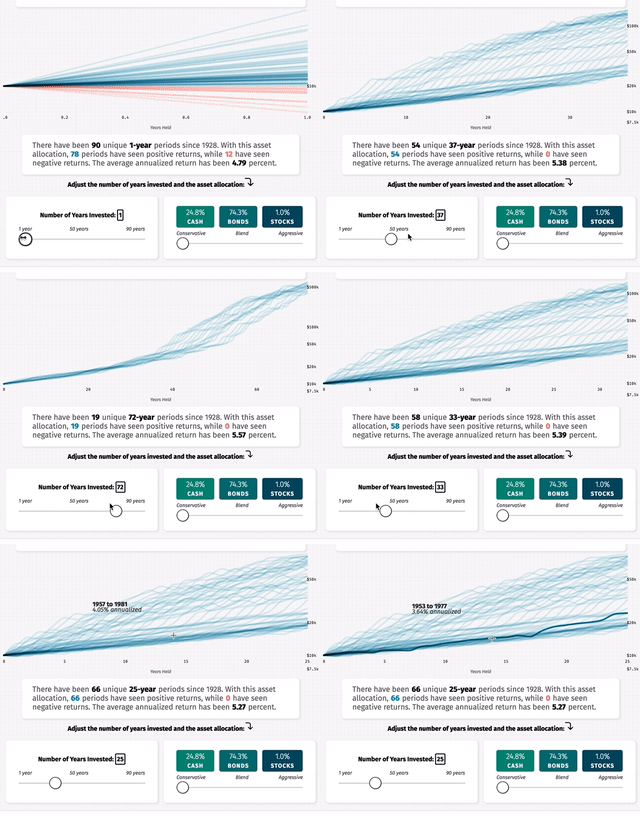
This project calculates and visualizes the performance of $10,000 during all possible historic periods of a chosen length since 1928. For example, investors have seen 86 seperate 5-year periods, 66 25-year periods, and only one 90-year period. This tool allows people to adjust the period length and asset allocation** - their mix of stocks, bonds, and cash. The user can hover over each line to see performance details.
Ultimately 8,900 different portfolio/holding period scenarios can be explored on the fly. This project uses React to coordinate event handling and state management. The financial calculations are all done on the client and recalculated upon each change in the holding period length or asset allocation mix. D3 calculates scales, axes, colors, etc, though it is largely through React components that actual DOM elements are generated for the DOM.
Historical market data is from Federal Reserve database in St. Louis (FRED) via NYU professor Aswath Damodaran. The data run from 1928 to 2017. Stocks represent the S&P 500 including dividends. Bonds are represented by 10-year treasury bonds. Cash is represented by three-month U.S. treasury bill. Assets are compounded annually. There is no adjustment for inflation here.
