Feature: PCP Integration
This is a follow-up from the PCP research.
- Install & enable metrics collection (with PCP)
- uses PackageKit insta-installer (also see demo — click on the "Enable" link)
- Show overall health (see related Health feature page)
- based on metrics & heuristics
- simple awareness of common issues based on predefined rulesets (in-page, while visiting the machine in Cockpit)
- quick-fixes where possible
- explain fixes when quick-fixes are not possible (quick summary; link for more details)
- Visualize resource usage
- current: show system utilization
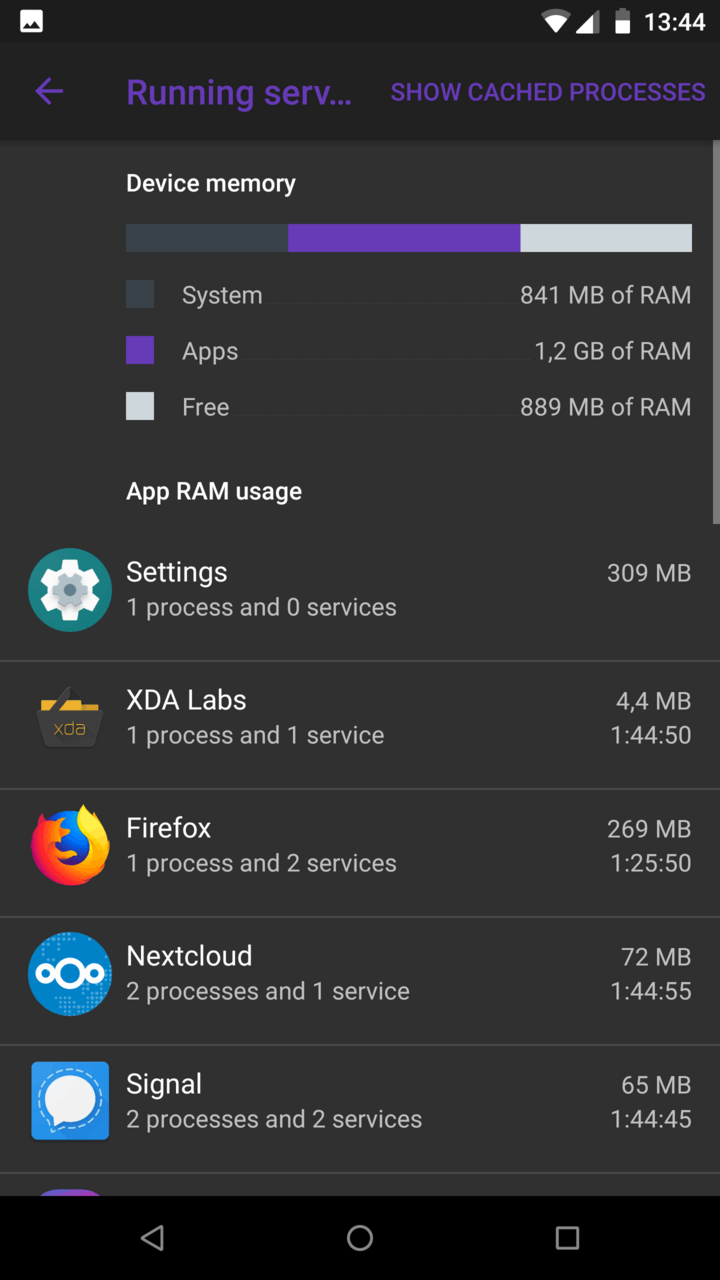
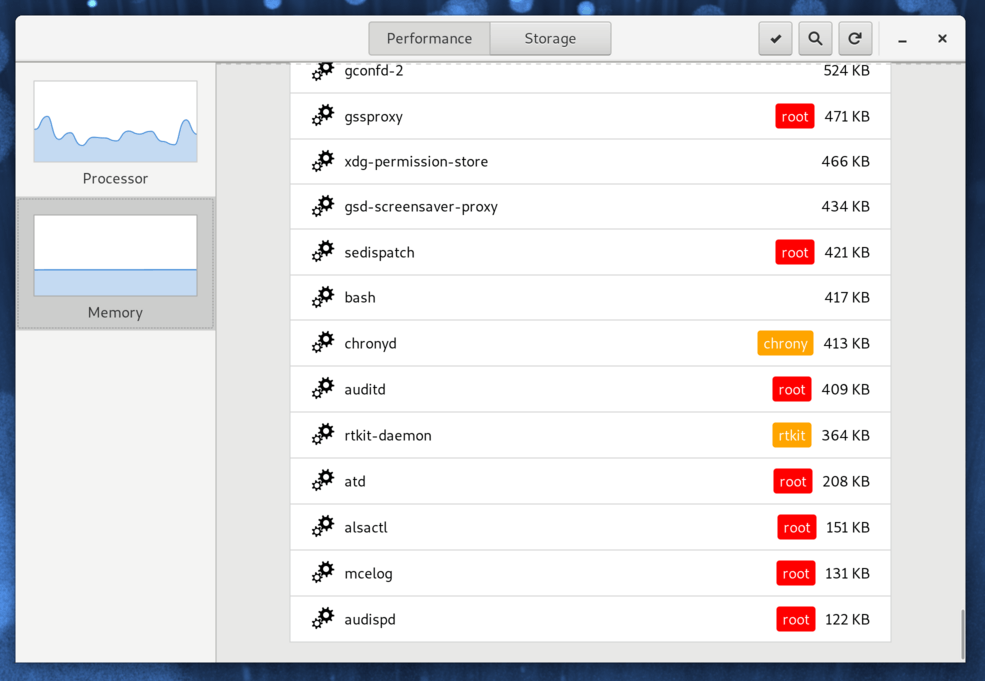
- current: show resource hogging processes
- historical: high-level review of recent metrics
- Notifications sent via email or SMS (using existing tooling; nothing custom in Cockpit)
- Notifications via browser push mechanism
- Customizable dashboard
- Detailed metrics view
Charlie Brown is a PHP developer at a Blockhead Industries, an all-in-one web company that helps businesses set up & maintain sites. Some customers have custom PHP code running and others use WordPress. In addition, all customers have access to several tools, such as phpMySQL and phpfm.
Most of the time, things are fine.
Twice a week, Charlie is "on call" and needs to fix customer issues. Today, a customer who runs a restaurant is trying to upload this week's menu as a PDF... but the website isn't working. Charlie needs to figure out what's wrong.
Charlie signs into Cockpit on the public-facing upload server. He begins to debug:
- Did someone change something recently? Charlie checks the audit logs from session recording and discovers nothing was changed.
- Is the service running? Charlie looks at services, filters for "Apache" and sees HTTPD is running.
- Is it the firewall? Charlie looks at networking, sees the firewall is running, clicks to view the firewall rules, and checks HTTP — ports 80 and 443 (for SSL) are allowed and open.
- Charlie happens to look at the system stats and sees that CPU load is quite high. "What's causing that?" he wonders.
After glancing at the CPU graph for the past 6 hours, he sees a spike 4 hours ago from a process and finds out phpfm hung due to an NFS mount going down.
Charlie remounts the NFS share, restarts Apache, and contacts the customer.
Marcie Carlin works with Charlie in the IT department and heard from a co-worker over lunch that the webserver has been slow to respond in the evenings for the past few days.
Back at her desk, Marcie logs into the webserver through Cockpit. There are no current problems, and system load looks fine. She clicks on the history link and views a summary of what has happened recently.
Aha! There is an indexing process with a high CPU load that's kicked off during 6 pm every day. After a bit of snooping in the console, she discovers the crontab was modified and someone made a typo. The indexing was supposed to run on the weekends at 6 am, not every day at 6 pm.
Lucy van Pelt is a system admin who has been using Cockpit for the past several months at work. She signed in to Cockpit to create a new account for a co-worker.
After signing in, she notices the Samba service has been using a bunch of CPU for the past 6 hours.
Using Cockpit, she's able to restart the offending Samba service and continue creating her co-worker's account.
- Having a bunch of graphs may be useful for gauging overall system performance, but it's difficult to correlate various aspects of the system and tie that to system processes.
- It's also usually difficult to get a good idea about the relationship of CPU, RAM, and IO usage.
- Scrolling horizontally is problematic.
- Navigating charts via shrinking the timeline or pagination are both problematic.
- Most charts do not have a way to show top offenders, which is what many administrators want to see and quickly understand.
- Many admins use customization for special views to figure out things as a work-around to how awful system-level graphs are.
- PCP installer link & workflow prototype (click "Enable persistent metrics…")
- Health & live metrics
- Historical view of metrics
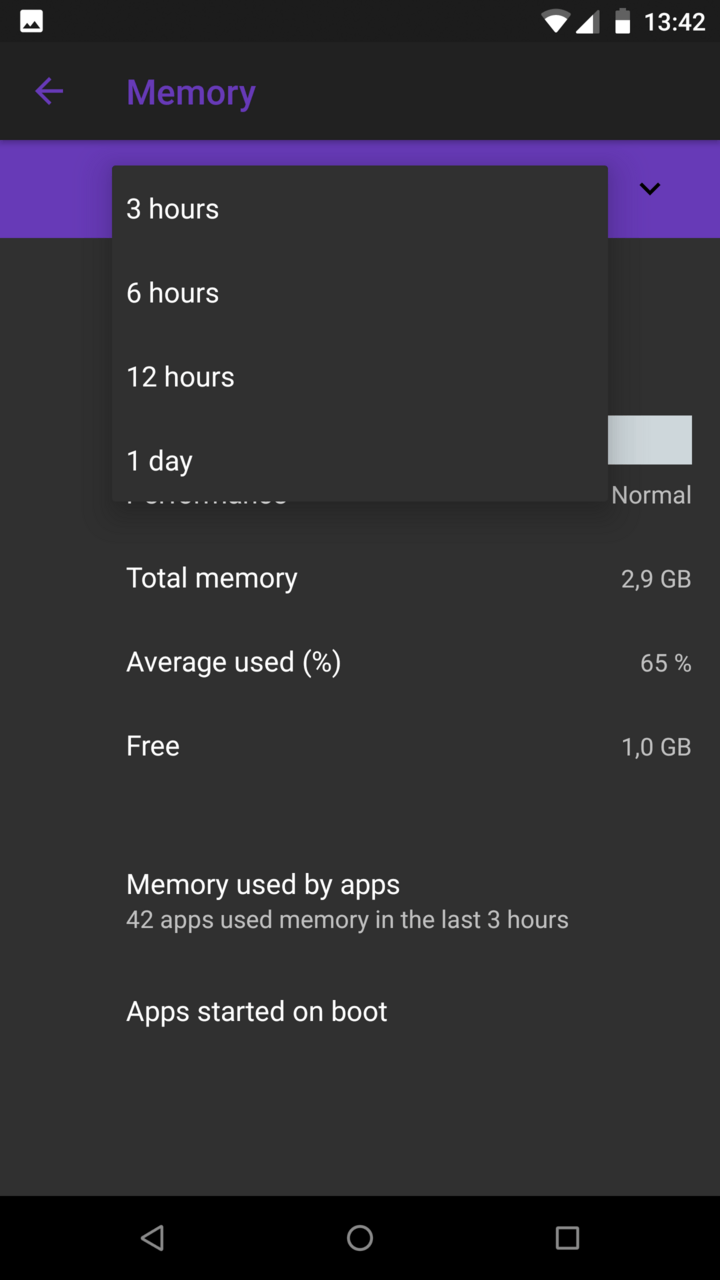
| Memory | 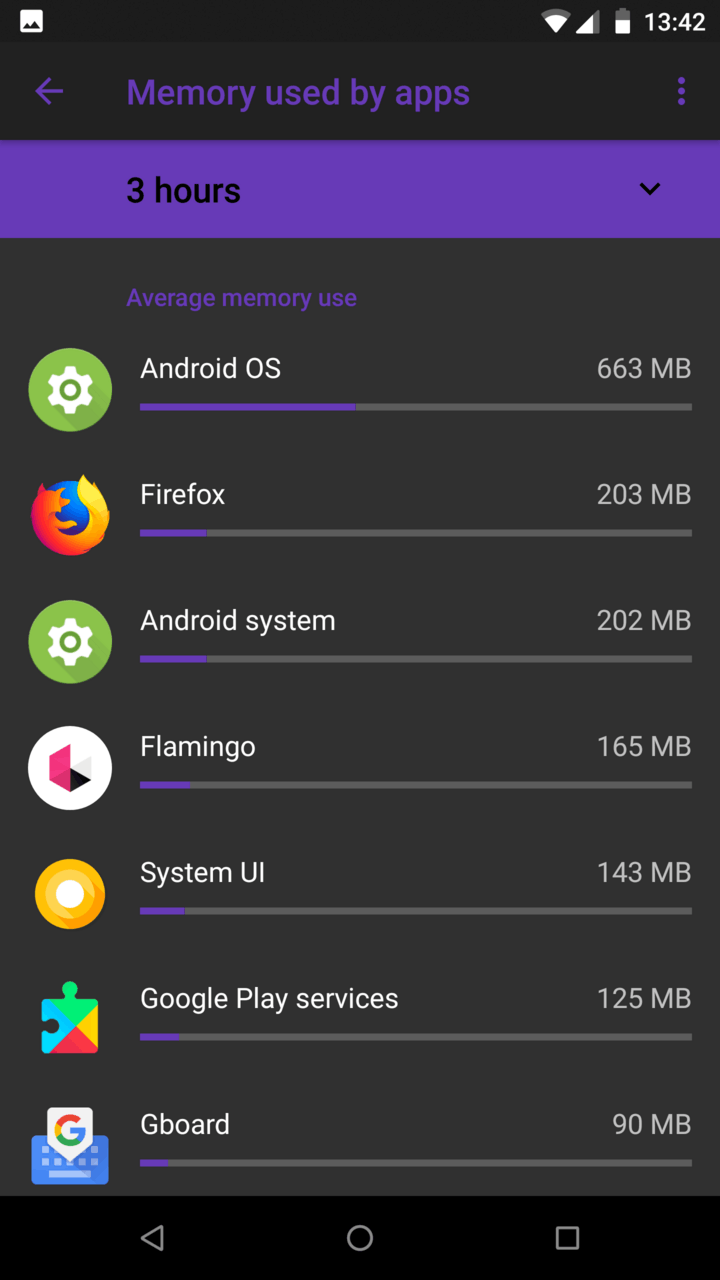 |
 |
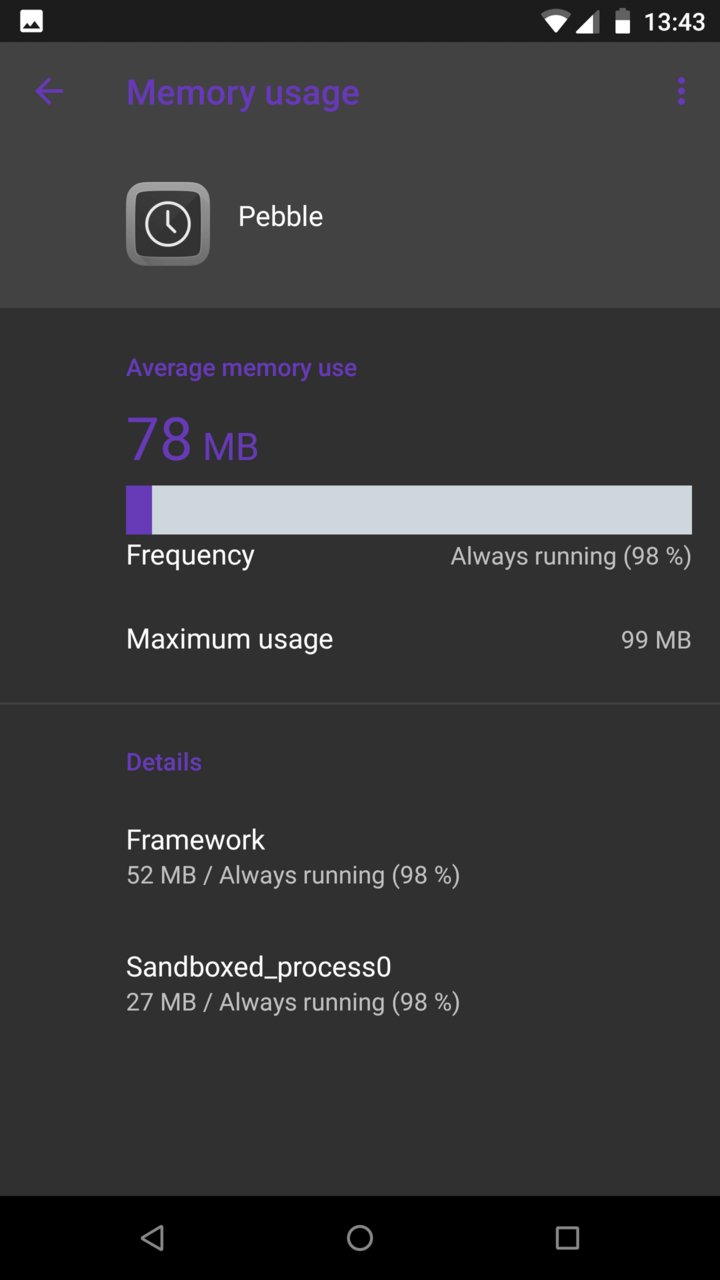 |
| Process | 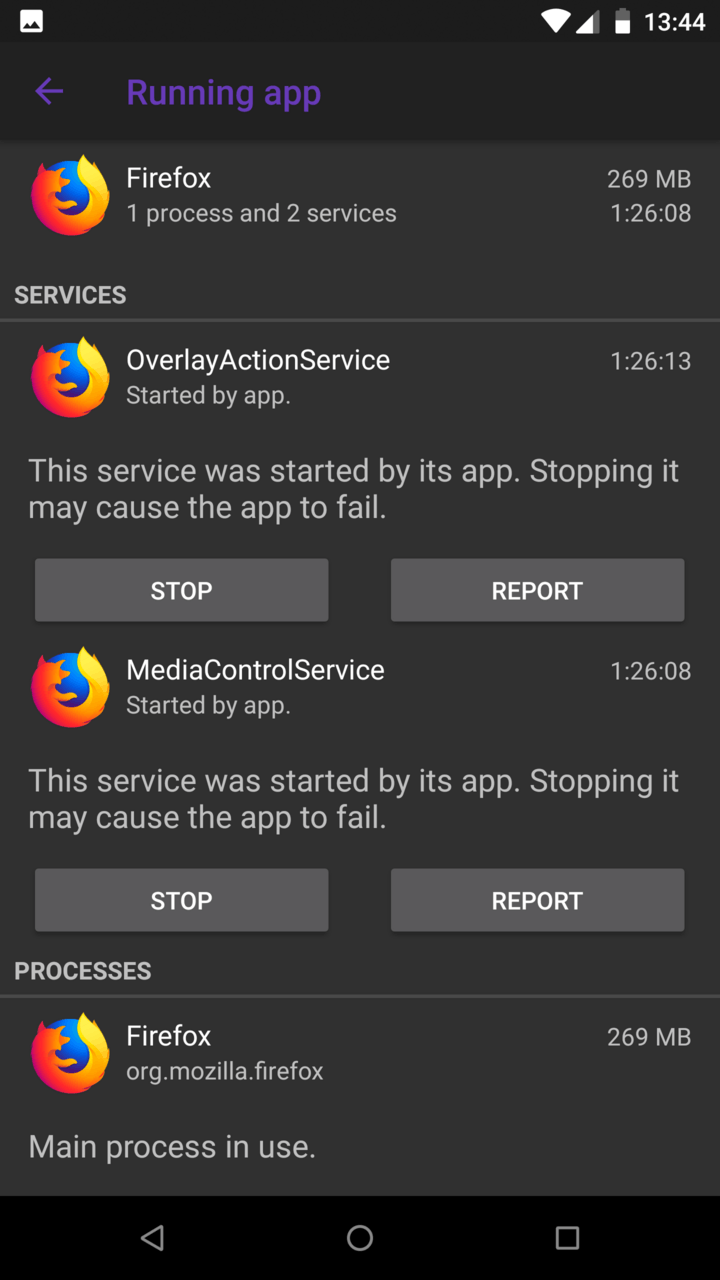 |
 |
|
| Network | 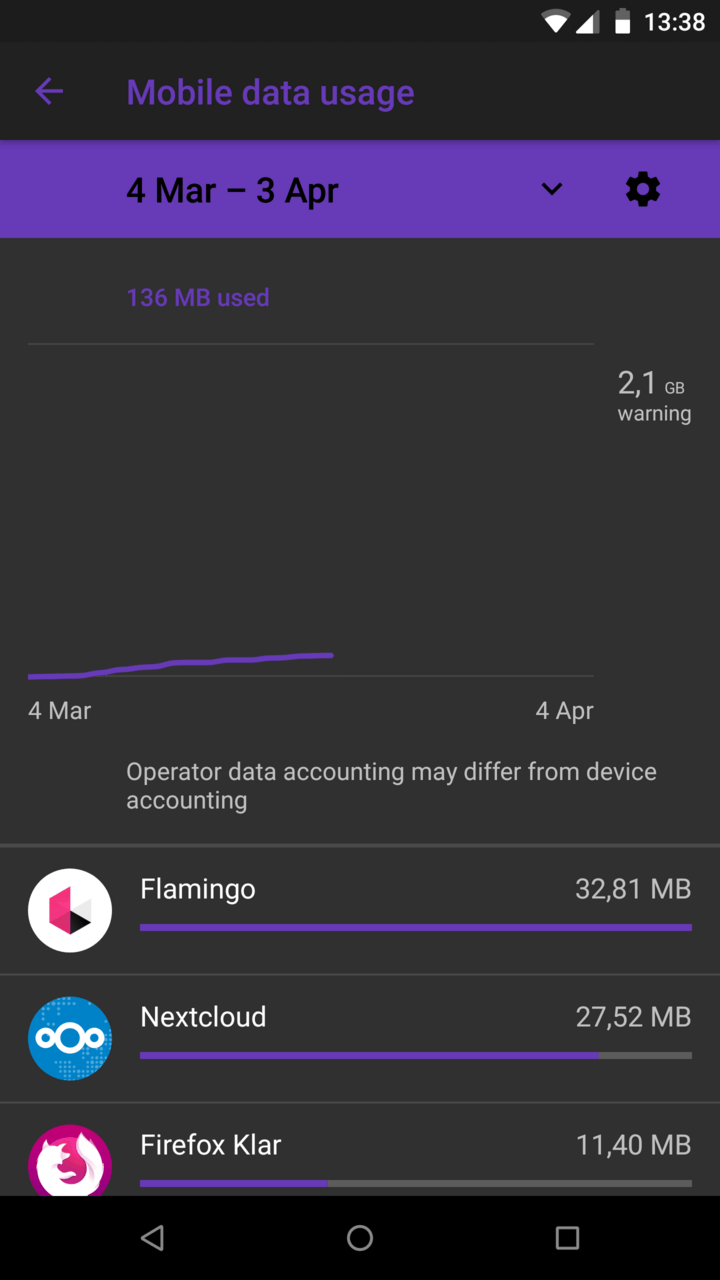 |
| Processes | 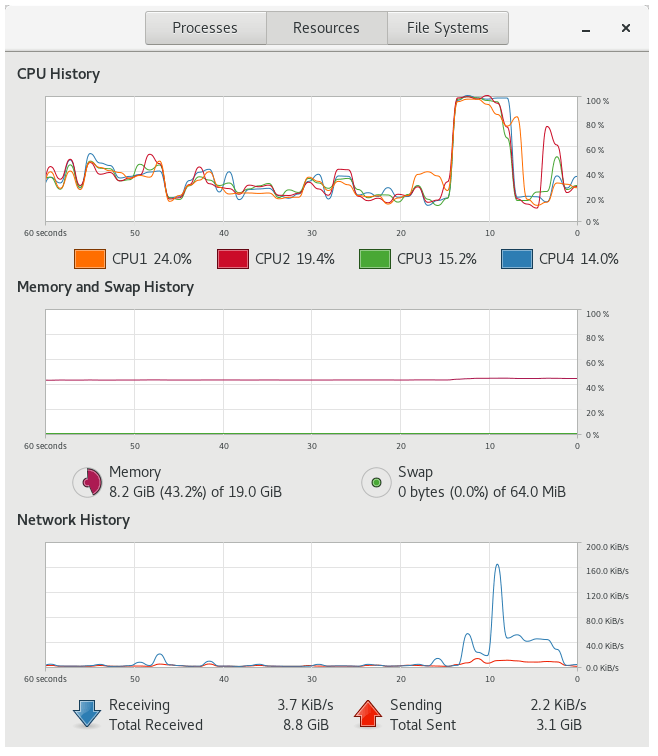 |
| Tasks | 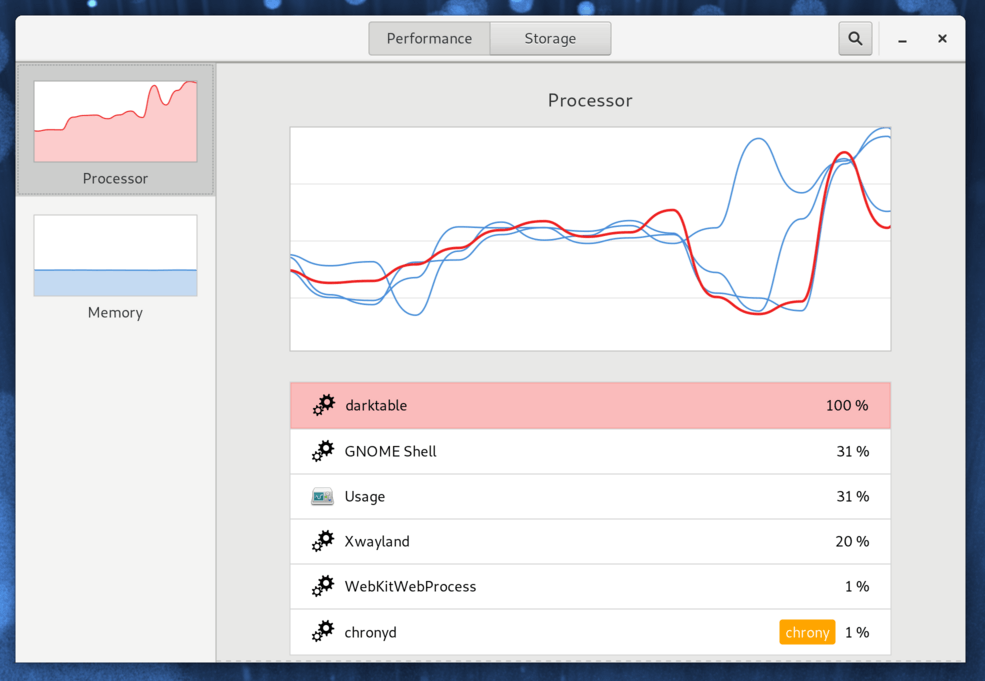 |
 |
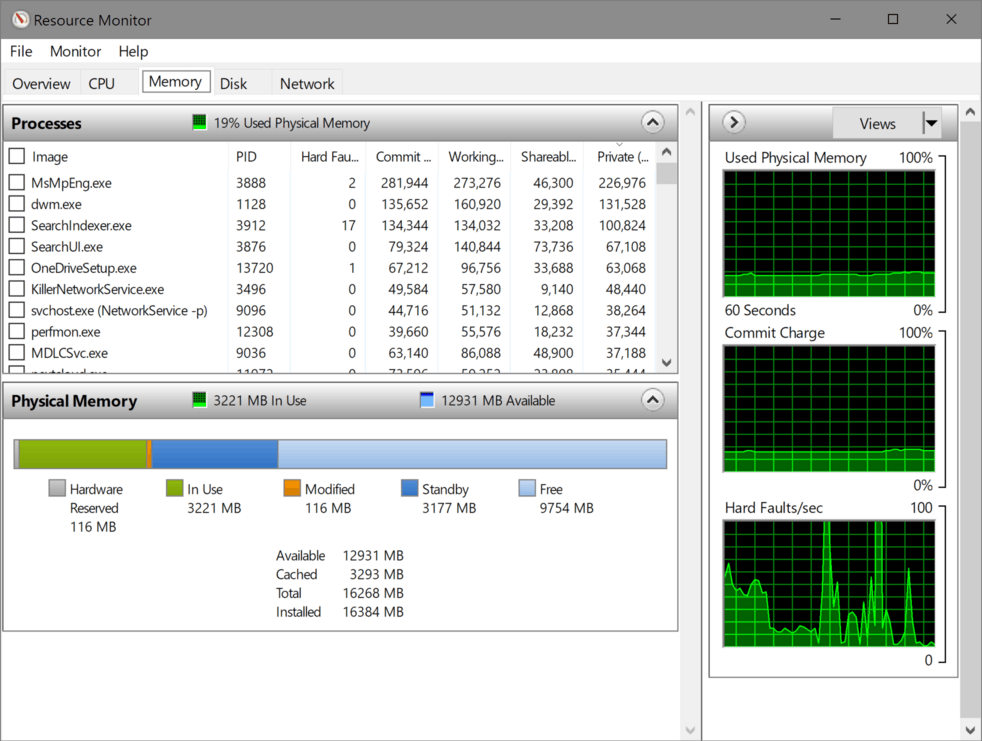
| RAM | 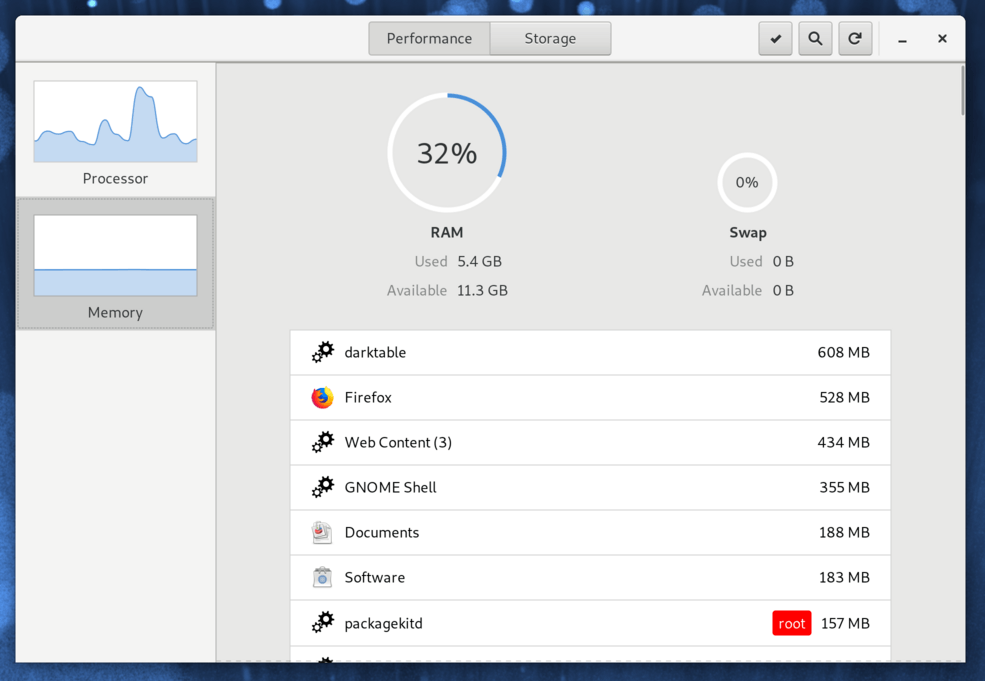 |
| Resource Monitor | 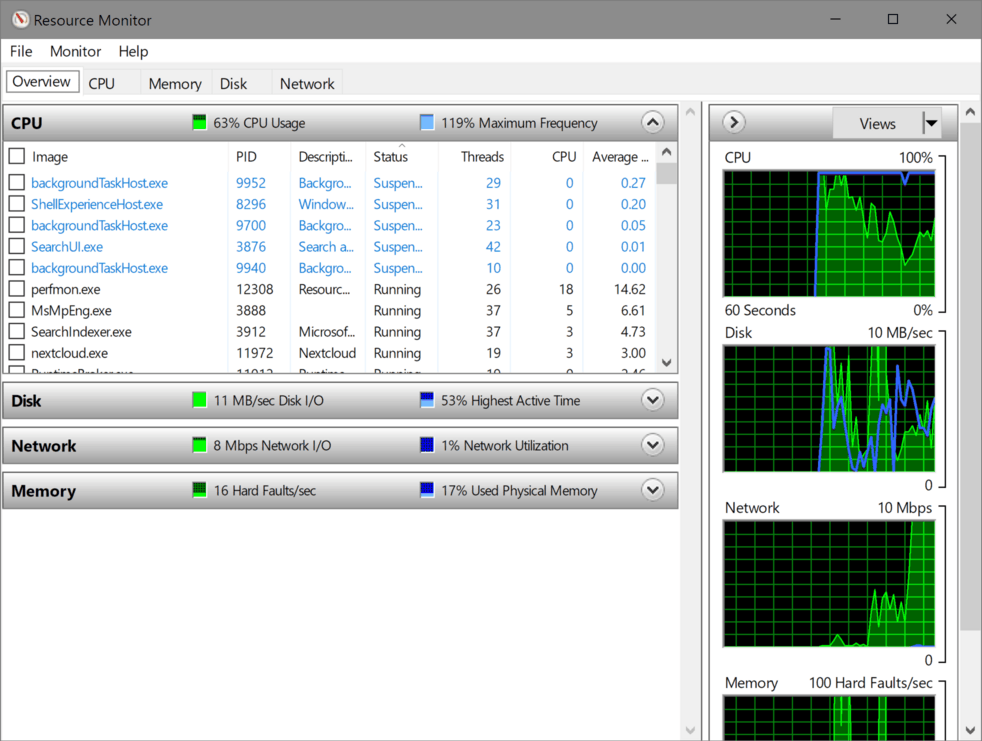 |
 |
|
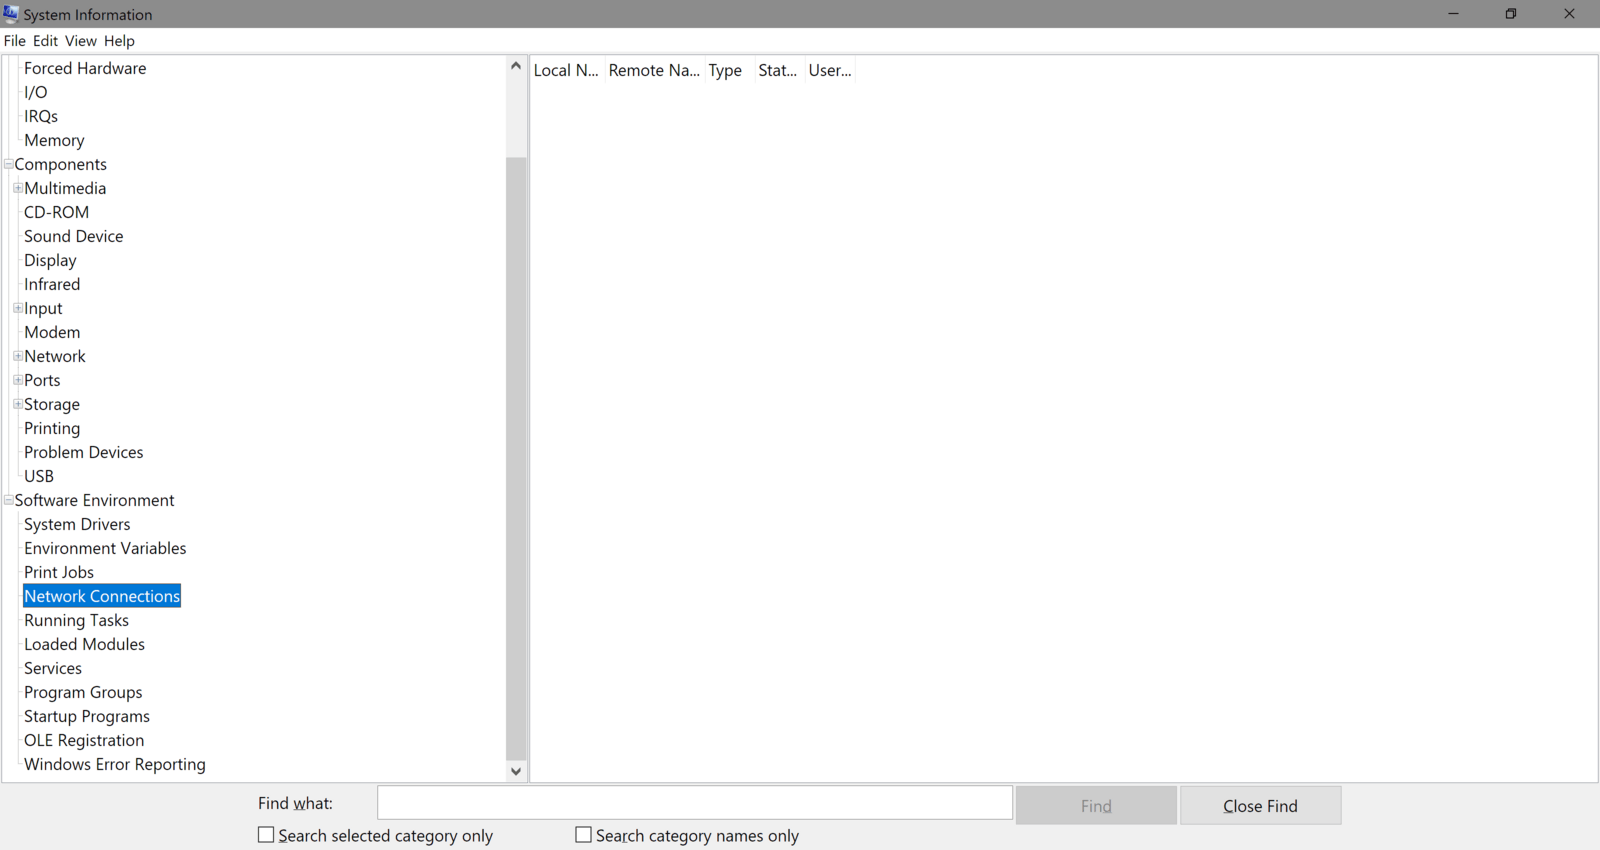
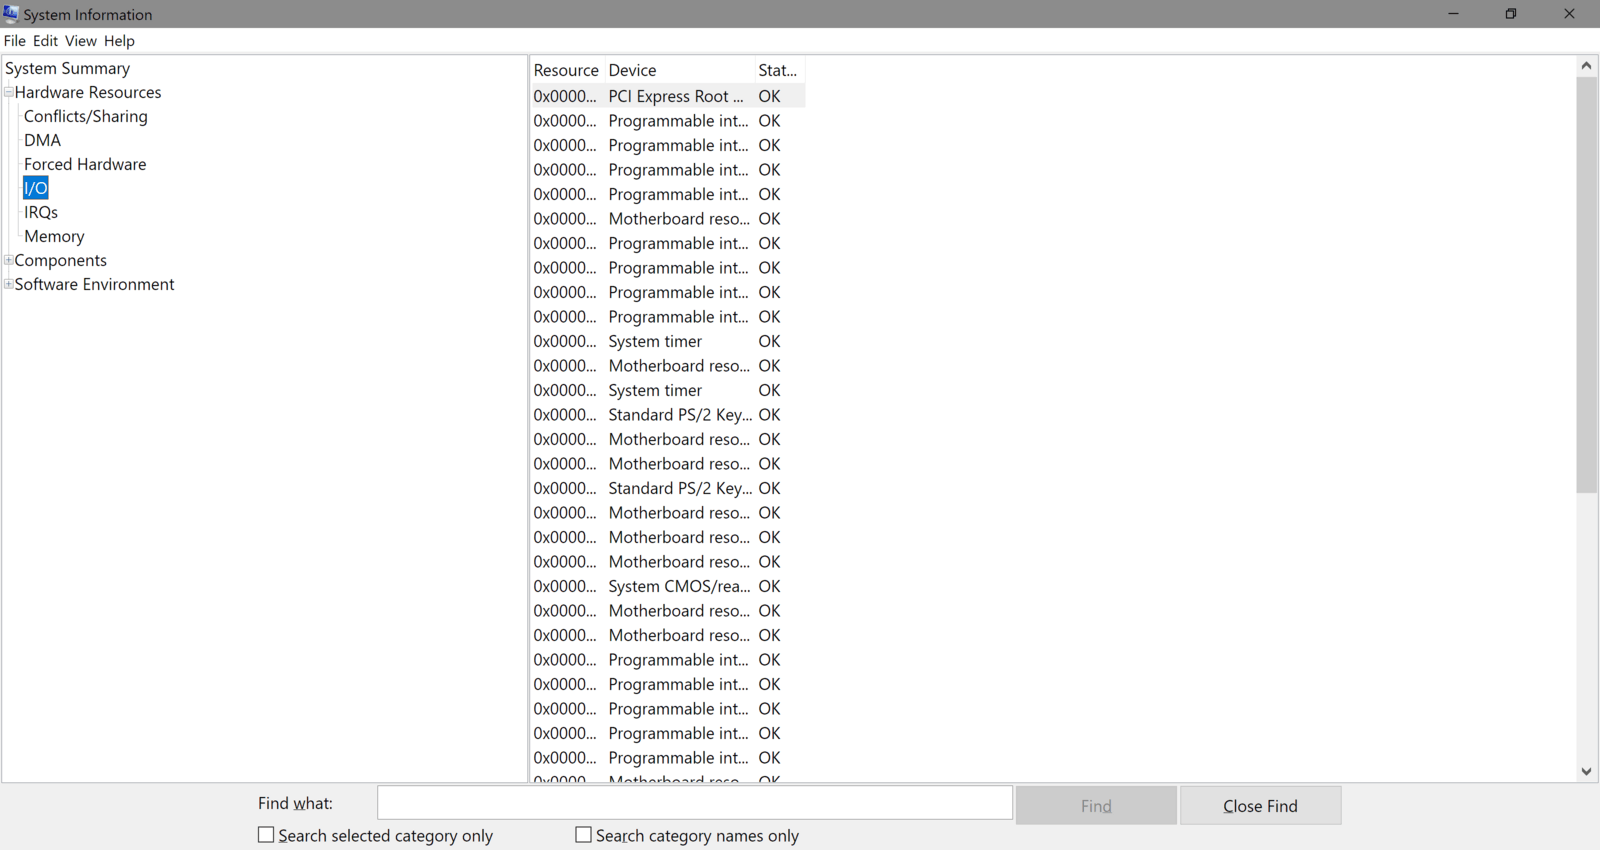
| System Information (Net & IO) |
 |
 |
|
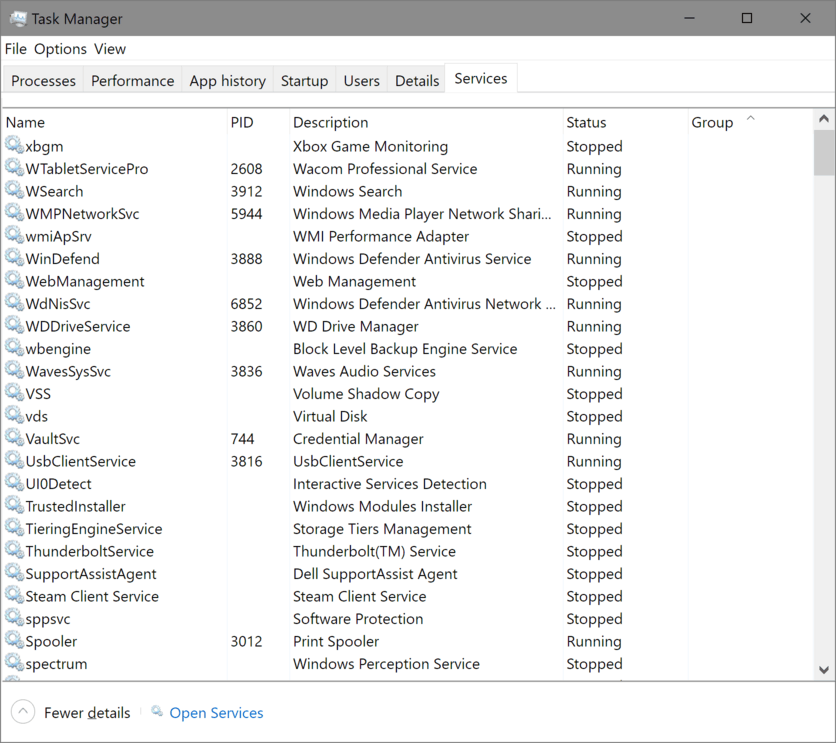
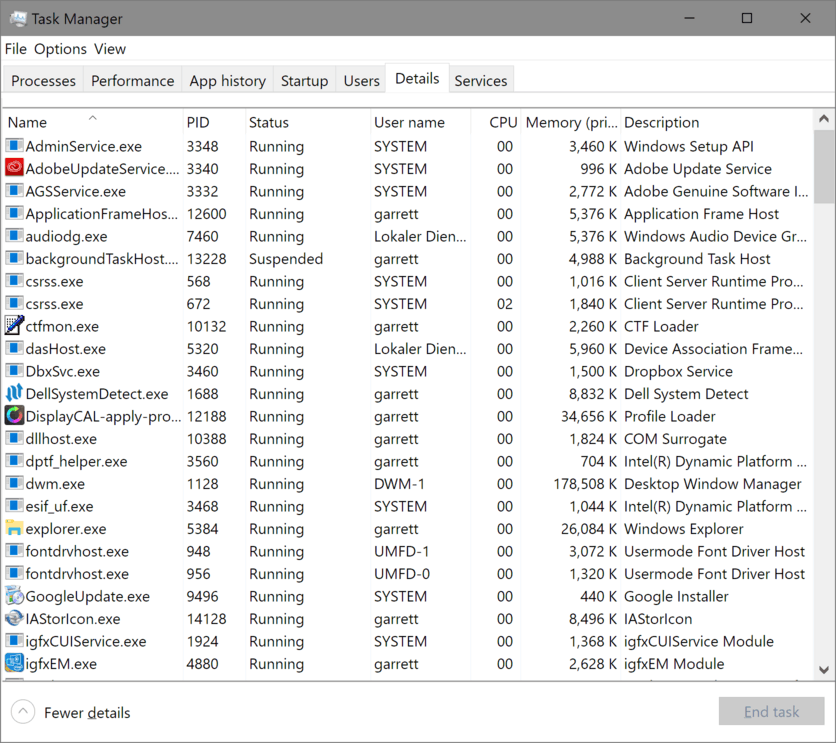
| Task Manager Services & Details |
 |
 |
|
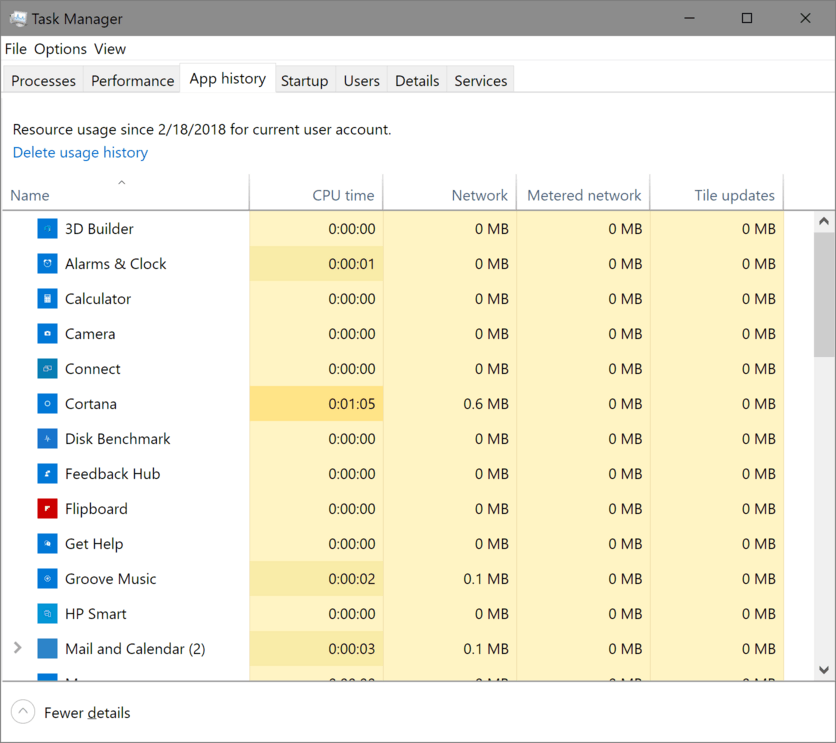
| Task Manager Apps |
 |
||
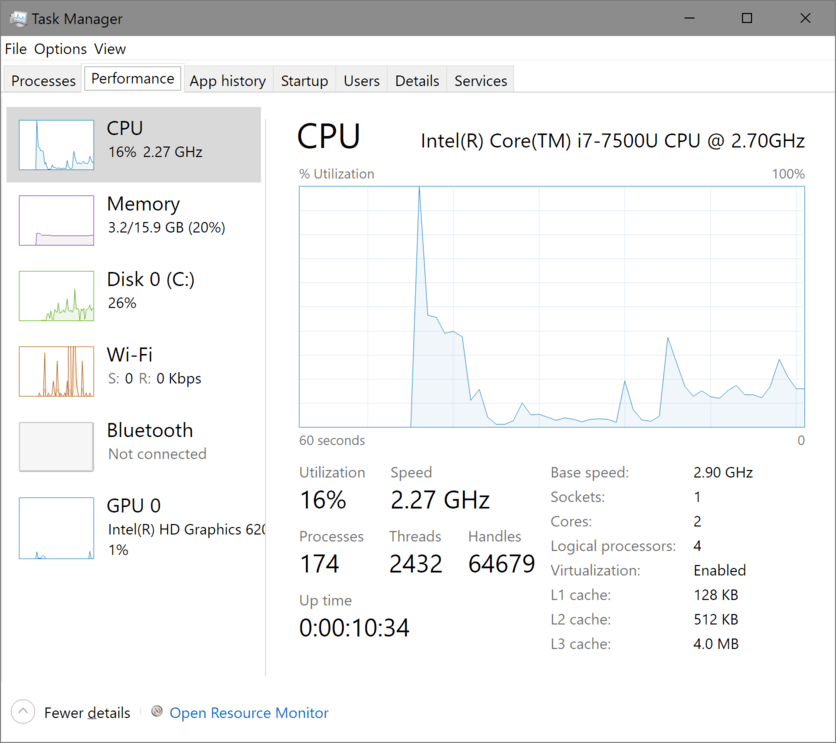
| Task Manager Perf |
 |
[Coming soon]