We will parse the log records generated by the PfSense Firewall. We already have our graylog server running and we will start preparing the terrain to capture those logs records.
We now create the Pfsense index in System / Indexes
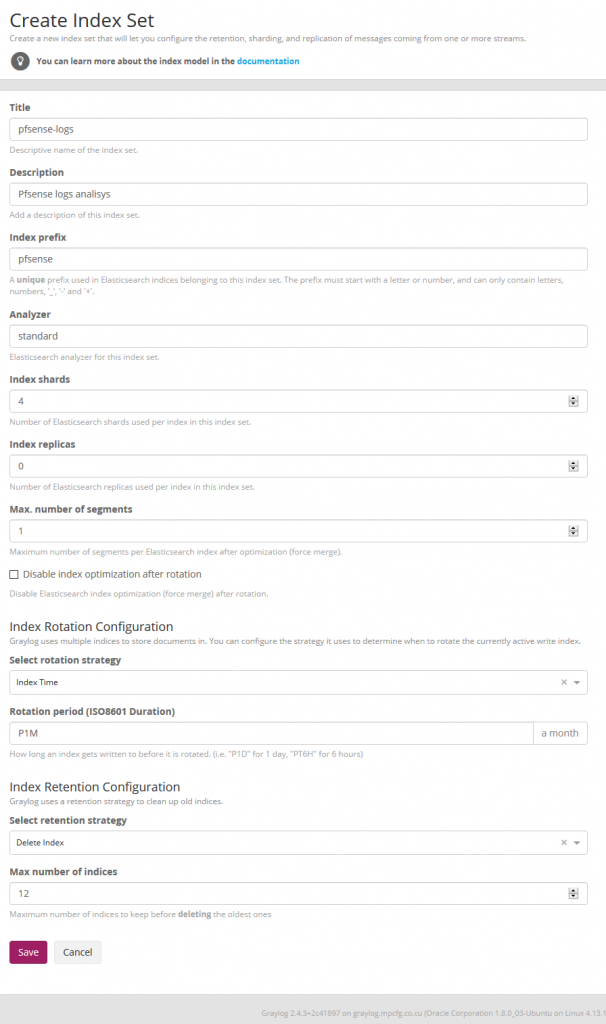
Index shard 4 and Index replicas 0, the rotation of the Index time index and the retention can be deleted, closure of an index according to the maximum number of indices or doing nothing. In my case, I set it to rotate monthly and eliminate the indexes after 12 months. In short there are many ways to establish the rotation. This index is created immediately.

and with cerebro we can check it
This content pack includes Input rsyslog type , extractors, lookup tables, Data adapters for lockup tables and Cache for lookup tables. To download these files we install git to clone the repository.
#apt-get install git
and then we cloned it
#git clone https://github.com/devopstales/pfsense-graylog
We will locate the CSV data of the lookup tables to later convert the number of ports to services name. From the git that you just cloned, we selected the service-names-port-numbers.csv file and copied it to /etc/graylog/server.
#cp service-names-port-numbers.csv /etc/graylog/server
We now import the file from the Content Pack folder and for them we select in the System / Content Packs the option Import content packs to upload the file.
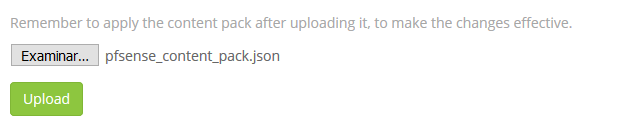
As we see, it is add to the list
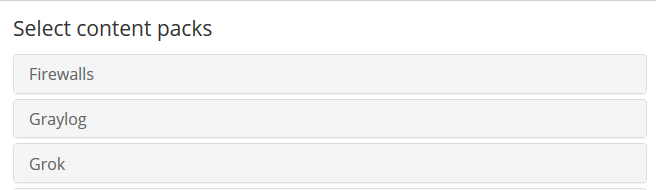
Now we select the Pfsense content pack
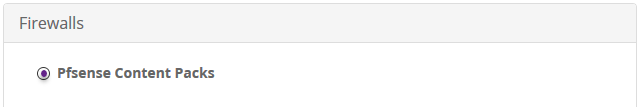
And we apply it

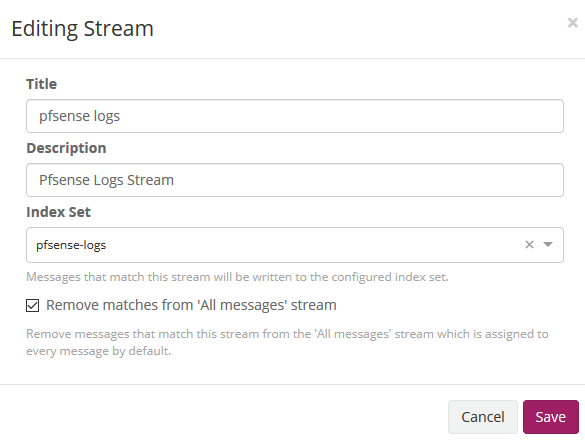
We edit the stream of pfsense in Streams to associate the index that we created initially. We mark that it eliminates the coincidences for the default stream 'All message' so that only it stores it in the index of pfsense.
As previously explained, by default graylog for each index that is created generates its own template and applies it every time the index rotates. If we want our own templates we must create them in the same elasticsearch. We will add the field real_timestamp that will be useful when using grafana and we also convert the geo type dest_ip_geolocation and src_ip_geolocation to type geo_point to be used in the World Map panels since graylog does not use this format.
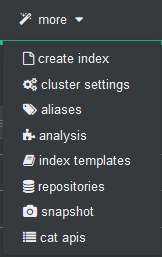
To import personalized template open cerebro and will go to more/index template
We create a new template
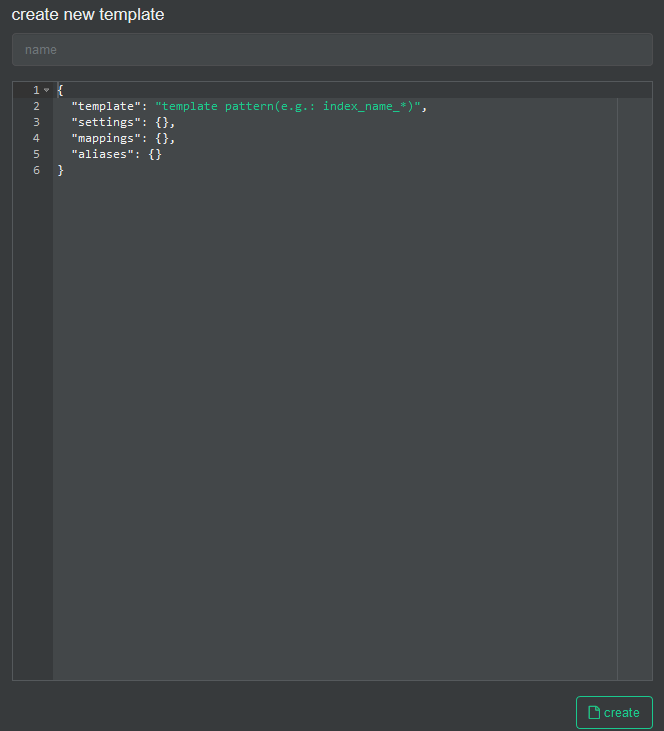
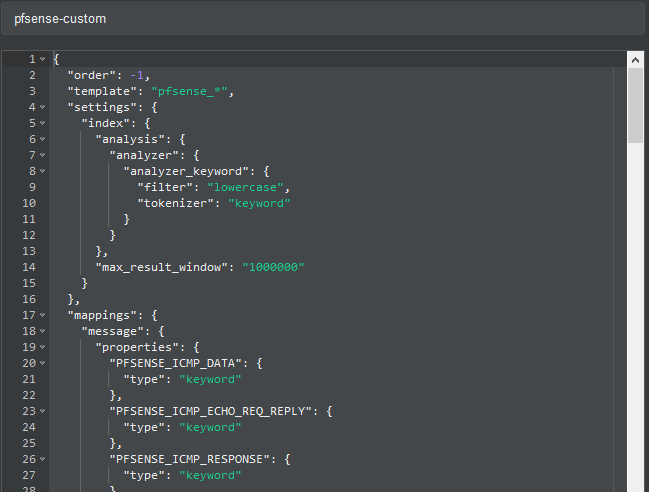
In the name we fill it with pfsense-custom and open the git file that has the template and paste its content here.
And then we press the create button.
Now we will stop the graylog service to proceed to eliminate the index through Cerebro.
#systemctl stop graylog-server.service
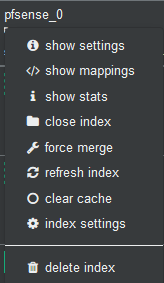
In Cerebro we stand on top of the index and unfold the options and select delete index.
We start the graylog service again and this will create the index with this template.
#systemctl start graylog-server.service
In Graylog go to System->Configurations and:
- Change the order by Message processors, to have the following sequence:
1. AWS Instance Name Lookup
2. Message Filter Chain
3. Pipeline Processor
4. GeoIP Resolver
This should look like:

Enable end update Geo-Location Processor
cd /etc/graylog/server/
wget https://geolite.maxmind.com/download/geoip/database/GeoLite2-City.tar.gz
tar -xzf GeoLite2-City.tar.gz
mv GeoLite2-City_*/GeoLite2-City.mmdb .
Then Update Geo-Location Processor Configuration to Enable Geo-Location processor
The pfsense logs that arrive at graylog, the date and the time are not sent to it, storing in the timestamp field the time they arrive at the graylog itself and this date and time is in UTC format so we must modify it so that it does not there are interpretation problems in grafana time format when displaying them.
We need to edit the pipeline of pfsense then in System/Pipelines
Source of the rule that makes the adjustment of the timestamp that we are going to use in grafana:
    rule "timestamp_pfsense_for_grafana"
     when
     has_field("timestamp")
    then
    // the following date format assumes there's no time zone in the string
     let source_timestamp = parse_date(substring(to_string(now("America/Habana")),0,23), "yyyy-MM-dd'T'HH:mm:ss.SSS");
     let dest_timestamp = format_date(source_timestamp,"yyyy-MM-dd HH:mm:ss");
     set_field("real_timestamp", dest_timestamp);
    end
We save and we have the pipeline ready to later receive the first logs.
We will now prepare Pfsense to send the log logs to the graylog and for this in Status/System Logs/ Settings we will modify the options that will allow us to do so.
We go to the Remote Logging Options section and in Remote log servers we specify the ip address and the port prefixed in the content pack in the pfsense input of graylog that in this case 5442.
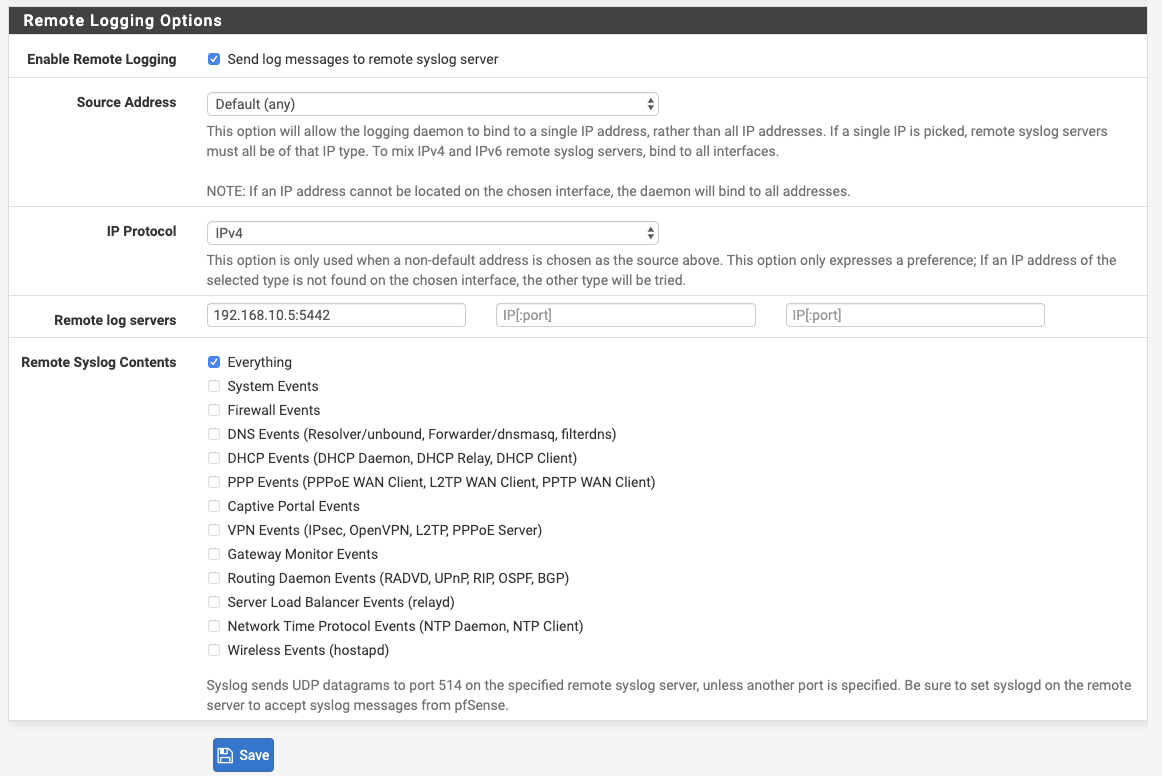
We save the configuration.
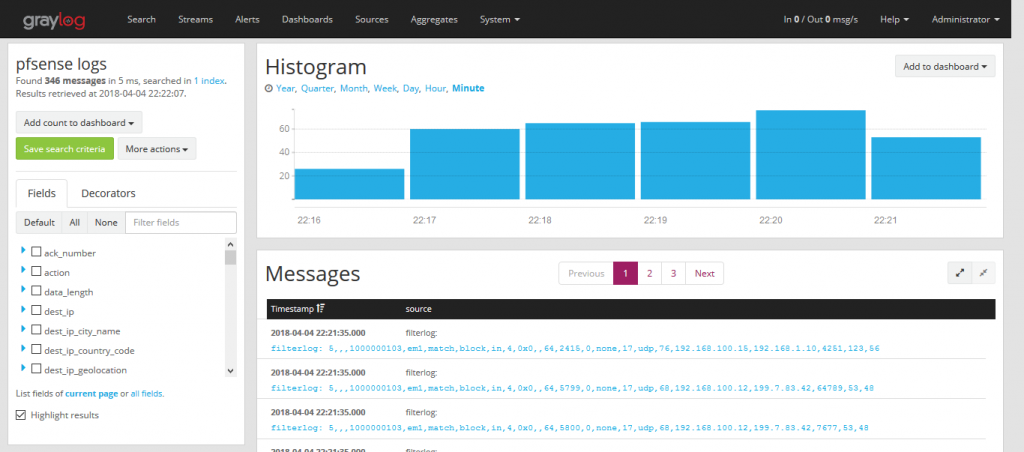
We now go to graylog by selecting the pfsense stream and we will see how it is parsing the log messages creating the fields.
Graylog dashboards do not offer the possibilities to my way of seeing that grafana has so our dashboard will do in grafana.
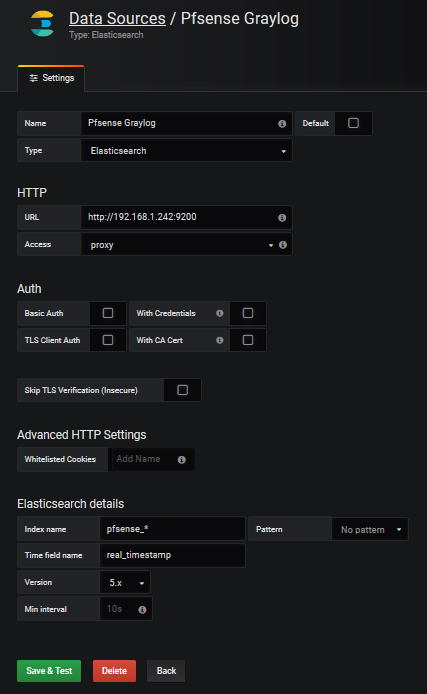
We create the datasource in grafana which we will name Pfsense-Graylog
I share with you a predesigned dashboard in the official grafana site which could be imported.
We select Import dashboard
We upload the downloaded file Upload .json file and associate it with the datasource created for it.
We can already see the dashboard in action.