Debugging the engine
This page has some hints about debugging the engine.
See also Crashes for advice on handling engine crashes (specifically around obtaining stack traces, and reporting crashes in AOT Dart code).
First, make sure the appropriate version of the engine is built (see Compiling the engine).
Run your Flutter app with:
flutter run --local-engine=XXXX --local-engine-host=YYYYto run an app with the local engine where XXXX should be replaced with the version you wish to use. For example, use --local-engine=android_debug_unopt --local-engine-host=host_debug_unopt to run a debug android engine or --local-engine=ios_debug_sim_unopt --local-engine-host=host_debug_unopt to run a debug iOS simulator engine.
💡 TIP: When developing on a Mac with ARM (M CPU), use
--local-engine-host=host_debug_unopt_arm64.You can continue to use
host_debug_unopt(required for Intel Macs), but the engine will be run under Rosetta which may be slower. See Developing with Flutter on Apple Silicon for more information.
It is important to always have a host_XXXX version of the engine built when using a local engine since Flutter uses the host build's version of Dart.
You will need to add a new launch configuration in the launch.json file:
{
  "version": "0.2.0",
  "configurations": [
    {
      "name": "Launch (local engine)",
      "request": "launch",
      "type": "dart",
      "args": ["--local-engine", "XXX", "--local-engine-host", "YYY"]
    }

    // Other profiles below..
  ]
}If the engine roll is failing (see Autorollers), you can use git bisect on the engine repo to track down the offending commit, using the --local-engine and --local-engine-host arguments as described above to run the failing framework test with each version of the engine.
All OpenGL calls in Skia are guarded by either the GR_GL_CALL_NOERRCHECK or GR_GL_CALL_RET_NOERRCHECK macros. Trace events may be added in these macros to trace all GL calls made by Skia, for example in a patch like this.
Due to the number of events traced to the timeline, the trace buffer may be filled up very quickly. Unless you want to see only the traces for the past few frames, use an endless trace buffer (flutter run --endless-trace-buffer turns on an endless trace buffer).
Also, make sure to run your application with the --trace-skia flag.
Building with flutter --local-engine will set a LOCAL_ENGINE Xcode build setting in your Flutter application's ios/Flutter/Generated.xcconfig file. This will be set until you run flutter run again with either a different --local-engine option, or with none at all (which will unset it).
You can speed up your workflow by adding the --config-only flag to set up the Xcode build settings and plugins, but not compile the app. For example:
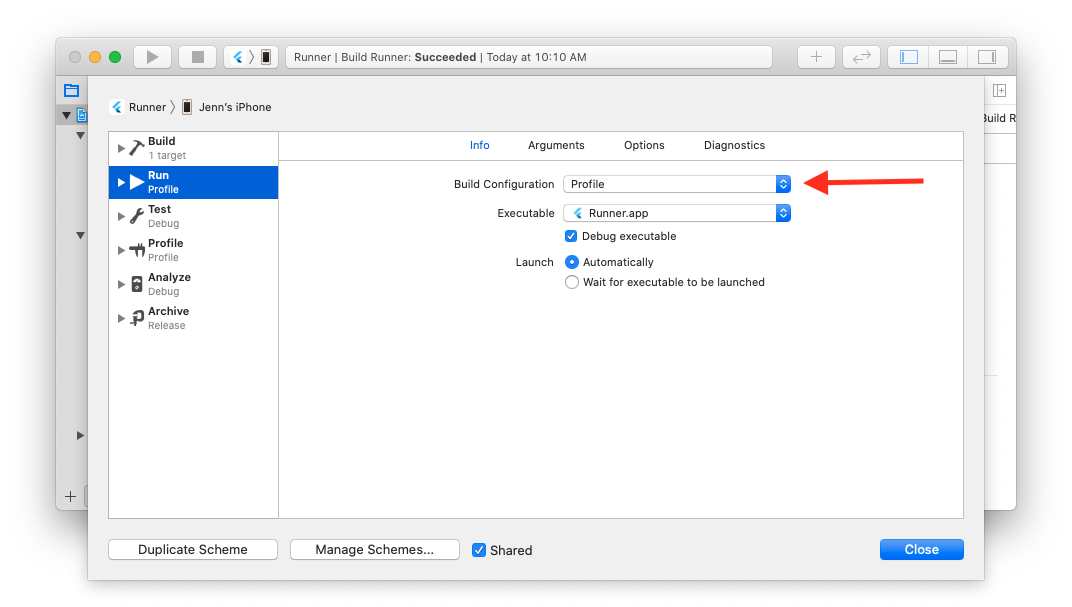
flutter build ios --local-engine ios_debug_unopt --local-engine-host host_debug_unopt --config-onlyTo start debugging, open your Flutter app ios/Runner.xcworkspace file in Xcode. Ensure Product > Scheme > Edit Scheme > Run > Build Configuration matches your engine runtime mode (defaults to Debug).
Add an engine symbol breakpoint via Debug > Breakpoints > Create Symbolic Breakpoint.... The Symbol field should be the engine symbol you're interested in, like -[FlutterEngine runWithEntrypoint:] (note the -[ prefix has no space).
You can also set a breakpoint directly with lldb by expanding Flutter > Runner in the Runner Project Navigator. Put a breakpoint in AppDelegate.swift's application(didFinishLaunchingWithOptions:) (Swift project) or main.m's main() (Objective-C project) and start the application by clicking the Run button (CMD + R). Then, set your desired breakpoint in the engine in lldb via breakpoint set -....
See https://github.com/flutter/engine/blob/master/sky/tools/flutter_gdb#L13
- Build the local engine with the
--no-strippedflag. - Decide on a Flutter app that you with to debug and run it with
flutter runand the local engine flags. i.e.:--debug --local-engine-src-path path/to/my/engine/src --local-engine=android_debug_unopt_arm64 - Open Android Studio and use
File > Profile or Debug APK. The location of the debug build APK should bebuild/app/outputs/apk/debug/app-debug.apkunder the Flutter app project. - To attach the debugger, use
Run > Attach Debugger to Android Process. For "Use Android Debugger Settings from" choose[Use default settings], and for "Debug Type" chooseNative Only. - Once attached, you can use Android Studio to open local engine C++ source files and set breakpoints.
Compiling the engine creates a Visual Studio solution file. You can use it to debug the engine:
- Launch your Flutter app using a locally built engine
flutter run -d windows --local-engine host_debug_unopt --local-engine-host host_debug_unopt - Using Visual Studio, open the engine's solution file
.\out\host_debug_unopt\all.sln - Open
Debug>Attach to Process...(or pressCTRL+ALT+P) - Choose your Flutter app using either
Select Window, or, the list of available processes. - Press the
Attachbutton
Building a Flutter app also creates a Visual Studio solution file. You can use it to debug the engine, your app's runner, and your app's plugins:
-
Build your Flutter app using a locally built engine using
flutter build windows --debug --local-engine host_debug_unopt --local-engine-host host_debug_unopt -
Using Visual Studio, open the Flutter app's
.\build\windows\<project_name>.sln -
In the
Solution Explorerpane, right click the project whose name matches your app, and selectSet as Startup Project
-
Now run your app by pressing
F5orDEBUG>Start Debugging. This will launch your app with Visual Studio's debugger attached.
Read this guide to learn how to debug C++ using Visual Studio.
Once you have built the engine, you'll find the unstripped libraries in out/host_debug_unopt/lib.unstripped, and the executables in out/host_debug_unopt/exe.unstripped.
So, for instance, to run the unit tests under the debugger you would execute:
flutter/tools/gn --runtime-mode=debug --unoptimized
ninja -C out/host_debug_unopt
gdb out/host_debug_unopt/exe.unstripped/flutter_linux_unittests
And then debug the test normally using GDB commands.
To debug a Flutter app using GDB, the stripped flutter engine GTK library in the built application needs to be replaced with the unstripped one in the engine build output directory.
First, in your Flutter project, build your Flutter app using the local engine:
flutter build linux --debug --local-engine=host_debug_unopt --local-engine-host=host_debug_unopt lib/main.dartThen, replace the library in your Flutter application's build directory: build/linux/x64/debug/bundle/lib/libflutter_linux_gtk.so with a copy or symbolic link to the engine build's output file out/host_debug_unopt/lib.unstripped/libflutter_linux_gtk.so.
Then you can open it in the debugger with:
gdb build/linux/x64/debug/bundle/your_app_nameNote that this won't help you debug the Dart portion of the app: this is just for debugging the engine code. If you need to simultaneously debug the Dart portion, you can connect to the observatory port given when you run the app in gdb.
Flutter tool will by default parse out any non-error output from the engine. Error logs will be displayed. Logging is handled though the FML library's logging.h.

- Home of the Wiki
- Roadmap
- API Reference (stable)
- API Reference (main)
- Glossary
- Contributor Guide
- Chat on Discord
- Design documents
- Code of Conduct
- Issue triage reports (latest)
- Our Values
- Tree hygiene
- Issue hygiene and Triage
- Style guide for Flutter repo
- Project teams
- Contributor access
- What should I work on?
- Popular issues
- Running and writing tests
- Release process
- Flutter Framework Gardener Rotation
- Rolling Dart
- Manual Engine Roll with Breaking Commits
- Updating Material Design Fonts & Icons
- Postmortems and Retrospectives
- Hotfix Documentation Best Practices
- In case of emergency
- Landing Changes With Autosubmit
- Setting up the Framework development environment
- The Framework architecture
- API Docs code block generation
- Running examples
- Using the Dart analyzer
- The flutter run variants
- Test coverage for package:flutter
- Writing a golden-file test for package:flutter
- Managing template image assets
- Setting up the Engine development environment
- Compiling the engine
- Debugging the engine
- Using Sanitizers with the Flutter Engine
- Testing the engine
- The Engine architecture
- Flutter's modes
- Crashes
- more...
- Setting up the Packages development environment
- Plugins and Packages repository structure
- Contributing to Plugins and Packages
- Understanding Packages tests
- Plugin Tests
- Releasing a Plugin or Package
- more...