Due to lack of time and the fast development in the world of WebPerformance, we have decided to stop actively developing and maintaining OpenSpeedMonitor. We want to thank every user and contributor of OpenSpeedMonitor for using it, giving us feedback and helping us.
You can still use the latest release. At this point (June 2021), it should still work with the latest WebPagetest version, but we cannot gurantee any compatibilty. If you are interested in OpenSpeedMonitor, feel free to make changes and ask questions. We will try to help as much as possible.
Open Source Web Performance Monitoring.
Run it with docker-compose:
wget https://raw.githubusercontent.com/iteratec/OpenSpeedMonitor/master/docker/docker-compose.yml && docker-compose up
OpenSpeedMonitor automates web performance measurements based on WebPagetest. It also processes, aggregates and visualizes the results. So it perfectly fits the need for a continuous monitoring of your most important pages.
The timings you have to keep track of - always on expressive, well arranged dashboards. Without losing all the details of the single WebPageTests if needed!
OpenSpeedMonitor is published under Apache License 2.0, so feel free to use, adapt and do whatever you want with the code. If you extend functionality we would appreciate contributions. Technically, OpenSpeedMonitor is based on grails, a JVM based web framework leveraged by the programming language groovy.
In the following explanations all references to GUI elements of OpenSpeedMonitor are given in English, but the GUI is internationalized and comes with German as additional language.
OpenSpeedMonitor is great for automation of web performance measurements as well as for processing, analyzing and visualizing the measurement results. But it doesn't provide anything for actually running the performance measurements. Therefore, it is based on WebPageTest, which performs the measurements. So to run OpenSpeedMonitor, we assume you have installed and configured a private instance of WebPageTest. This instance should contain at least one WPT server with configured locations and measuring agent(s) behind the locations. An installation guide for private instances of WebPageTest can be found here.
OpenSpeedMonitor uses the RESTful API of WebPageTest for automation of performance measurements and getting the result's raw data. If you look at the system overview of WebPageTest OpenSpeedMonitor uses Automation API to run scheduled tests and get back results from WPT server like other external tools.
First thing you have to do after installation is to configure the components of your private WebPageTest instance. All you need is a running WebPageTest server which is available via HTTP(S) from your OpenSpeedMonitor instance. After a login you can reach the GUI to create a new WPT server object via menu entry Administration >> All Controllers >> WebPageTestServerController. You have to set correct Base Url of the WPT server in order to automate tests on that server. After creation of the server object you can use the Fetch locations button in order to get locations configured on that WPT server into OpenSpeedMonitor. That function uses the API function[wpt server BaseUrl]/getLocations.php of the WPT server to request its locations.
For the following environment components, objects get created in the OpenSpeedMonitor database (if they don't already exist) at startup:
- Browsers
- Internet Explorer
- Firefox
- Chrome
- Connectivity Profiles
- DSL 6.000 (6.000 mbit/s bandwidth down, 512 kbit/s bandwidth up, 50 ms additional RTT, 0 packet loss rate)
- UMTS (384 kbit/s bandwidth down, 384 kbit/s bandwidth up, 140 ms additional RTT, 0 packet loss rate)
- UMTS - HSDPA (3.600 kbit/s bandwidth down, 1.500 kbit/s bandwidth up, 40 ms additional RTT, 0 packet loss rate)
Additional objects such as additional browsers and/or connectivity profiles can be created via the OpenSpeedMonitor web GUI after startup.
After WPT server(s), locations and browsers of your measurement environment are set up you can start to automate web performance measurements for your private WebPageTest instance. To run your first measurement automatically, you will need:
-
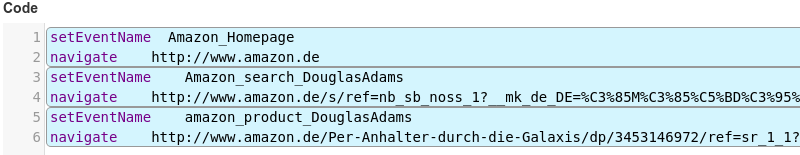
A WPT script
Describes what the browser should do during test execution. This can be a sequence of different pages that illustrate an entire use case of the web application under test. For each of the steps in the sequence a single result will be available after test execution. Single steps should be named via the
setEventNamecommand.Scripts have to be written in WebPageTest DSL. See scripting documentation for details.
Example measuring a single page:

Example surfing through an online shop to a product page:
If you have any further questions, please do not hesitate to contact us
-
A measurement job
Within a job you configure when to run the measurement and on which WPT location and browser to run it. You can also specify any advanced settings that you can set for an ad hoc measurement using Web GUI of the WPT server (e.g. Internet connectivity, whether to create a video or not, whether to create a TCP dump of the measurement or not, et cetera).
Views for managing scripts and jobs are available in the Measurement section of the OpenSpeedMonitor GUI. The list views can be filtered. Filters get persisted in the local storage of your browser, so that you do not lose your settings when navigating through the application.
Each time the OpenSpeedMonitor application is started, the measurements are generally disabled. So even if you set up measurements as described in previous section, none of your measurement jobs will start any measurements at all. You will have to activate the measurements once, initially in the job list view (requires login with admin rights).
Raw test result data
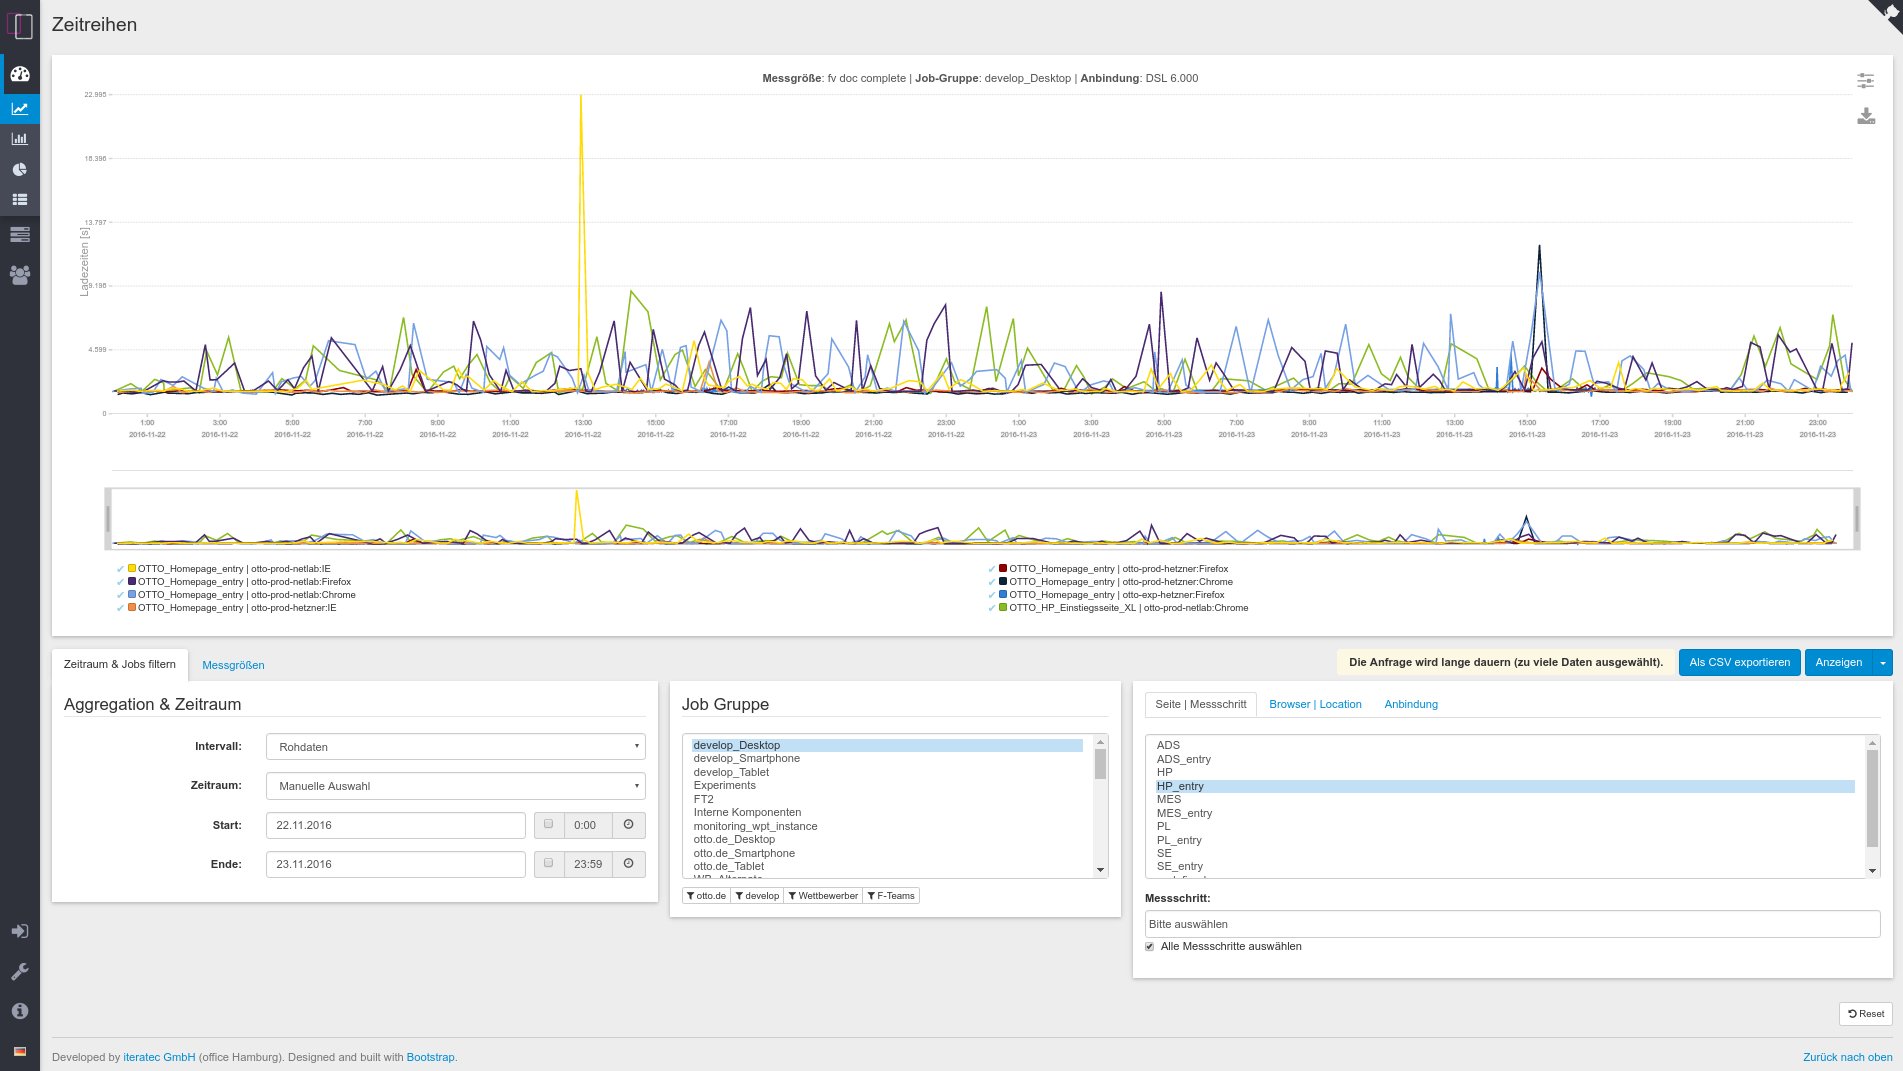
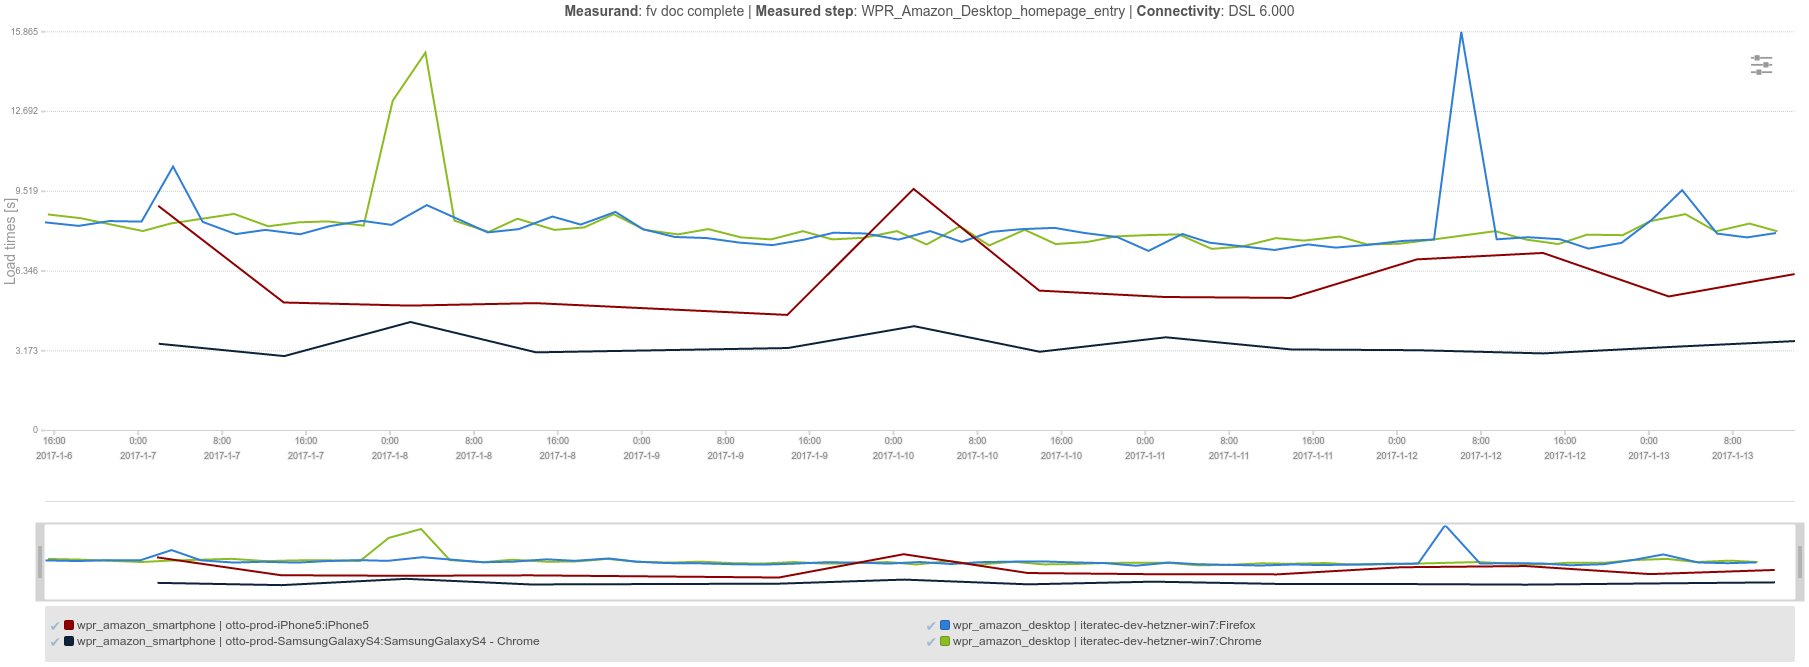
Trends in time of WPT results are available in Measurement results section.
Measurement data to be displayed in diagrams can be selected by three categories located in three different areas within the GUI.
-
Aggregation and timeframe
One can select the timeframe to be shown. Averages per timeframe can be built if necessary.
-
Filter jobs
One can filter the results of which jobs to show. Measurement jobs can be assigned to groups. Webpage types (like homepage or product page of online shops) can be configured and assigned to the measured steps. Browser and/or location tests can be used as filter criteria.
-
Choose measured variables
All the data WebPageTest provides on page level (first and repeated view) can be shown in diagrams of OpenSpeedMonitor. The measurands are categorized as follows for convenient selection and assignment to different y-axes of the diagram:
- Load times
- load time
- time to first byte
- start render time
- doc complete time
- visually complete time
- dom time
- fully loaded time
- Count of requests
- to doc complete
- to fully loaded
- Size of requests
- until doc complete
- until fully loaded
- Percentages
- customer satisfaction for doc complete
- customer satisfaction for visually complete
- Others
- speed index
- Load times
Single data points are clickable and lead to the underlying WebPageTest result with all its details.
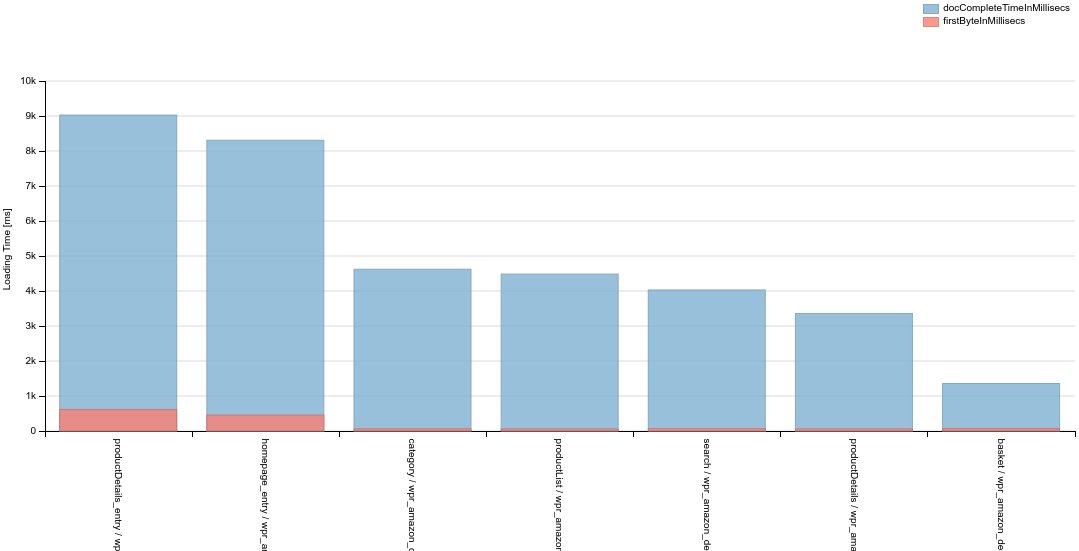
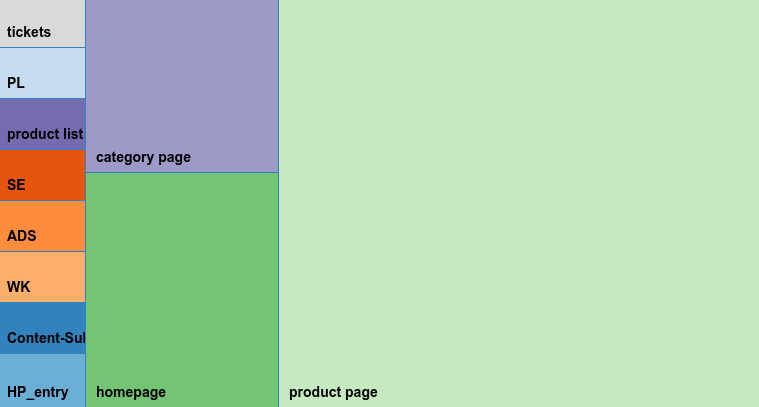
Results aggregated by measured pages
All the raw data measured with WebPageTest can be aggregated by page. These aggregations get visualized as barcharts on a dashboard.
OsmDetailAnalysis is a microservice that provides functionality to persist and analyze web performance waterfall data. It can be integrated with OpenSpeedMonitor in that it collects and stores the detailed waterfall data of all the measured pages within OpenSpeedMonitor jobs. The timings and sizes of all the single waterfall resources can be filtered and analyzed interactively in a dashboard based on dc.js.
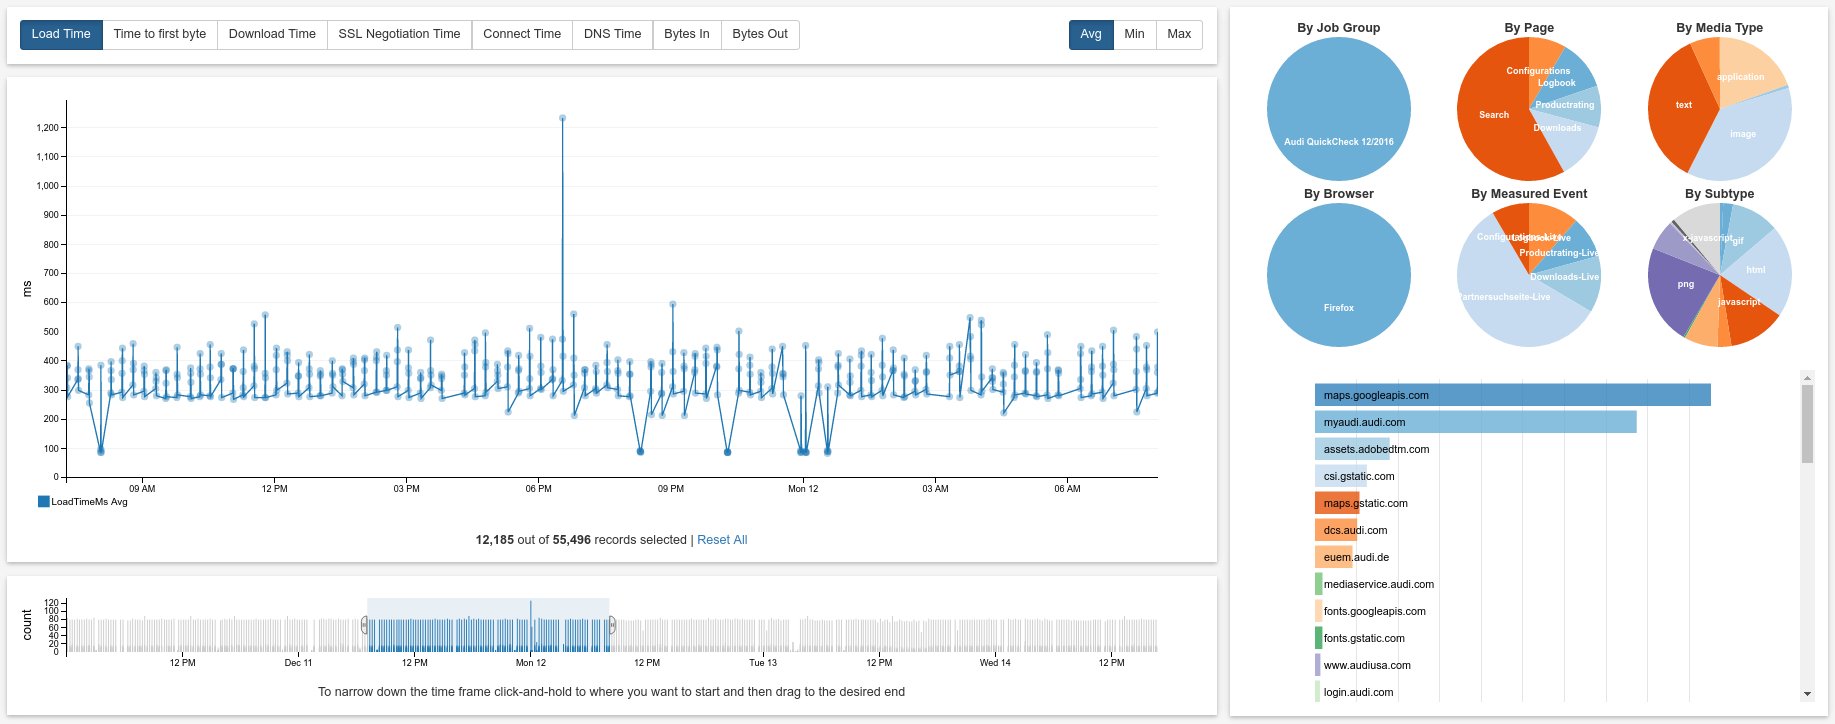
These type of analysis can be of great benefit detecting third-party libraries that slow down your site!
OsmDetailAnalysis is open source and licensed under same licence as OpenSpeedMonitor.
Compatibility with OpenSpeedMonitor:
| Version OpenSpeedMonitor | Compatible version OsmDetailAnalysis |
|---|---|
| 4.1.1 | 1.0.0 |
| >=4.1.2 | 1.1.0 |
Usually different pages of your application are of greatest interest regarding performance. To compare these different pages, raw pageload times are not always the best measure. Your users may expect and accept different load times for different types of pages. For example, 2.8 secs may be acceptable for the basket of your online shop, while it may be absolutely unacceptable for the homepage.
To take that fact into account OpenSpeedMonitor can translate load times of every test result into a percentage of customers who would be satisfied with that load time. OpenSpeedMonitor comes with five predefined mappings.
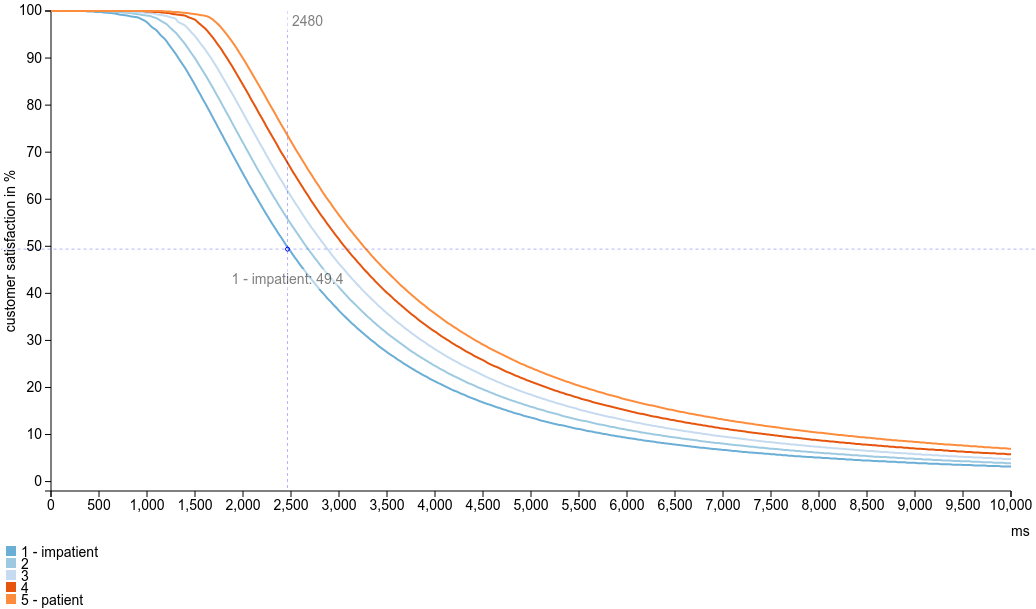
To translate load times into percentages of satisfaction one of these mappings can be applied to all your measured page types.
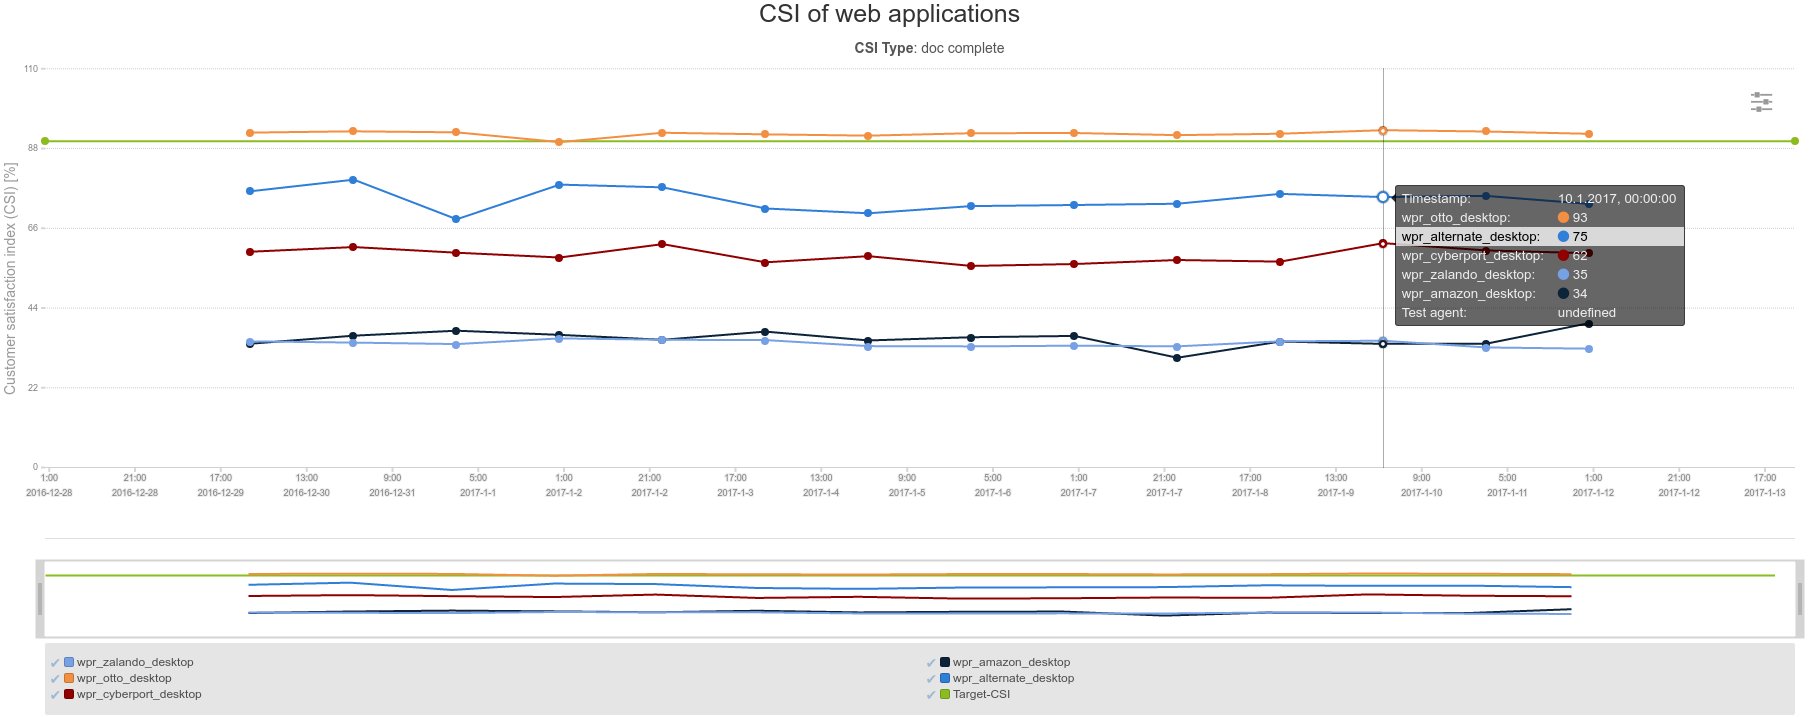
In addition, OpenSpeedMonitor provides the ability to calculate aggregated customer satisfaction indices for all the pages of your application and for the entire application. Results factored in the calculation of the pages CSI are weighted by browser, connectivity and hour of day to determine their importance for your application. Results factored in the calculation of applications CSI are weighted by pages according to their importance for your application.
The CSI is a KPI that is very suitable for getting a quick overview of the overall performance of your entire application. It can be used to setup a competitive benchmark in your branch of business.
-
Java runtime environment (JRE), version 8.
-
[optional] Dedicated servlet container.
Mainly tested with Apache Tomcat. Should run on most servlet containers. See full list of supported Java EE containers in grails documentation for further details.
-
[optional, but recommended] Relational database management system (DBMS).
Tested with MySQL. Should run with Oracle out of the box.
-
Operating system (OS) to run OpenSpeedMonitor can be any server OS for which JRE 8 and the servlet container and dbms of choice are available.
Mainly tested on debian.
-
Alternatively to run OpenSpeedMonitor directly on a server one can use docker-compose file in docker/ folder to run OpenSpeedMonitor in docker containers. All you need is the docker daemon on the target host in order to run OpenSpeedMonitor in docker. All the other prerequisites defined in this section aren't necessary because these already exist inside the containers.
As a grails application OpenSpeedMonitor is JVM and servlet API based. So its runtime environment is a servlet container. The deployment artefact of servlet API based web applications is a WAR file (web application archive).
One way to install OpenSpeedMonitor is to create a WAR file through running gradle assemble.
From project root on Linux/MAC:
./gradlew assemble
or on Windows:
./gradlew.bat assemble
Created WAR file can be deployed to servlet container of choice. See grails build documentation for details.
Since version 3 Grails is based on Spring Boot and so can be run easily in embedded tomcat container.
From project root on Linux/MAC:
./gradlew -Dgrails.env=prod bootRun
or on Windows:
./gradlew.bat -Dgrails.env=prod bootRun
Created WAR file can be deployed to servlet container of choice. See grails build documentation for details.
Like described in previous prerequisites section OpenSpeedMonitor can be deployed and run in docker containers. One can use docker-compose file docker/docker-compose.yml to start multiple containers via this simple call:
cd docker
docker-compose up
Grails framework implements convention over configuration pattern. So a lot of configuration settings are preset with sensible defaults and you won't have to touch them ever. Default configuration files are located in ./grails-app/conf/.
Configuration settings you have to change from defaults should be located in an external configuration file. A sample for such an external config file can be found in ./grails-app/config/OpenSpeedMonitor-config.yml.sample. A copy of that file can be located in
~/.grails/OpenSpeedMonitor-config.yml
Settings in that external config file will override defaults configured in ./grails-app/conf/ on startup.
In develop mode there are two users created for testing purposes:
- admin with password admin
- root with password root
If you're going to run OpenSpeedMonitor in prod-mode, you have to declare your admin and root in the external configuration file.
Code of OpenSpeedMonitor is licensed under Apache License 2.0.
To contribute to the code base or develop your own features you should be familiar with grails. Groovy and Javascript skills would be an asset, too.
OpenSpeedMonitor is a monolithic web application. Respective grails plugin structure several external plugins are integrated. Before publishing under Apache License we developed the tool under version control in an own git server. So older history can't be found on GitHub.
As IDE you can use Groovy/Grails Tool Suite from SpringSource, which is an eclipse bundle optimized for groovy and grails development. IntelliJ Idea has excellent groovy/grails support within its ultimate edition.
Although it works with an H2 in memory database out of the box it's highly recommended to develop and test with a relational database server like MySQL.