This project is a work in progress for a system dashboard tool that displays graphical dashboards in a terminal window with configurable data sources.
At the moment it supports data from parsing the syslog (SyslogDataTable), system process statistics from psutil (ProcDataTable), from the results of an Elasticsearch query (ElasticsearchDataTable) which can provide acesss to data collected by Elastic Beats like metricbeat for example, from SQL databases via ODBCDataTable, from CSV files ( general and an internal format) CSVDataTable, from JSON files ( internal format ) JSONDataTable, and from generic log files via regular expression extractions and a column schema LogDataTable.
There is a special type of data table which pulls data remotely from another system RemoteDataTable, you configure it with the ssh path to the server and the specification for the data table you want to generate and pull from there.
It will create a connection to that machine and install dashboard there using pip (or you can pre-install the current version in that user's ~/.local/bin directory).
It assumes that you have set a password for the ssh server target in your local keyring, the python keyring package comes with a command line tool where you can just say "keyring set servername username" and it will prompt you for the password and install it into the system keyring. This way no passwords have to be in any configuration.
It runs the dashboard utility on the target system with the option --server which provides a simple protocol over stdin/stdout to configure tables get their contents as json and refresh them as needed.
When the local dashboard shuts down it will shut down all of the remote dashboards.
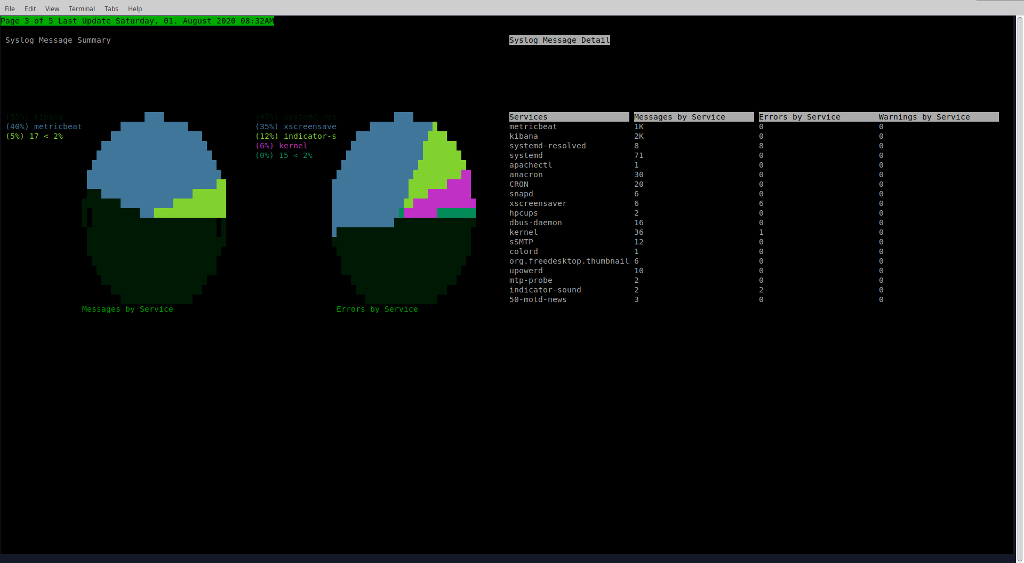
There are several graph types BarGraph, LineGraph (also supports area mode), PieGraph, and TableGraph all of these support multiple series on the same graph.
The dashboard is configured using a JSON config file and has a series of pages and each page can be configured into multiple panels containing multiple graphs.
You can either let dashboard lay out the pages, panels and graphs or you can provide fixed sizes and positions for the pages and panels.
The dashboard can be bigger than the current terminal window, and will scroll to show all the parts of each page.
In the example configuration the dashboard has auto tour turned on, it will visit each graph in 5 second intervals ( scrolling around each graph if the page is bigger than the terminal ).
You can interact with the dashboard with the keyboard and the mouse, the keyboard commands are:
- PgUp/PgDn move forward and back between pages
- Tab moves to the next graph, across pages
- Home/End move to the first page and first graph, and last page and last graph
- Arrow Keys move around if the page is bigger than the terminal
- Enter on a graph will zoom the graph to take of the whole terminal screen rescaling the graph, Esc exits zoom
- ( maybe this is a bug-feature but... ) holding down any other key will pause the auto tour on the current page until you release it
- Clicking the mouse on the leftmost column of the terminal will page up, rightmost column page down, upper left character is home, lower right character is end
Here is the current specification for the config file, there is an example one in the root of the source repository:
A config file is of the form:
{
  "tables" : list of table objects describing the data sources to be graphed in the dashboard below
      [
          {
          "name" : name to refer to this table below,
          "type" : one of "SyslogDataTable","ProcDataTable","ElasticsearchDataTable","RemoteDataTable","ODBCDataTable","CSVDataTable","JSONDataTable","LogDataTable" ( more to come),
          "refresh_minutes" : number of minutes to automatically refresh optional, 0 if only manual, default is 5 minutes
          "num_hours" : number of hours of history to look at
          "bucket_hours" : number of hours per bucket, table will have num_hours/bucket_hours entries
          "syslog_glob" : full unix glob pattern to match syslogs for the SyslogDataTable
          "es_index_pattern" : only for ElasticsearchDataTable, Elasticsearch index pattern wildcard to query
          "es_query_body" : { body of the query to execute as well formed JSON Elasticsearch DSL },
          "es_field_map" : [ array of tuples [ json_path ex "aggregations.3.buckets.key" matching the value you want, column name to append it to in the table, value type one of int,float,str,or date where date is a timestamp numerical value ]...]
          "ssh_spec" : for the RemoteDataTable a string of the form ssh://username@hostname:port to connect to the remote system
          "table_def" : for the RemoteDataTable one of these table definitions, defines the remote table to populate, assumes local keyring has credentials for user at hostname
          "sql_spec" : for the ODBCDataTable, a string of the following form to specify a connection to an odbc database odbc://username@server/driver/database:port, assumes local keyring has credentials at this spec so something like 'keyring set odbc://james@localhost/myodbc8w/james:5432 james',
          "sql_query" : for the ODBCDataTable, a sql query to execute on that database,
          "sql_map" : for the ODBCDataTable, a list of tuples of the form [[sql_column_name,data_table_column_name],...] only these columns will be mapped into the table
          "csv_spec" : for the CSVDataTable, path to CSV file to read,
          "csv_map" : for the CSVDataTable, column specification of the form [["csv_column_name","data_table_column_name","type one of _int,_float,_string,_date"],...] only imports matching columns,
          "json_spec" : for the JSONDataTable path to a JSON file to read, assumed to be in the format written by the data_sources.data_table.to_json function,
          "log_glob" : for the LogDataTable, glob of log files to read, can include compressed logs in .gz format,
          "log_map" : for the LogDataTable, list of line specifications of the form:
                   [ { "line_regex" : "escaped python regex with a group per field to extract",
                       "num_buckets" : number of buckets to aggregate in,
                       "bucket_size" : for integer and float buckets it is just the literal size, for strings it is ignored and the last num_buckets strings will form the buckets, for dates it is the number of minutes,
                       "bucket_type" : one of "_string","_date","_int","_float",
                       "column_map: [ [ regex group number 1..n, "Data Table Column Name", "type as above","action, one of key,min,max,avg,sum,median,mode, count(regex), key is special and indicates the bucket key, count matches the regex and the value of the column is the number of matches in the bucket
                      },...repeated matches with different keys can collect other aggregations and also handle different types of lines
                   ],
          "log_lookback" : a tuple of the number of days, hours, minutes to look back at logs [ days, hours, minutes ] all must be specified
          },
      ],
  "dashboard": definition of the dashboard to present
      {
      "auto_tour_delay" : integer seconds or 0 for no tour,
      "pages" : list of page objects defining pages of dashboard
          [
              {
                  "height" : height in characters, optional, -1 if not provided indicating to fill initial window,
                  "width" : width in characters, optional, -1 if not provided indicating to fill initial window,
                  "panels" : list of panel objects defining how this page is divided up
                      [
                          {
                          "y" : vertical offset in page in characters optional, -1 if not provided saying to have the container lay out the panel,
                          "x" : horizontal offset in page in characters optional, -1 if not provided saying to have the container lay out the panel,
                          "height" : height in characters optional, -1 if not provided saying to have the container lay out the panel,
                          "width" : width in characters optional, -1 if not provided saying to have the container lay out the panel,
                          "graphs" : list of graph objects to be laid out in this panel
                              [
                                  {
                                  "type" : one of "LineGraph","BarGraph","PieGraph","TableGraph"
                                  "table" : name of table from tables list above,
                                  "xseries" : name of the column in the table that represents the x axis values or pie labels for the graph,
                                  "yseries" : [ list of column names of series to graph against the xseries ],
                                  "yunit" : name of the units on the Y axis Bar and Line Graph only,
                                  "top" : for graphs that support top-n selection it defines how many top items from the columns to graph, default is 0 which graphs all values in column,
                                  "title" : title of this graph defaults to name of data table,
                                  "area" : for LineGraph draw this as an area chart filling under the curve, defaults to False
                                  },
                              ]
                          },
                      ]
              },
          ]
      }
}
You can install from pypi by doing:
python3 -m pip install terminal-dashboard
The dashboard script will be on the ~/.local/bin directory which you should add to your path.
OR
You can check out the repo and run the dashboard script in the scripts directory. Remember to add the repo directory to your PYTHONPATH so it can find it's modules.
An example config file is provided in the root directory.
Usage: dashboard [options]

A dashboard to display pages of graphs of data from multiple sources and
refresh them

Options:
  -h, --help            show this help message and exit
  -c CONFIG, --config=CONFIG
                        Path to dashboard config file, defaults to
                        ~/.dashboard/config
  -s, --server          Start in server mode, read commands from stdin and
                        write responses to stdout
  -v, --verbose         Log all activity to console
  -V, --version         Print the version of the script and exit
To run the tests you can either do: ./runtests or ./runcoverage in the top level directory, works best in a non-full-screen terminal window because it wants to resize the window Packages required are: pytest and coverage
To make a release you can do: ./mkrelease #.#.#
To make the documentation you can do: ./mkdocs Packages required are: pdoc
Feel free to submit pull requests if you've implemented a change and it passes the tests or you've fixed/added tests
Coming soon:
-
A plugin system for extending data sources and graph types, partly done, needs testing/examples -
Interactions with graphs, drilldowns, mouse actions etc... -
Better API documentation and developer documentation, partly done, needs cleaning and updating -
Improved graph layout for highly compressed graphs -
Checkpointing some of the data sources so they don't have start from scratch on restart -
JSON format log parsing -
Historical static views of dashboards collected at some interval -
Reading a CSV table from stdin and making it available for a dashboard -
Keystroke to save a snapshot of the dashboard on demand