Hatching color in contourf function. #2789
Comments
|
Afraid not. It can obviously be controlled by drawing the contour twice, but that doesn't answer your question. This is high on my personal TODO list, but then my personal TODO is pretty large 😄... Anyway, I hope having an answer (even if it is a negative) is helpful. I'm going to go ahead and close the issue as it is the kind of feature which I'd love to see, but isn't a bug so to speak. Cheers! |
|
Thank you Phil)) Cheers |
|
Hi @pelson , what about renaming the issue to a Feature Request and leave it open, just in case someone feels like implementing it? ;-) Would it be difficult to do? I have only a superficial knowledge of mpl internals... |
|
Hatching gets a bit hairy because it is implemented differently in the On Fri, May 27, 2016 at 10:23 AM, Fabien Maussion notifications@github.com
|
|
Hi. How can I change the color of hatching? I see like it might be possible by drawing twic,e but couldnt understand how. currently my graph looks like:
|

|
So I needed to plot hatched, coloured, contourf areas to denote an excluded region. This was the first hit that google gave me and it set me in the right direction. In case anyone else comes here looking for the same here is how I added colour to the hatching of contourf; Clearly you will need to adapt it if you want more than one hatch style, or more than one colour. |
|
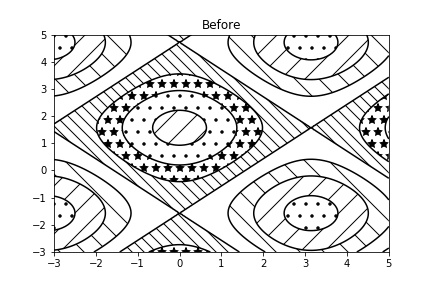
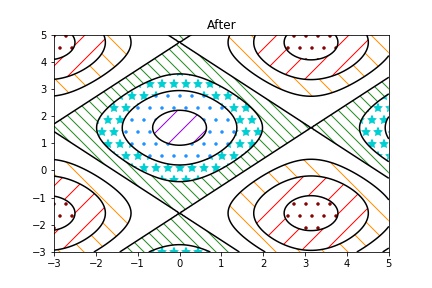
Funnily enough, I was also trying to do coloured hatching with contourf at the same time as @HenryDayHall, and he posted to this 3 year old issue while I was composing my own reply. Here is how I got contourf with different colour hatching for each level. To do it, you run contourf once, and then loop over all the levels in the output to change the colour of the hatches. This means you can have a different colour for the hatches in each level. # Content as in example
# ------------------------------
import matplotlib.pyplot as plt
import numpy as np
# invent some numbers, turning the x and y arrays into simple
# 2d arrays, which make combining them together easier.
x = np.linspace(-3, 5, 150).reshape(1, -1)
y = np.linspace(-3, 5, 120).reshape(-1, 1)
z = np.cos(x) + np.sin(y)
# we no longer need x and y to be 2 dimensional, so flatten them.
x, y = x.flatten(), y.flatten()
# a plot of hatches without color with a legend
plt.figure()
n_levels = 6
plt.contour(x, y, z, n_levels, colors='black', linestyles='-')
cs = plt.contourf(
x, y, z, n_levels, colors='none',
hatches=['.', '/', '\\', None, '\\\\', '*'],
extend='lower',
)
plt.title('Before')
plt.savefig("mpl_test_before.jpeg")
# ------------------------------
# New bit here that handles changing the color of hatches
colors = ['maroon', 'red', 'darkorange', 'gold', 'forestgreen',
'darkturquoise', 'dodgerblue', 'darkviolet']
# For each level, we set the color of its hatch
for i, collection in enumerate(cs.collections):
collection.set_edgecolor(colors[i % len(colors)])
# Doing this also colors in the box around each level
# We can remove the colored line around the levels by setting the linewidth to 0
for collection in cs.collections:
collection.set_linewidth(0.)
# ------------------------------
plt.title('After')
plt.savefig("mpl_test_after.jpeg")
|
|
@scottclowe this works for me, thank you! I did notice however that these colors do not show up in the colorbar if you add one. Any suggestions for that? |
|
@annemoree How about this? It's using legend, like in the original post, instead of colorbar. I wasn't able to get colorbar to work for the base case, so please share example code if it's important to you that it is with a colarbar instead of legend. # ------------------------------
# Original code like in example
import matplotlib.pyplot as plt
import numpy as np
# invent some numbers, turning the x and y arrays into simple
# 2d arrays, which make combining them together easier.
x = np.linspace(-3, 5, 150).reshape(1, -1)
y = np.linspace(-3, 5, 120).reshape(-1, 1)
z = np.cos(x) + np.sin(y)
# we no longer need x and y to be 2 dimensional, so flatten them.
x, y = x.flatten(), y.flatten()
# a plot of hatches with color with a legend
fig = plt.figure()
n_levels = 6
ax = plt.contour(x, y, z, n_levels, colors='black', linestyles='-')
cs = plt.contourf(
x, y, z, n_levels, colors='none',
hatches=['.', '/', '\\', None, '\\\\', '*'],
extend='lower',
)
# create a legend for the contour set
artists, labels = cs.legend_elements()
# Set the bbox so the legend appears outside the axes
plt.legend(artists, labels, handleheight=2, bbox_to_anchor=(1.04, 1), loc="upper left")
plt.title('Before')
plt.savefig("mpl_test_before.jpeg", bbox_inches="tight")
# ------------------------------
# New code that handles changing the color of hatches
colors = ['maroon', 'red', 'darkorange', 'gold', 'forestgreen',
'darkturquoise', 'dodgerblue', 'darkviolet']
# For each level, we set the color of its hatch
for i, collection in enumerate(cs.collections):
collection.set_edgecolor(colors[i % len(colors)])
# Doing this also colors in the box around each level
# We can remove the colored line around the levels by setting the linewidth to 0
for collection in cs.collections:
collection.set_linewidth(0.)
# ---------------
# Handle creating legend with colors of hatches as in the figure
# create a legend for the contour set
artists, labels = cs.legend_elements()
# For each level, we set the color of its hatch in the legend too
for i, artist in enumerate(artists):
artist.set_edgecolor(colors[i % len(colors)])
plt.legend(artists, labels, handleheight=2, bbox_to_anchor=(1.04, 1), loc="upper left")
# This fixes the color of the hatch in the legend, but unfornutately also changes
# the color of the bounding box around it
# ---------------
plt.title('After')
plt.savefig("mpl_test_after.jpeg", bbox_inches="tight")
|


|
How foolish of me! We can of course fix the appearance of the bounding boxes in the legend using the same # ------------------------------
# Original code like in example
import matplotlib.pyplot as plt
import numpy as np
# invent some numbers, turning the x and y arrays into simple
# 2d arrays, which make combining them together easier.
x = np.linspace(-3, 5, 150).reshape(1, -1)
y = np.linspace(-3, 5, 120).reshape(-1, 1)
z = np.cos(x) + np.sin(y)
# we no longer need x and y to be 2 dimensional, so flatten them.
x, y = x.flatten(), y.flatten()
# a plot of hatches with color with a legend
fig = plt.figure()
n_levels = 6
ax = plt.contour(x, y, z, n_levels, colors='black', linestyles='-')
cs = plt.contourf(
x, y, z, n_levels, colors='none',
hatches=['.', '/', '\\', None, '\\\\', '*'],
extend='lower',
)
# create a legend for the contour set
artists, labels = cs.legend_elements()
# Set the bbox so the legend appears outside the axes
plt.legend(artists, labels, handleheight=2, bbox_to_anchor=(1.04, 1), loc="upper left")
plt.title('Before')
plt.savefig("mpl_test_before.jpeg", bbox_inches="tight")
# ------------------------------
# New code that handles changing the color of hatches
colors = ['maroon', 'red', 'darkorange', 'gold', 'forestgreen',
'darkturquoise', 'dodgerblue', 'darkviolet']
# For each level, we set the color of its hatch
for i, collection in enumerate(cs.collections):
collection.set_edgecolor(colors[i % len(colors)])
# Doing this also colors in the box around each level
# We can remove the colored line around the levels by setting the linewidth to 0
for collection in cs.collections:
collection.set_linewidth(0.)
# ---------------
# Handle creating legend with colors of hatches as in the figure
# create a legend for the contour set
artists, labels = cs.legend_elements()
# For each level, we set the color of its hatch in the legend too
for i, artist in enumerate(artists):
artist.set_edgecolor(colors[i % len(colors)])
# Doing this also colors in the bounding box around each level in the legend
# We can remove the colored line in the legend by setting the linewidth to 0
artist.set_linewidth(0.)
plt.legend(artists, labels, handleheight=2, bbox_to_anchor=(1.04, 1), loc="upper left")
# ---------------
plt.title('After')
plt.savefig("mpl_test_after.jpeg", bbox_inches="tight")
|


It is possible to do hatching of regions using contourf function in matplotlib. Below is a working example I took from the matplotlib website. What I would like to do is to change the color of the hatching if it is possible. I tried to specify edgecolor, color and facecolor but it does not seem to work.. Thanks
The text was updated successfully, but these errors were encountered: