The Power of the Peak Panel
The peak panel, shown below is a very powerful tool for understanding your data. A lot of useful features open up by right clicking on the peak panel. Note, this page will introduce features present in Version 6 and above, so if you are using an older version and don't see some of the options, please upgrade. If there are new options added that I forget to add here, send me an email and remind me to add them.

After you select peaks, the peak panel is populated with each peak that is detected. Key features for each peak are displayed: A color, a marker, the mass, the intensity (peak height), the DScore, and the name.
The name, markers, and colors are populated automatically, and each can be adjusted. You can set the automatic color map in the Additional Plotting Parameters tab. To manually adjust the color, right click on a peak and select "Color Select". You can also select "Marker Select" to choose a different marker or select "Rename Peak" to rename the peak.
You can also assign the names using the "Tools > Oligomer and Mass Tools". After you have matched the peaks in that window and clicked "Ok", it will update the names to match the matched assignments.
Finally, it is possible to "Color by Score", which colors the peaks based on their DScore values. Green is good.
If you only want to see a subset of the available peaks, you can do this by clicking either "Ignore" to remove selected peaks from the lists and plots or clicking "Isolate" to ignore any peak not selected. You can select one or more peaks to isolate and ignore. If you want to get back all of the peaks you've ignored, simply click "Repopulate".
There are a handful of tools that let you select a peak and label something about that peak on the plot. The oldest feature is the "Label Charge States", which labels the charge ladder for a single selected peak. Other options let you label the names, intensities, and masses directly on the plot. You can do this for either selected peaks or all peaks. You can also "Display Differences From", which labels the mass difference between each peak and the selected mass, or "Display Consecutive Differences", which labels the mass difference between adjacent peaks.
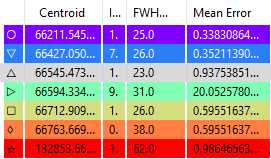
To understand the potential uncertainties in your data, right click on any peak and select "Centroid and Uncertainty". You will see the values change to look like this. There are three new columns. For more on these, see this Critical Insight Article.
- Centroid: Gives the center of mass for the peak. It cuts off everything outside of the FWHM, so it really only considers the centroid of the center of the peak.
- FWHM: The full-width at half-max of the peak measured from the deconvolved mass distribution.
- Mean Error: The weighted standard deviation (weighted by the intensity of each charge state) of the apex mass for each charge state. Basically, UniDec will calculate the peak mass for each charge state and take the weighted standard deviation of these masses. Any peaks below a 1% threshold for the charge state distribution are cut off.
Note, as mentioned in this Critical Insight Article, I prefer replicate measurements to estimate uncertainty. Use at your own risk. For MetaUniDec, it will report the Mean Error as the weighted standard deviation between different spectra, which is an easy way to calculate the uncertainty from replicate measurements!
If you want to go back to the previous display, simply right click and select "Hide Uncertainties".
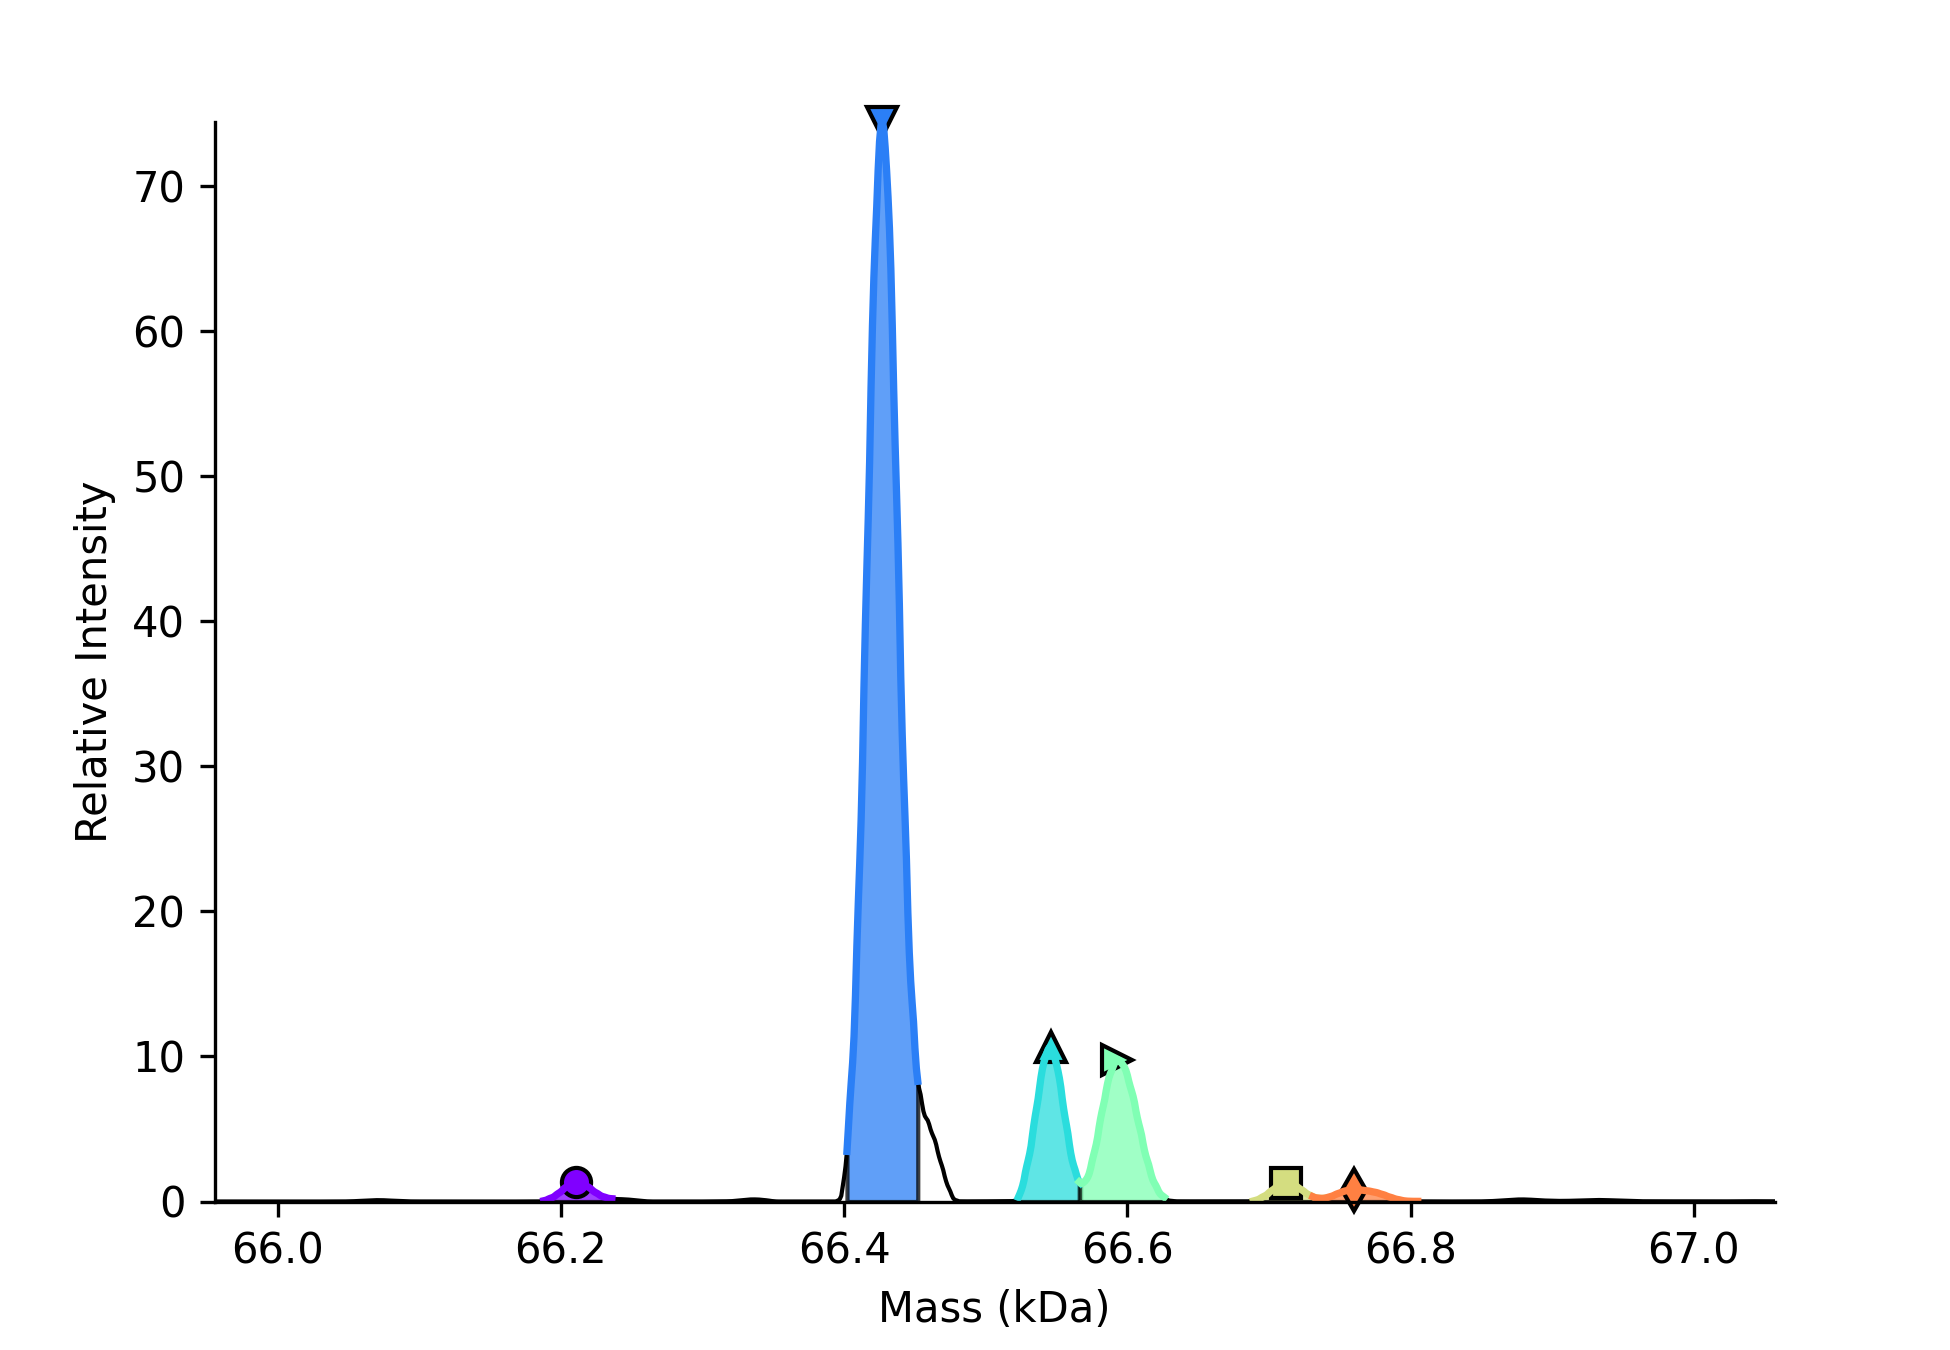
A new feature in Version 6, you can now color all or select peaks to match the color in the table. The width of the coloring can be controlled by the integration range, see Peak Selection and Plotting.
UniDec is constantly writing the _peaks.txt file with basic information about the peaks. If you'd like to just quickly copy this into a spreadsheet or something, you can right click and select "Copy All Basic". This will copy the key peak info to the clipboard for pasting.
You can also do "Copy All Full", which will copy a range of peak data, some of which may not be populated yet. Here's an example.
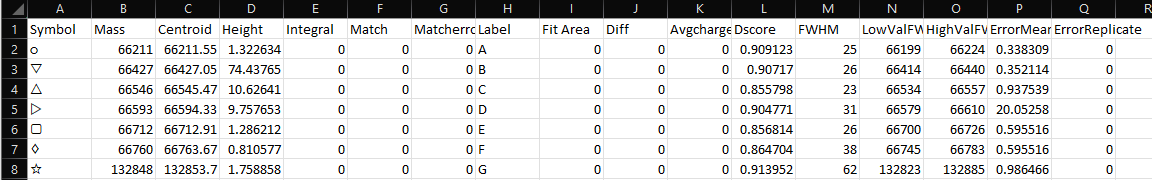
Note, you can get this information and extra by clicking "Analysis > Export Peak Parameters and Data" and looking for the _peakparam.dat file. You can find more info about that in this link.