layers overview
A layer in d3.chart encapsulates a single chain of:
- binding data to elements
- inserting new elements
- handling lifecycle events and their callbacks
For example:
- In a bar chart, a layer might constitute the set of bars that are rendered in accordance with the data
- In a treemap, a layer might be the set of rectangles that make up the area of the treemap.
- In a map that has 3 different type of marks, each set of markers might constitute a different layer.
You can have multiple layers all referencing the same data. In fact, by default, each layer will take the data that was returned from the transformed data that the chart was drawn with. A layer can only bind data once to a single type of element.
Take for example (jsBin) the following d3 chart that renders red circles along an x-axis and adds labels above the circles with the value being drawn like so:
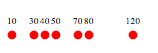
var data = [10,30,40,50,70,80,120];

// make our chart base
var chart = d3.select("#test")
  .append("svg")
  .attr("height", 200)
  .attr("width", 200);

// draw the circles
var circles = chart.append("g")
  .selectAll("circle")
  .data(data)
  .enter()
    .insert("circle")
    .attr("cx", function(d) { return d; })
    .attr("cy", 100)
    .attr("r", 4)
    .style("fill", "red");

// draw the labels
var labels = chart.append("g")
  .selectAll("text")
  .data(data)
  .enter()
    .insert("text")
    .attr("x", function(d){ return d; })
    .attr("y", 90)
    .style("font-size", 8)
    .style("text-anchor", "middle")
    .text(function(d) { return d; });
Looking at the above code, it's pretty clear that we have two conceptual layers: "circles" and "labels." How would we go about creating this chart with d3.chart?
d3.chart("CircleChart", {
  initialize: function() {

    // create a circle layer
    this.layer("circles", this.base.append("g"), {

      // make the selection that data should be bound to and bind
      // the date to it.
      dataBind: function(data) {
        return this.selectAll("circle")
          .data(data);
      },
      insert: function() {
        // return a new selection insertion.
        return this.insert("circle")
          .attr("cy", 100)
          .attr("r", 4)
          .style("fill", "red");
      },
      events: {
        // when new data come in, put it through the
        // enter callback, positioning the circles according to
        // the data points
        "enter": function() {
          this.attr("cx", function(d) {
            return d;
          });
        },

        // when data points are removed, remove the corresponding
        // selected elements.
        "exit": function() {
          this.remove();
        }
      }
    });

    // create a labels layer
    this.layer("labels", this.base.append("g"), {
      dataBind: function(data) {
        return this.selectAll("text")
          .data(data);
      },
      insert: function() {
        return this.insert("text")
          .attr("y", 90)
          .style("font-size", 8)
          .style("text-anchor", "middle");
      },
      events: {

        // for new data points, position the labels along the
        // data value on the x axis and set their text content
        // to the value itself.
        "enter": function() {
          return this.attr("x", function(d){
            return d;
          }).text(function(d) {
            return d;
          });
        },

        // when data points are removed, remove the corresponding
        // selected elements.
        "exit": function() {
          this.remove();
        }
      }
    });
  }
});

var data = [10,30,40,50,70,80,120];
var chart = d3.select("#vis")
  .append("svg")
  .style("width", 200)
  .style("height", 200)
  .chart("CircleChart");

chart.draw(data);