Preview
epumgmt is a tool for bootstrapping IaaS based services that:
- Do not disappear because failures are compensated with replacements.
- Can be configured by policy to be "elastic" if the service can coordinate any number of participant instances being launched to join in the work -- and can tolerate instances dropping out.
The EPU system is made up of two central software components:
- A provisioner service that is used to launch IaaS instances and make sure they contextualize as desired.
- Each service being "EPU-ified" has a dedicated group of EPU services responsible for making sure that the service has the capacity desired by policy for the situation at hand.
A full design document is forthcoming, architectural information can be found on this page.
Currently using the epumgmt tool depends on having some external dependencies in place:
- An external Nimbus context broker
- An external RabbitMQ instance
- EC2 or Nimbus IaaS installation
We'll be using EC2 in this preview so you'll need an account there. We'll talk about how to non-painfully get access to the other things later on.
Using EC2 or Nimbus, the epumgmt tool currently launches a Provisioner node and another node we'll just call "sleeper EPU support node" for now. The actual sleeper service is something that the epumgmt tool does not itself launch. The sleeper service nodes are launched on-demand by the sleeper EPU support node.
Here is how it all looks (remember that this is a preview, one of the pieces missing here are supervisors).

epumgmt launches the Provisioner and sleeper EPU support nodes. Something sending AMQP messages in the system to the sleeper service will fill the sleeper service's message queue -- this is represented by "Work requester" in the diagram. The sleeper service nodes are started dynamically and actually do the requested work (sleeping, zzz).
The sleeper EPU support node is a VM instance that has the following services running on it:
- EPU Controller for the sleeper service
- Sensor Aggregator for the sleeper service
- Work producing service for the sleeper service
These could live on the same VM as the Provisioner, it's not required to be a separate VM instance. But the intent is to keep logically separate things separate, hope the extra pennies per hour are not a problem. The work producing service is piggybacking on here for convenience, this could be anywhere in the larger system of course.
There are only a few policy configurations that can be chosen currently. Policies can only be configured at launch-time currently.
The main policy configuration you will work with in this preview is "min_instances".
The "min_instances" configuration will make it so that there is always a certain number of workers in the pool. If a worker dies, it will be replaced. You will go through a demonstration of this later.
There is a problem with the queue length querying code that uses the direct Erlang protocol. This is being addressed shortly with a design to make a service colocated with the messaging broker. Thus any remote interactions to get the queue length readings will be done over the regular messaging frameworks.
The "queuelen_high_water" and "queuelen_low_water" configurations will then come into play. This functionality does work already when the queue-length readings are present in the system (the problem we are having is reliably getting them into the system).
These configurations will cause the infrastructure to look at pending messages in the message queue to make decisions.
- When the high water is passed, the queue is considered backed-up and a compensating node is launched.
- When the queue's pending message count drops below the low water configuration, a node is taken away.
- If there is still work on the queue, the node count will not drop to zero.
- Also you can force the minimum node issue by setting the 'min_instances' configuration.
First, get the recent epumgmt software.
You may want to use a virtualenv:
$ virtualenv --python=python2.6 --no-site-packages epumgmt-deps
$ source epumgmt-deps/bin/activate
Sample setup, note the git tag checkout!
$ easy_install fabric boto simplejson
$ git clone git://github.com/nimbusproject/cloudyvents.git
$ git clone git://github.com/nimbusproject/cloudminer.git
$ cd cloudyvents
$ python setup.py install
$ cd ../cloudminer/
$ python setup.py install
$ cd ..
$ git clone git://github.com/nimbusproject/epumgmt.git
$ cd epumgmt
$ git checkout -b preview1 epupreview1
$ ./sbin/check-dependencies.sh
You need an EC2 account loaded into the environment, for example:
$ export AWS_ACCESS_KEY_ID=`cat ~/.ec2/AWS_ACCESS_KEY_ID`
$ export AWS_SECRET_ACCESS_KEY=`cat ~/.ec2/AWS_SECRET_ACCESS_KEY`
You need a Nimbus account loaded into the environment for the context broker:
$ export NIMBUS_KEY=`cat ~/.nimbus/NIMBUS_KEY`
$ export NIMBUS_SECRET=`cat ~/.nimbus/NIMBUS_SECRET`
You could set up your own context broker, but for now just get an account on the public, standalone context broker, email nimbus@mcs.anl.gov for credentials.
You need to set up an SSH key in your EC2 account with the name 'ooi' in Amazon's system. Download the private key to your computer under as "~/.ssh/ooi.pem"
Launch a RabbitMQ node. This will be encapsulated as part of the bootstrap process in future EPU iterations. There is a very easy way to do this, go to this RabbitMQ page and note the AMI you'd like (tested with ami-3ecc2e57 (small) and ami-36cc2e5f (large)). Start it up using EC2 commandline tools or web application. You will need to use a security group that opens port 5672, here is what the tested one looks like in the AWS control panel:
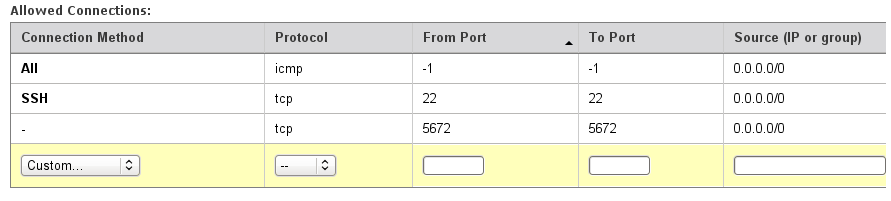
Note the RabbitMQ IP address.
You now need to set up some specific configurations with a json file that will be input to the program. Put this anywhere:
$ cp share/epumgmt/variables.json.sample ~/myvars.json
Edit the file with the IP address of the Rabbit node you launched.
So for example:
$ host ec2-184-73-138-200.compute-1.amazonaws.com
ec2-184-73-138-200.compute-1.amazonaws.com has address 184.73.138.200

$ nano -w ~/myvars.json
Then:
"broker_ip_address":"184.73.138.200",
You can leave the rest of the configurations in the JSON file alone for now.
Next we will configure the EPU policy we'd like for this service.
The relevant configuration is the 'min_instances' setting of the 'engine_conf' group of settings in "etc/epumgmt/services/sleeper_bounded.chefroles.json"
Leave this at two or more for the first go-through. Setting it to zero or one will not exercise the full demo below.
Remember to have all the AWS and NIMBUS variables exported in the launching environment (see above).
Note how the same name "run1" is used for each invocation. This has to be the same across invocations in order to keep things coordinated.
The tool will support running many "realms" where there is one provisioner and many different EPU-ified services. Each "realm" is and will be identified by a unique run name (this term will probably change to something other than "run").
Make a variable for your current run name:
export RUN_NAME="run1"
Launch the provisioner:
$ ./bin/epumgmt.sh --name $RUN_NAME --action create --haservice provisioner --jsonvars ~/myvars.json
Once that launches, run:
$ ./bin/epumgmt.sh --name $RUN_NAME --action create --haservice sleeper --jsonvars ~/myvars.json
Depending on your configuration, VMs will launch immediately or not. You can check what is happening with the provisioner by using the status command:
$ ./bin/epumgmt.sh -n $RUN_NAME -a status
Sample output:
running | provisioner | i-2f011575 | ec2-25-101-230-255.compute-1.amazonaws.com
running | sleeper     | i-130c1829 | ec2-154-73-0-67.compute-1.amazonaws.com
For the status command to become aware of new worker nodes, you need to have the epumgmt tool scan for launches:
$ ./bin/epumgmt.sh -n $RUN_NAME -a find-workers-once
Afterwards, run status again.
Note that all of the output from those commands is being logged to a text file for later reference if necessary.
$ ls var/epumgmt/logs/
To interact with the work launcher (that launches new sleeping jobs), there is a simple HTTP call to make.
Note: this is a demo of work going through the system, a real application would be submitting with normal means (by AMQP or in some future configuration using anything that the EPU-ified service expects, such as PBS).
Note the hostname of the EPU services node ("sleeper"), using the status command (see above):
$ SLEEPERHOST="ec2-154-73-0-67.compute-1.amazonaws.com"
Before, you noted the hostname of the "sleeper" EPU node that we launched in the SLEEPERHOST environment variable.
Now, send some sleep jobs.
$ wget http://$SLEEPERHOST:8000/run1/0/2/120
The URL is structured like so. Not very pretty, but again this is a simple demo to exercise the system.
$ wget http://$SLEEPERHOST:8000/$BATCHNAME/$START_IDX/$NUMJOBS/$SLEEPSECS
- SLEEPERHOST="address sleeper EPU node gets"
- BATCHNAME="name of this batch of jobs, anything you want"
- START_IDX="integer of first job id, rest are incremented"
- NUMJOBS="number of jobs to kick off"
- SLEEPSECS="length in seconds worker should sleep"
OK, let's try to find job activity in the logs.
Start by getting the most recent logs:
$ ./bin/epumgmt.sh --name $RUN_NAME --action find-workers-once
$ ./bin/epumgmt.sh --name $RUN_NAME --action logfetch
Rudimentary way to look for job events will suffice for now:
$ grep -R job_ var/epumgmt/runlogs/$RUN_NAME
Here's what each "job_" event is:
- job_sent - This is an event recorded by work producing service (which happens to live on the "sleeper" node).
- job_start - This is an event recorded by a work consuming instance on a worker node. The job has been taken from the work queue but not ack'd yet.
- job_end - This is an event recorded by a work consuming instance on a worker node. The job has been finished and ack'd.
So if you launched just five jobs and want to check they all finished:
$ grep -R job_end var/epumgmt/runlogs/$RUN_NAME | wc -l
Now that you have gotten a basic feel for the system, the main capability left to exercise is killing a worker node mid-work and having the system compensate.
As explained in the "What will soon be possible" section, the elastic policies that come with the queue length readings (i.e., the expanding and contracting of the number of workers) are hindered by an Erlang related problem that will go away when the agent/service on the RabbitMQ node is created.
What we will demo now:
- Two workers are running (min_instances == 2). This could be different, but having zero or one will not work.
- Ten jobs are sent into the system.
- Each job works (sleeps) for one minute.
- Theoretically it will take five minutes for everything to complete.
- During the first minute, we will destroy one of the workers.
- A replacement will be started and the old pending job will still be completed by one of the workers.
Let's start by making sure the epumgmt tool knows about the current workers:
$ ./bin/epumgmt.sh -n $RUN_NAME -a find-workers-once
So let's start by sending 10 jobs into the system. Let's pick a nice unique "batch ID" in the launch so that we can grep more easily later.
$ BATCHID="killdemo_1"
$ wget http://$SLEEPERHOST:8000/$BATCHID/0/10/60
The work should be taken up pretty much immediately by the two worker nodes. You can see the job_begin events:
$ ./bin/epumgmt.sh -n $RUN_NAME -a logfetch
$ grep -R job_begin var/epumgmt/runlogs/$RUN_NAME | grep $BATCHID
Run the following command to pick one worker, get its logs, and destroy it.
$ ./bin/epumgmt.sh -n $RUN_NAME -a fetchkill --killnum 1
You will see a message along the lines of "Terminated 'i-2185934b'".
Now what we will do is take that instance ID and look for a job_begin that does not have a matching job_end. This will tell us the ID of the job that was being worked on when the node died.
$ KILLED_NODE="i-2185934b"
$ grep -R job_ var/epumgmt/runlogs/$RUN_NAME/$KILLED_NODE | grep $BATCHID
You should see a series of "job_begin" and "job_end" events (maybe just one "job_begin" if you killed the instance right away).
Note the last one, there should be a "job_begin" with no "job_end" following it, look at this and note the "jobid". Along with the batch ID, this "jobid" is the job's unique job ID in the system.
We can now look for this on the worker that was launched as compensation.
It's imperative you run the following command to update the node list, otherwise epumgmt will not know about the new worker that was launched as compensation:
$ ./bin/epumgmt.sh -n $RUN_NAME -a find-workers-once
And you probably know the drill by now, let's get all the most recent logs to have a look.
$ ./bin/epumgmt.sh -n $RUN_NAME -a logfetch
Say for example that the interrupted job we found was #6. Here is how to grep for it:
$ grep -R job_ var/epumgmt/runlogs/$RUN_NAME/ | grep $BATCHID | grep 'jobid": 6'
i.e., look for any event in this run containing "job_", filter by the batch ID of our little experiment, then look for anything pertaining to jobid 6.
You will see that there are two "job_begin" events but only one "job_end" event. This is a success, the job started on that node that was killed, got requeued, and finishes out on another node (either the replacement node or another pre-existing worker).
Note that debugging can be done remotely but also using the log fetcher. This is also useful for analyzing events after the fact (for example to look for job events on the worker nodes instead of logging in).
$ ./bin/epumgmt.sh -n $RUN_NAME -a find-workers-once
$ ./bin/epumgmt.sh -n $RUN_NAME -a logfetch
The logs will be downloaded to a run-specific directory:
$ ls var/epumgmt/runlogs/$RUN_NAME/
Full logs help, but there are also special log lines called events that are interesting (and in the positive cases the things you are most likely looking for: job started, VM started, etc.).
A way to look at the events that were gathered up via log fetching is to run the following command:
$ ./bin/epumgmt.sh -n $RUN_NAME -a update-events
Those events will be more programmatically accessible in the future (they are already, it is just not nicely presentable to outside developers).
Note that if you run update-events multiple times nothing will happen since there were no log-fetches in the meantime. It is a purely "local" command.
$ ./bin/epumgmt.sh -n $RUN_NAME -a killrun
The 'killrun' action does a few things:
- The provisioner logs are queried to look for any VM creation events.
- Then the logs from all of the active VM instances in the system are fetched for your archives.
- Then all of the VM instances in the system are terminated.