This is a comprehensive ML techniques with python , that I have spent for more than two months to complete it.
I think it is a great opportunity for who want to learn machine learning workflow with python completely. I have covered most of the methods that are implemented for iris until 2018, you can start to learn and review your knowledge about ML with a simple dataset and try to learn and memorize the workflow for your journey in Data science world.
I am open to getting your feedback for improving this
Field of study that gives computers the ability to learn without being explicitly programmed.
Arthur Samuel, 1959
If you have already read some machine learning books. You have noticed that there are different ways to stream data into machine learning.
most of these books share the following steps (checklist):
- Define the Problem(Look at the big picture)
- Specify Inputs & Outputs
- Data Collection
- Exploratory data analysis
- Data Preprocessing
- Model Design, Training, and Offline Evaluation
- Model Deployment, Online Evaluation, and Monitoring
- Model Maintenance, Diagnosis, and Retraining
You can see my workflow in the below image :

you should feel free to adapt this checklist to your needs

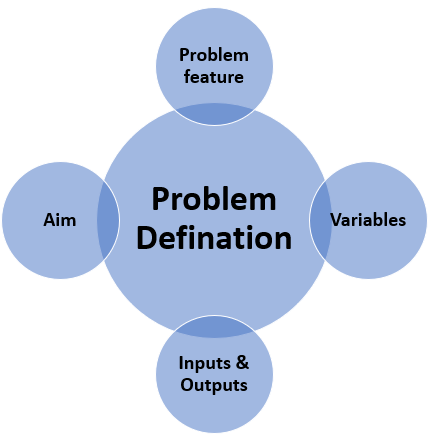
# 3- Problem Definition I think one of the important things when you start a new machine learning project is Defining your problem. that means you should understand business problem.( **Problem Formalization**)
Problem Definition has four steps that have illustrated in the picture below:
we will use the classic Iris data set. This dataset contains information about three different types of Iris flowers:
- Iris Versicolor
- Iris Virginica
- Iris Setosa
The data set contains measurements of four variables :
- sepal length
- sepal width
- petal length
- petal width
The Iris data set has a number of interesting features:
-
One of the classes (Iris Setosa) is linearly separable from the other two. However, the other two classes are not linearly separable.
-
There is some overlap between the Versicolor and Virginica classes, so it is unlikely to achieve a perfect classification rate.
-
There is some redundancy in the four input variables, so it is possible to achieve a good solution with only three of them, or even (with difficulty) from two, but the precise choice of best variables is not obvious.
Why am I using this dataset:
1- This is a good project because it is so well understood.
2- Attributes are numeric so you have to figure out how to load and handle data.
3- It is a classification problem, allowing you to practice with perhaps an easier type of supervised learning algorithm.
4- It is a multi-class classification problem (multi-nominal) that may require some specialized handling.
5- It only has 4 attributes and 150 rows, meaning it is small and easily fits into memory (and a screen or A4 page).
6- All of the numeric attributes are in the same units and the same scale, not requiring any special scaling or transforms to get started.[5]
7- we can define problem as clustering(unsupervised algorithm) project too.
The aim is to classify iris flowers among three species (setosa, versicolor or virginica) from measurements of length and width of sepals and petals
The variables are : sepal_length: Sepal length, in centimeters, used as input. sepal_width: Sepal width, in centimeters, used as input. petal_length: Petal length, in centimeters, used as input. petal_width: Petal width, in centimeters, used as input. setosa: Iris setosa, true or false, used as target. versicolour: Iris versicolour, true or false, used as target. virginica: Iris virginica, true or false, used as target.
<< Note >>
You must answer the following question: How does your company expact to use and benfit from your model.
Iris is a very popular classification and clustering problem in machine learning and it is such as "Hello world" program when you start learning a new programming language. then I decided to apply Iris on 20 machine learning method on it. The Iris flower data set or Fisher's Iris data set is a multivariate data set introduced by the British statistician and biologist Ronald Fisher in his 1936 paper The use of multiple measurements in taxonomic problems as an example of linear discriminant analysis. It is sometimes called Anderson's Iris data set because Edgar Anderson collected the data to quantify the morphologic variation of Iris flowers in three related species. Two of the three species were collected in the Gaspé Peninsula "all from the same pasture, and picked on the same day and measured at the same time by the same person with the same apparatus". The data set consists of 50 samples from each of three species of Iris (Iris setosa, Iris virginica, and Iris versicolor). Four features were measured from each sample: the length and the width of the sepals and petals, in centimeters. Based on the combination of these four features, Fisher developed a linear discriminant model to distinguish the species from each other.
As a result, iris dataset is used as the input of all algorithms.

the outputs for our algorithms totally depend on the type of classification or clustering algorithms. the outputs can be the number of clusters or predict for new input.
setosa: Iris setosa, true or false, used as target.
versicolour: Iris versicolour, true or false, used as target.
virginica: Iris virginica, true or false, used as a target.
- Anaconda (from https://www.continuum.io) is a free Python distribution for SciPy stack. It is also available for Linux and Mac.
- Canopy (https://www.enthought.com/products/canopy/) is available as free as well as commercial distribution with full SciPy stack for Windows, Linux and Mac.
- Python (x,y) is a free Python distribution with SciPy stack and Spyder IDE for Windows OS. (Downloadable from http://python-xy.github.io/)
Package managers of respective Linux distributions are used to install one or more packages in SciPy stack.
For Ubuntu Users:
sudo apt-get install python-numpy python-scipy python-matplotlibipythonipythonnotebook
python-pandas python-sympy python-nose
I strongly recommend installing Python and Jupyter using the Anaconda Distribution, which includes Python, the Jupyter Notebook, and other commonly used packages for scientific computing and data science.
First, download Anaconda. We recommend downloading Anaconda’s latest Python 3 version.
Second, install the version of Anaconda which you downloaded, following the instructions on the download page.
Congratulations, you have installed Jupyter Notebook! To run the notebook, run the following command at the Terminal (Mac/Linux) or Command Prompt (Windows):
In this kernel we are using the following packages:

Now we import all of them
In this section, you'll learn how to use graphical and numerical techniques to begin uncovering the structure of your data.
- Which variables suggest interesting relationships?
- Which observations are unusual?
By the end of the section, you'll be able to answer these questions and more, while generating graphics that are both insightful and beautiful. then We will review analytical and statistical operations:
- 5-1 Data Collection
- 5-2 Visualization
- 5-3 Data Preprocessing
- 5-4 Data Cleaning

## 6-1 Data Collection **Data collection** is the process of gathering and measuring data, information or any variables of interest in a standardized and established manner that enables the collector to answer or test hypothesis and evaluate outcomes of the particular collection.[techopedia]
Iris dataset consists of 3 different types of irises’ (Setosa, Versicolour, and Virginica) petal and sepal length, stored in a 150x4 numpy.ndarray
The rows being the samples and the columns being: Sepal Length, Sepal Width, Petal Length and Petal Width.[6]
Data visualization is the presentation of data in a pictorial or graphical format. It enables decision makers to see analytics presented visually, so they can grasp difficult concepts or identify new patterns.
With interactive visualization, you can take the concept a step further by using technology to drill down into charts and graphs for more detail, interactively changing what data you see and how it’s processed.[SAS]
In this section I show you 11 plots with matplotlib and seaborn that is listed in the blew picture:

you can follow me on: