A GraphQL-powered, single-page dashboard application for Saleor.
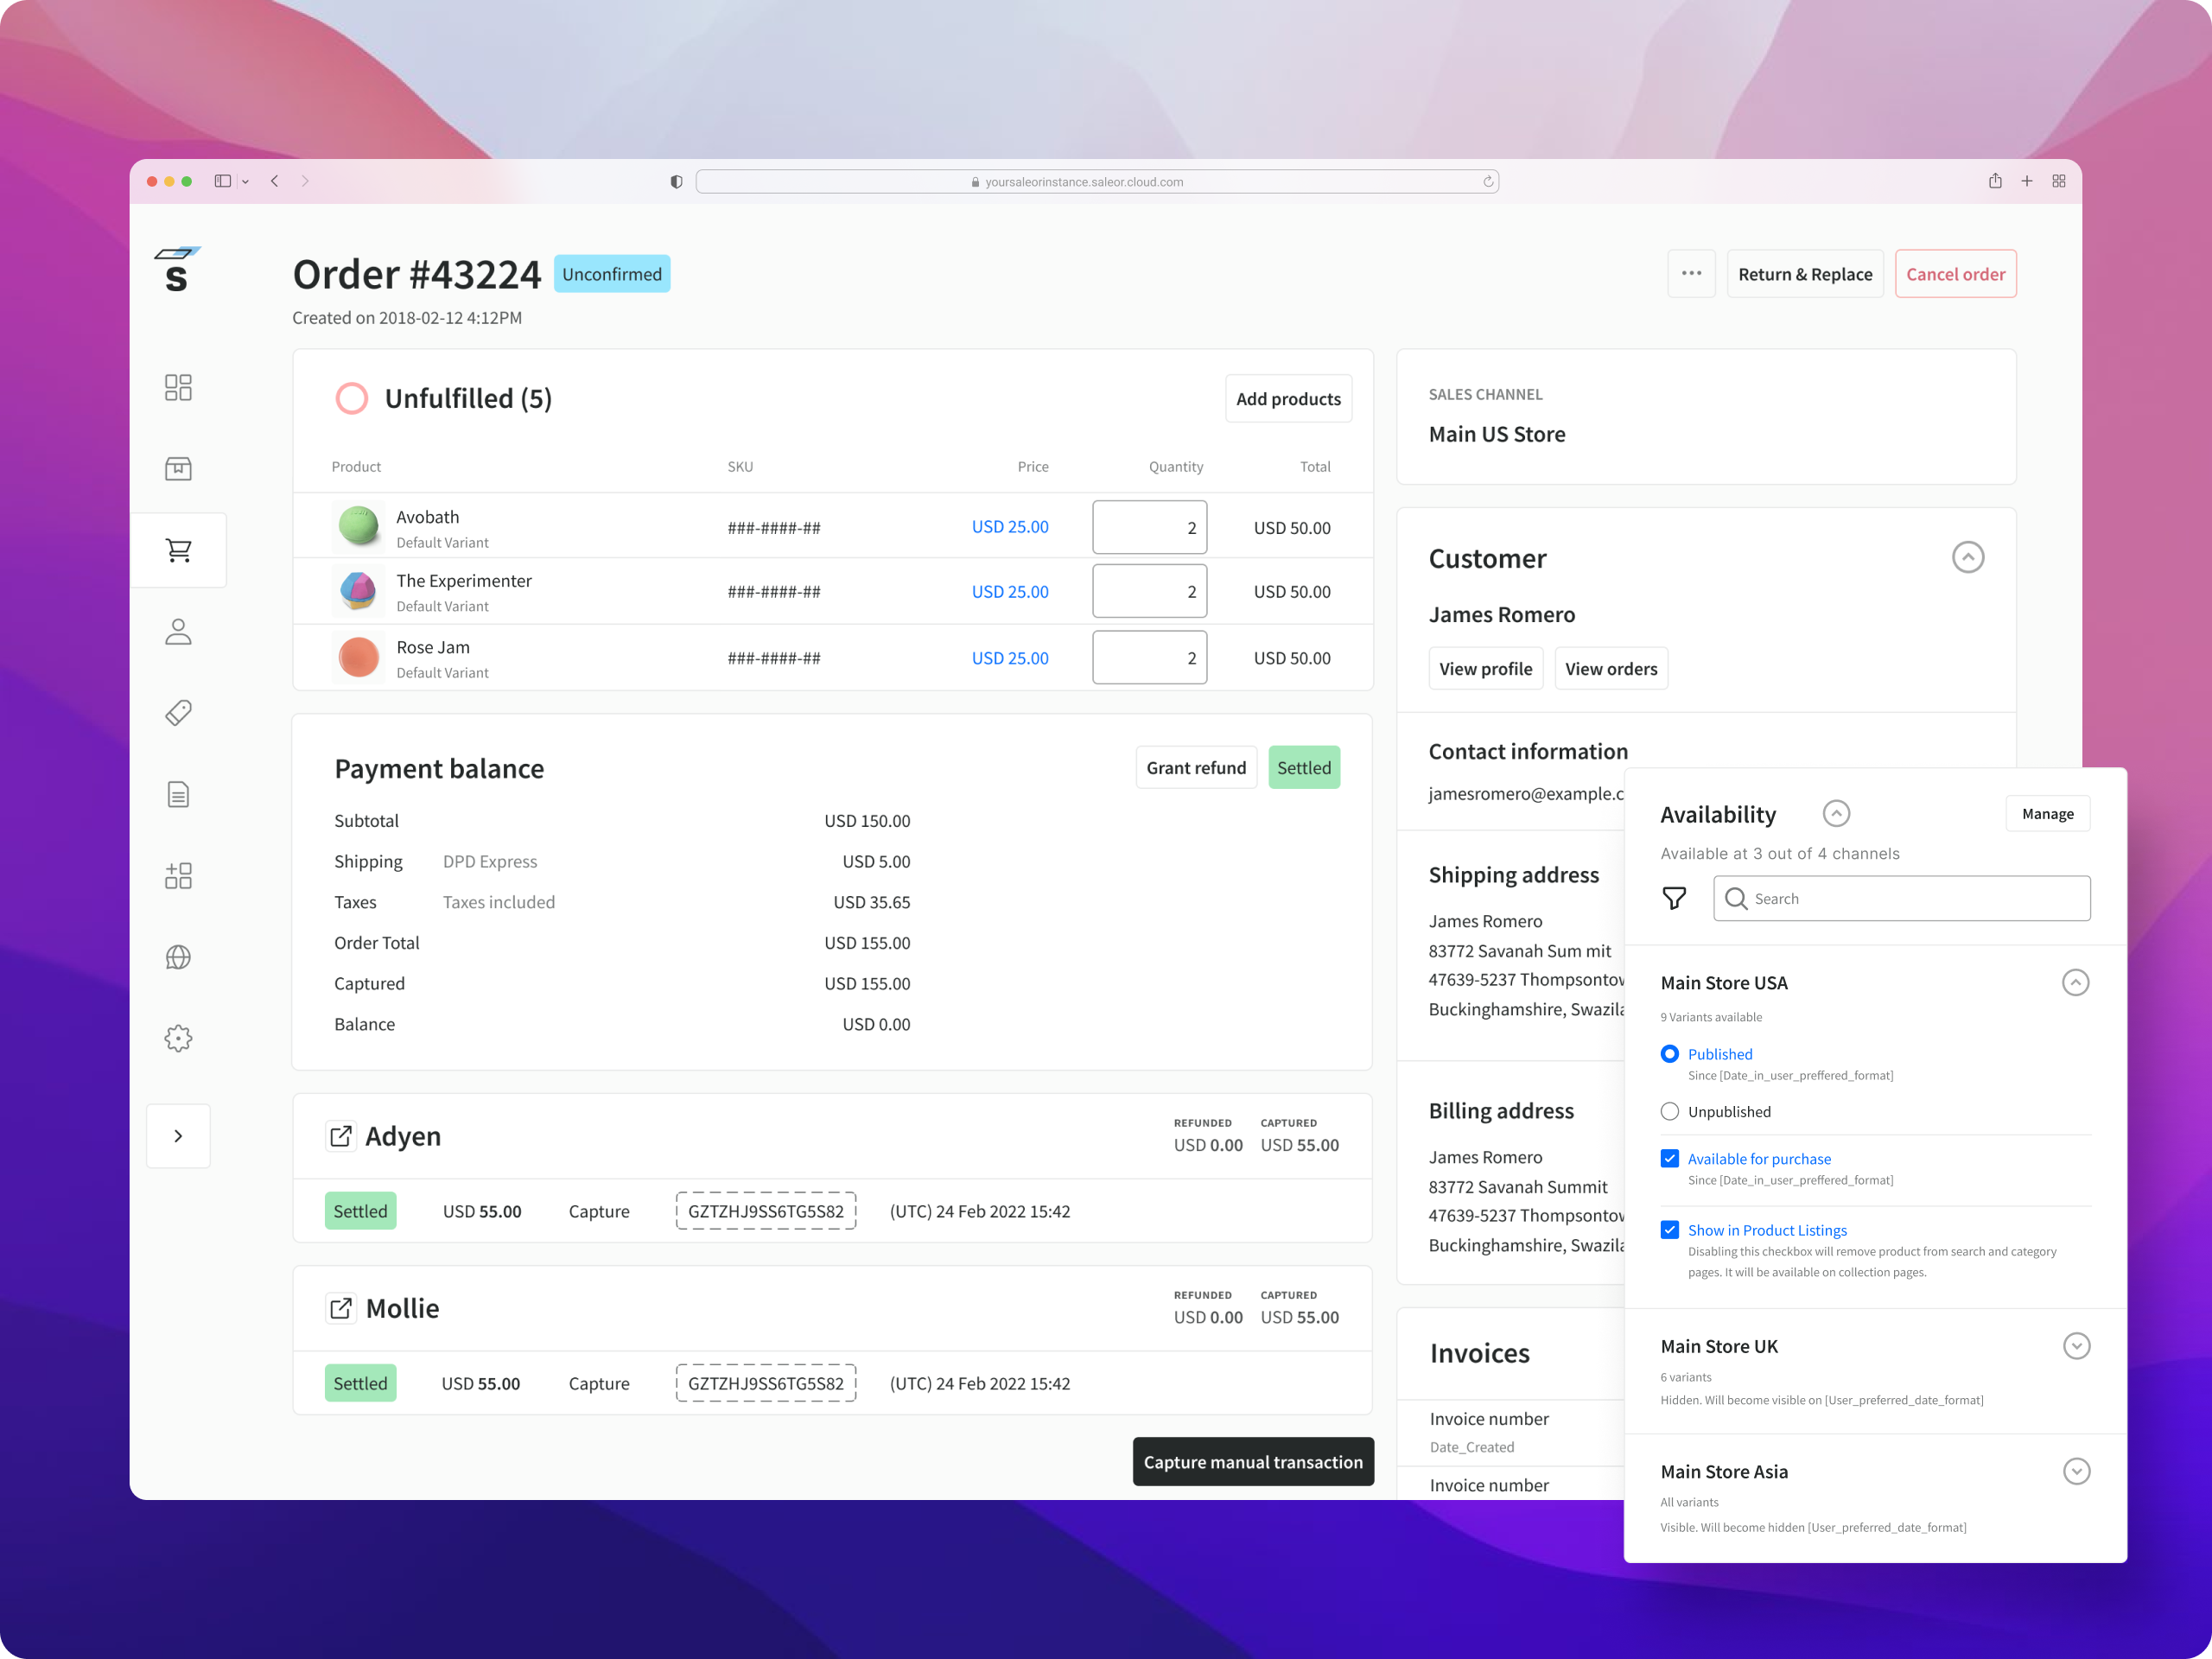
See the public demo of Saleor Dashboard!
Or launch the demo on a free Heroku instance.

These instructions will get you a copy of the project up and running on your local machine for development and testing purposes.
- Node.js v14+
- A running instance of Saleor.
Clone the repository:
$ git clone https://github.com/saleor/saleor-dashboard.git
Enter the project directory:
$ cd saleor-dashboard
Check release log for the latest release
If you want to use the latest development version, checkout to the main branch:
$ git checkout main
Install NPM dependencies:
$ npm i
Create .env file in a root directory or set environment variables with following values:
-
API_URI(required) - URI of a running instance of Saleor GraphQL API. If you are running Saleor locally with the default settings, setAPI_URIto:http://localhost:8000/graphql/. Make sure that you have/at the end ofAPI_URI. -
APP_MOUNT_URI- URI at which the Dashboard app will be mounted. E.g. if you setAPP_MOUNT_URIto/dashboard/, your app will be mounted athttp://localhost:9000/dashboard/. -
STATIC_URL- URL where the static files are located. E.g. if you use S3 bucket, you should set it to the bucket's URL. By default Saleor assumes you serve static files from the root of your site athttp://localhost:9000/.
To start the development server run:
$ npm start
In case you see CORS errors make sure to check CORS configuration of your Saleor instance or CORS settings in the Cloud Console.
To build the application bundle run:
$ npm run build
Saleor Dashboard is using a generic error tracking wrapper function that takes care of the most popular use cases:
- initializing the tracker
- capturing exceptions and (optionally) displaying the event id
- setting basic user data (this is opt-in and disabled by default)
By default it ships with a Sentry adapter but any kind of error tracking software can be used by creating a custom adapter (using Sentry and TS types as an example).
Example:
// src/services/errorTracking/index.ts

import { CustomAdapter } from "./adapters/";

const errorTracker = ErrorTrackerFactory(CustomAdapter(config));Add Cypress specific env variables to .env file (created in configuration section above):
CYPRESS_USER_NAME=
CYPRESS_USER_PASSWORD=
CYPRESS_SECOND_USER_NAME=
CYPRESS_PERMISSIONS_USERS_PASSWORD=

CYPRESS_mailHogUrl=
STRIPE_SECRET_KEY=
STRIPE_PUBLIC_KEY=

// not required
CYPRESS_RECORD_KEY= // if you want your local runs recorded
For values of those variables refer to our internal documentation.
You are ready to run cypress commands like:
npm run cy:openSentry is used as the default tracker so no changes in code are necessary and the configuration is done via environment variables.
The following environment variables are available:
# Required
SENTRY_DSN=

# Optional
# https://docs.sentry.io/product/cli/configuration/
SENTRY_AUTH_TOKEN=
SENTRY_ORG=
SENTRY_PROJECT=
SENTRY_URL_PREFIX=
ENVIRONMENT=