Visualize batlog data using the d3.js library.
Skip to the demo page for a demonstration of this project. You can use your own data file, or example data.
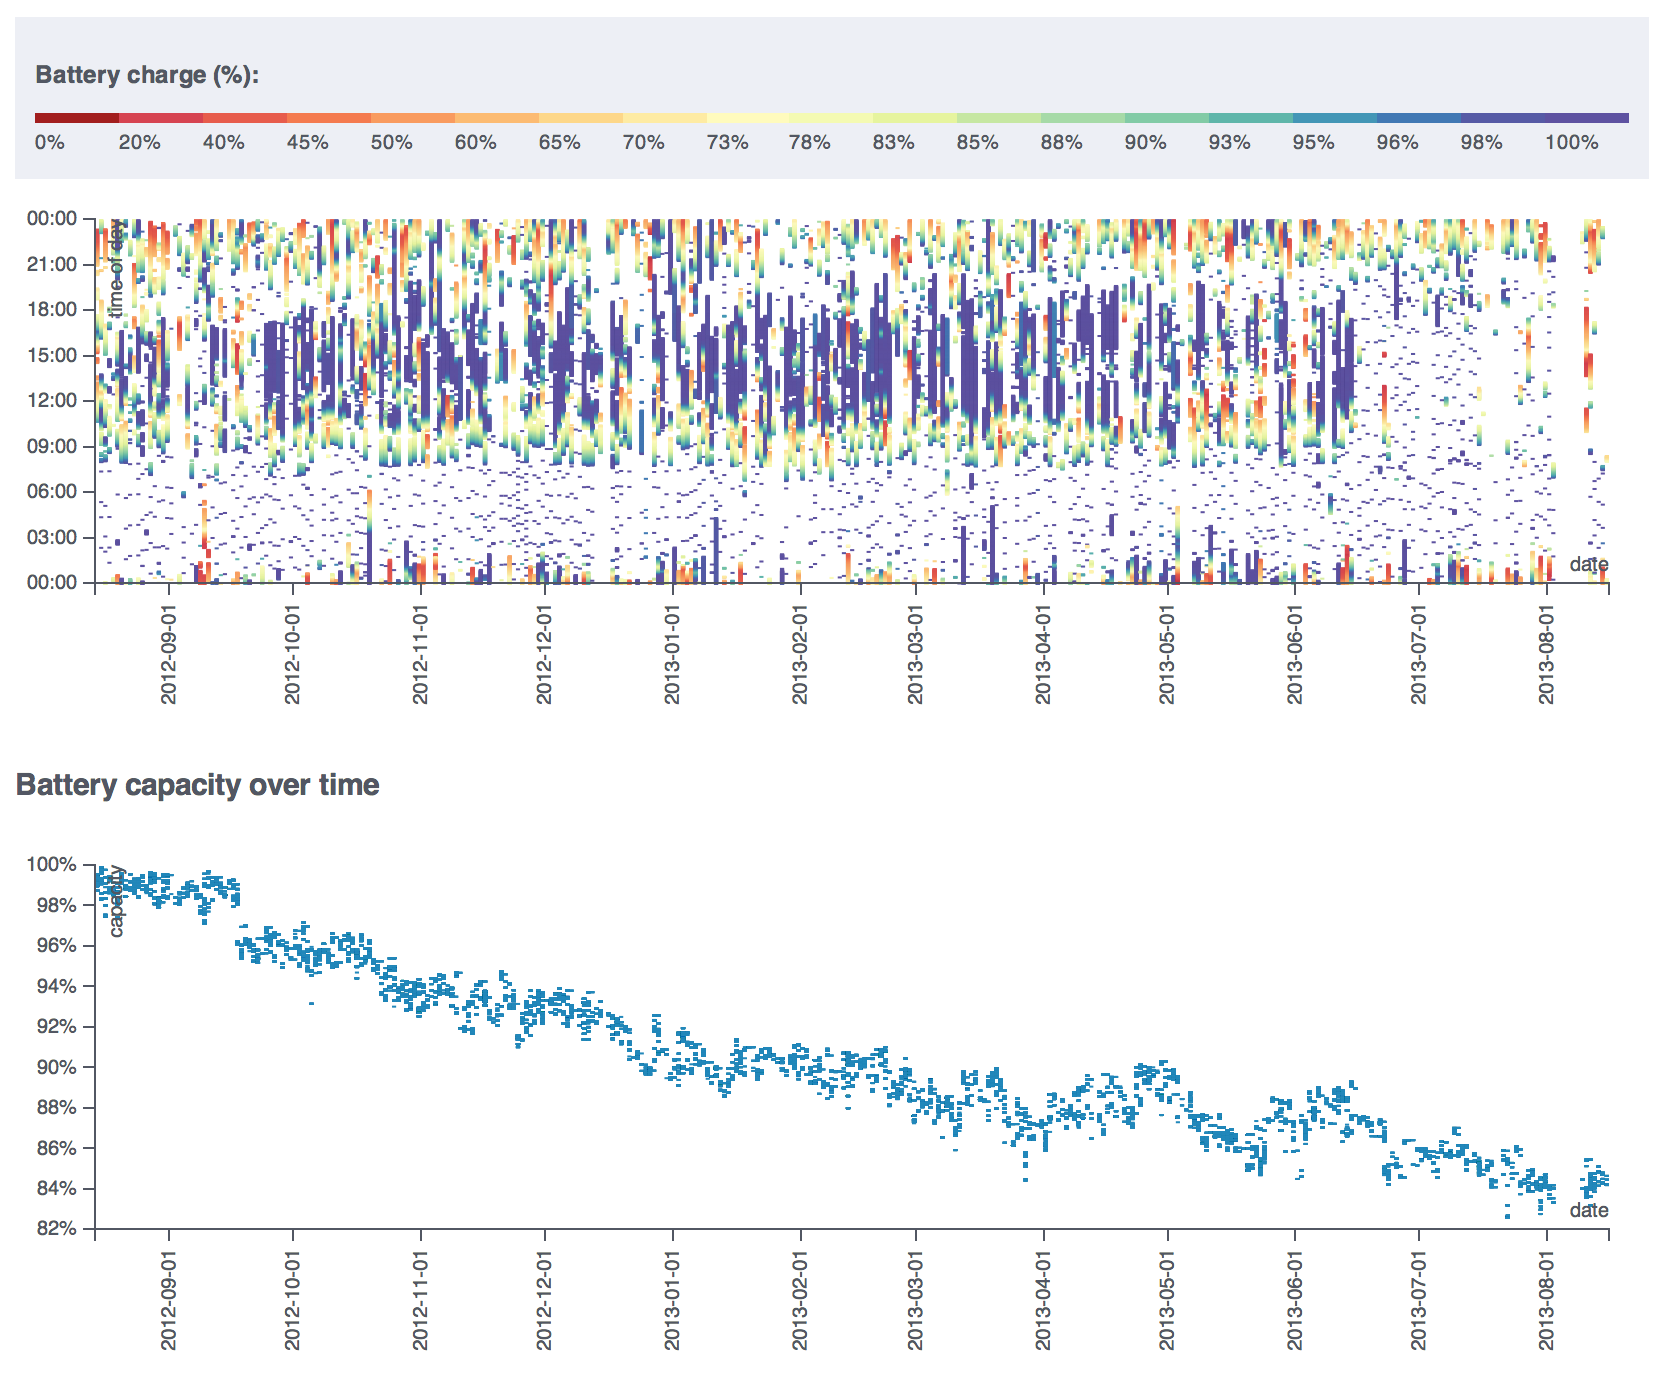
The result should look something like this:
- A batlog CSV file (alternatively, you can convert a batlog
datfile using the batlog2csv script). - A modern browser that supports drag & drop and SVG.
Load the index.html page (or use the demo page) and drop the batlog CSV file into the designated area. A graph of your data will be drawn.
Depending on the size of your log file, system configuration and browser, this can take a while.
In order to build this project's CSS and JavaScript files, you'll need to have node.js installed on your machine.
Once you've installed node.js, browse to the project's root directory and run the following command to install all dependencies:
npm installNow you're ready to build! This project uses Grunt to run all its tasks. There are a few tasks defined in the GruntFile.js task definition file, but there is an alias task available called default that runs all necessary tasks in the correct order (from the project's root directory again):
grunt defaultThis will compile and minify all files and put the results in the build directory.
Apache License, Version 2.0, see LICENSE.md.