Home
This page describes all you can do with RoughJS.
If you're looking for examples, click here.
Rough.js renders to Canvas or SVG. RoughCanvas or RoughSVG provides the main interface to work with this library.
Instantiate RoughCanvas by passing in the canvas node to rough.canvas() method.
let roughCanvas = rough.canvas(document.getElementById('myCanvas'));Instantiate RoughSVG by passing in the root SVG node to rough.svg() method.
let roughSvg = rough.svg(document.getElementById('svg'));config is optional.
Both RoughCanvas and RoughSVG provide the same methods. The difference is that the RoughSVG methods return a node (g) that can be inserted in to the SVG DOM.
For each method, options is an optional argument - it configures how the shape is drawn/filled. Default options can be configured in the rough.canvas instantiator described above.
Draws a line from (x1, y1) to (x2, y2).
roughCanvas.line(60, 60, 190, 60);
roughCanvas.line(60, 60, 190, 60, {strokeWidth: 5});
in SVG:
const line = roughSvg.line(60, 60, 190, 60);
svg.appendChild(line);Draws a rectangle with the top-left corner at (x, y) with the specified width and height.
roughCanvas.rectangle(10, 10, 100, 100);
roughCanvas.rectangle(140, 10, 100, 100, { fill: 'red'});
in SVG:
svg.appendChild(roughSvg.rectangle(10, 10, 100, 100));
svg.appendChild(roughSvg.rectangle(140, 10, 100, 100, { fill: 'red'}));Draws an ellipse with the center at (x, y) and the specified width and height.
roughCanvas.ellipse(350, 50, 150, 80);
roughCanvas.ellipse(610, 50, 150, 80, {fill: 'blue', stroke: 'red'});Draws a circle with the center at (x, y) and the specified diameter.
roughCanvas.circle(480, 50, 80);Draws a set of lines connecting the specified points.
points is an array of points. Each point is an array with 2 values - [x, y]
roughCanvas.linearPath([[690, 10], [790, 20], [750, 120], [690, 100]]);Draws a polygon with the specified vertices.
vertices is an array of points. Each point is an array with 2 values - [x, y]
roughCanvas.polygon([[690, 130], [790, 140], [750, 240], [690, 220]]);Draws an arc. An arc is described as a section of en ellipse. x, y represent the center of that ellipse. width, height are the dimensions of that ellipse.
start, stop are the start and stop angles for the arc.
closed is a boolean argument. If true, lines are drawn to connect the two end points of the arc to the center.

roughCanvas.arc(350, 300, 200, 180, Math.PI, Math.PI * 1.6, true);
roughCanvas.arc(350, 300, 200, 180, 0, Math.PI / 2, true, {
  stroke: 'red', strokeWidth: 4,
  fill: 'rgba(255,255,0,0.4)', fillStyle: 'solid'
});
roughCanvas.arc(350, 300, 200, 180, Math.PI / 2, Math.PI, true, {
  stroke: 'blue', strokeWidth: 2,
  fill: 'rgba(255,0,255,0.4)'
});Draws a curve passing through the points passed in.
points is an array of points. Each point is an array with 2 values - [x, y]

// draw sine curve
let points = [];
for (let i = 0; i < 20; i++) {
  let x = (400 / 20) * i + 10;
  let xdeg = (Math.PI / 100) * x;
  let y = Math.round(Math.sin(xdeg) * 90) + 500;
  points.push([x, y]);
}
roughCanvas.curve(points, {
  stroke: 'red', strokeWidth: 3
});Draws a path described using a SVG path data string.
roughCanvas.path('M37,17v15H14V17z M50,0H0v50h50z');
roughCanvas.path('M80 80 A 45 45, 0, 0, 0, 125 125 L 125 80 Z', { fill: 'green' });
One of the options you can pass in to the path method is simplification which tries to reduce the number of points in the path, thereby simplifying it. This is great for drawing complex paths like maps. simplification is a number between 0 and 1.
Draws the drawable object passed in.
RoughCanvas/RoughSVG has only one property:
A generator is a readonly property that lets you create a drawable object for a shape that can be later used with the draw method.
let roughCanvas = rough.canvas(document.getElementById('myCanvas'));
let generator = roughCanvas.generator;
let rect1 = generator.rectangle(10, 10, 100, 100);
let rect2 = generator.rectangle(10, 120, 100, 100, {fill: 'red'});
roughCanvas.draw(rect1);
roughCanvas.draw(rect2);Describe how a particular shape is drawn. You can pass in options in every method to the RoughCanvas or in the constructor.
Every property is options is optional. The way an option property is resolved is as follows:
For example, the stroke property defines the color used to draw the shape. If stroke is defined in the options of a line command, that color will be used. Else it will use the color defined in the constructor. Else it will use the built in default color - black
Following properties can be set in the options:
Numerical value indicating how rough the drawing is. A rectangle with the roughness of 0 would be a perfect rectangle. Default value is 1. There is no upper limit to this value, but a value over 10 is mostly useless.

canvas.rectangle(15, 15, 80, 80, { roughness: 0.5, fill: 'red' });
canvas.rectangle(120, 15, 80, 80, { roughness: 2.8, fill: 'blue' });
canvas.rectangle(220, 15, 80, 80, { bowing: 6, stroke: 'green', strokeWidth: 3 });Numerical value indicating how curvy the lines are when drawing a sketch. A value of 0 will cause straight lines. Default value is 1.
An optional numeric value that sets the seed for creating random values used in shape generation. This is useful for creating the exact shape when re-generating with the same parameters. The value of seed is between 1 and 2^31. If seed is not defined, or set to 0, no seed is used when computing random values.
String value representing the color of the drawn objects. Default value is black (#000000). If the this is set to none, the shape vectors do not contain a stroke (This is different from having a transparent stroke).
Numerical value to set the width of the strokes (in pixels). Default value is 1.
String value representing the color used to fill a shape. In hachure style fills, this represents the color of the hachure lines. In dots style, it represents the color of the dots.
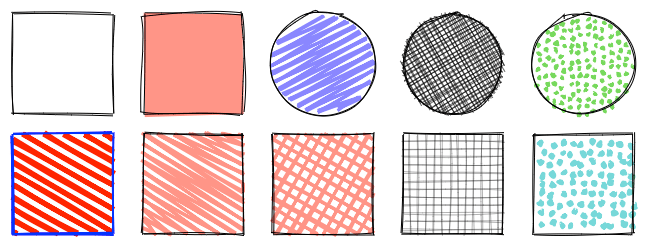
Rough.js supports the following styles (Default value is hachure):
hachure draws sketchy parallel lines with the same roughness as defined by the roughness and the bowing properties of the shape. It can be further configured using the fillWeight, hachureAngle, and hachureGap properties.
solid is more like a conventional fill.
zigzag draws zig-zag lines filling the shape
cross-hatch Similar to hachure, but draws cross hatch lines (akin to two hachure fills 90 degrees from each other).
dots Fills the shape with sketchy dots.
dashed Similar to hachure but the individual lines are dashed. Dashes can be configured using the dashOffset and dashGap properties.
zigzag-line Similar to hachure but individual lines are drawn in a zig-zag fashion. The size of the zig-zag can be configured using the zigzagOffset proeprty
canvas.circle(50, 50, 80, { fill: 'red' });
canvas.rectangle(120, 15, 80, 80, { fill: 'red' });
canvas.circle(50, 150, 80, {
  fill: "rgb(10,150,10)",
  fillWeight: 3 // thicker lines for hachure
});
canvas.rectangle(220, 15, 80, 80, {
  fill: 'red',
  hachureAngle: 60, // angle of hachure,
  hachureGap: 8
});
canvas.rectangle(120, 105, 80, 80, {
  fill: 'rgba(255,0,200,0.2)',
  fillStyle: 'solid' // solid fill
});Numeric value representing the width of the hachure lines. Default value of the fillWeight is set to half the strokeWidth of that shape.
When using dots styles to fill the shape, this value represents the diameter of the dot.
Numerical value (in degrees) that defines the angle of the hachure lines. Default value is -41 degrees.
Numerical value that defines the average gap, in pixels, between two hachure lines. Default value of the hachureGap is set to four times the strokeWidth of that shape.
When drawing ellipses, circles, and arcs, RoughJS approximates curveStepCount number of points to estimate the shape. Default value is 9.
When drawing ellipses, circles, and arcs, Let RoughJS know how close should the rendered dimensions be when compared to the specified one. Default value is 0.95 - which means the rendered dimensions will be at least 95% close to the specified dimensions. A value of 1 will ensure that the dimensions are almost 100% accurate.
If you want the stroke to be dashed (This does not affect the hachure and other fills of the shape), set this property. The value is an array of numbers as described in setLineDash method of canvas
When using dashed strokes, this property sets the line dash offset or phase. This is akin to the lineDashOffset of canvas
This property is similar to the strokeLineDash property but it affects the fills, not the stroke. eg. when you want hachure lines to be dashed.
This property is similar to the strokeLineDashOffset property but it affects the fills, not the stroke.
If this property is set to true, roughjs does not apply multiple strokes to sketch the shape.
If this property is set to true, roughjs does not apply multiple strokes to sketch the hachure lines to fill the shape.
When drawing paths using SVG path instructions, simplification can be set to simplify the shape by the specified factor. The value can be between 0 and 1.
For example, a path with 100 points and a simplification value of 0.5 will estimate the shape to about 50 points. This will give more complex shapes a sketchy feel.
Following is the map of Texas drawn without simplification and then with a simplification of 0.1


A value of 0 (default) is treated as no simplification.
When filling a shape using the dashed style, this property indicates the nominal length of dash (in pixels). If not set, it defaults to the hachureGap value.
When filling a shape using the dashed style, this property indicates the nominal gap between dashes (in pixels). If not set, it defaults to the hachureGap value.
When filling a shape using the zigzag-line style, this property indicates the nominal width of the zig-zag triangle in each line. If not set, it defaults to the hachureGap value.
When randomizing shapes do not randomize locations of the end points. e.g. end points of line or a curve. Boolean value, defaults to false
When instantiating RoughCanvas, you can, optionally, pass in a configuration object. The object can have any of these properties:
An options object that sets the default values for all shapes in the RoughCanvas instance.