Release Checklist
-
Assume we have added agents in a previous step, one of which is the local agent
-
Navigate to the monitoring page, and verify that the "monitoring is not installed" message is present.
-
Click the Install button and verify the monitoring backend settings are visible.
-
Configure the monitoring backend (example: HA mode, with S3 bucket and credentials). Verify that the status eventually reads "Monitoring is currently installed on the cluster".
-
Verify all agents are listed with the "not installed" status
-
Select one cluster and click Install. Verify that the "distinct metrics" and "metrics ingestion rate" show increased values. Other clusters in the list that do not have the metrics capability installed yet may show smaller values in these columns.
-
Repeat for other clusters until all clusters have the metrics capability installed.
-
Switch to the "Roles" tab. Verify that there are no rows in the table.
-
Click the "Create" button. Verify that the new role configuration page is displayed.
-
Create a sample role for a user that can access clusters labeled with "test=1". Click "Save" and verify the new role appears in the table.
-
Switch to the "Role Bindings" tab. Verify that there are no rows in the table.
-
Click the "Create" button. Verify that the new role binding configuration page is displayed.
-
Create a role binding for the previously created role and the subject name (tbd)
-
Nagivate to Grafana and sign in as the role binding subject from the previous step.
-
Verify that no metrics are found. (e.g. in the Explore tab, the "no metrics found" label might be displayed")
-
Go back to the Opni dashboard and label one of the non-local clusters with test=1, and assign a friendly name to the cluster.
-
Go back to Grafana and verify only this cluster's metrics can be queried, including the
opni_cluster_infometric which should contain the previously assigned friendly name. -
Go back to the Opni dashboard and label the local cluster with test=1, and assign a friendly name to the cluster.
-
Go back to Grafana and verify that both clusters' metrics can be queried as before.
-
Go back to the Opni dashboard, and switch to the Monitoring tab. Verify the agent names are now visible.
-
Select one agent from the list and click Uninstall. Verify the confirmation window opens. Select "Yes" to delete the data. Type "Monitoring" into the text box. Observe the Save button becoming enabled only after typing "Monitoring" into the text box. Click "Save" and verify the dialog closes.
-
The UI should display a notification under this cluster indicating that it is delaying the deletion of data. After the elapsed time, it should show "Not Installed".
-
The "Distinct Metrics" and "Metrics Ingestion Rate" values for this cluster should eventually become smaller.
-
Repeat the deletion steps for another cluster, but choose "No" when prompted to delete data. For this cluster, it should not delay deletion of data, and the "Distinct Metrics" value for this cluster should stay the same. The "Metrics Ingestion Rate" value should eventually become smaller as with the previous cluster.
-
Uninstall the metrics capability for the remaining clusters, if any.
-
Click the red "Uninstall" button at the top-right of the Monitoring page when all clusters have the capability uninstalled. Verify the Monitoring page displays the same message that it did before installing the Monitoring backend.
- Create an RKE2 and a K3s cluster and add these to Opni
- A system that exports traces via OTLP to the aggregator collector. The easiest way to achieve it is by enabling Kubernetes System Traces. There are instructions here.
- Within the Opni Admin Dashboard go to Logging and hit
install. You can choose whatever node setup you desire. - Confirm cluster status is displayed (this should be pending until the Opensearch cluster has been set up)
- Confirm that once the Opensearch cluster has reconciled in Kubernetes that the status goes green
- Hit the Edit Config button and confirm the settings are the same as the ones chosen in the setup
- Install the logging capability into the RKE2 cluster.
- Open up the Opensearch Dashboards UI and confirm that both workload and controlplane logs are shipping for the RKE2 cluster
- Install the logging capability into the K3s cluster.
- Open up the Opensearch Dashboards UI and confirm that both workload and controlplane logs are shipping for the K3s cluster. Controlplane logs should contain journald format logs, and plain logs from the Kubelet.
- Verify that the traces are correctly being indexed. In Opensearch, open Dev Tools in the Management section and run the query below. You might need to update the index version.
POST ss4o_traces-kubernetes-opni-v0.5.4-000001/_search
{
  "size": 3,
  "query": {
    "match_all": {}
  },
  "sort": [
    {
      "_doc": {
        "order": "desc"
      }
    }
  ]
}
- Uninstall the capability from the K3s cluster without deleting data. Confirm that data from the cluster is still available in Opensearch
- Uninstall the capability from the RKE2 cluster and delete the data. Confirm that data gets removed from the Opensearch cluster.
- Install & switch configurations on the alerting backend
- Configure a slack endpoint
- Before saving, click test endpoint and verify an informative message arrives at the given destination
- go to the alarms page, verify there are capability & disconnect alarms for each bootstrapped agents.
- connect the slack endpoint to one of these alarms
- ensure that a cluster has metrics installed and create a prometheus alarm with the query
up>0 - verify that this alarm switches to the
firingstate. this can take up to 2-3 minutes - go to the timeline and verify that the incident appears on the timeline page
- configure the disconnect & capability unhealthy alarms for the local cluster to a small alert interval (60s)
once you are done with testing the other verticals
- edit your monitoring configuration with invalid S3 credentials
- verify the capability unhealthy alarm eventually switches to firing
- delete the local agent Stateful Set
- ensure the disconnect condition switches to firing
- silence the alarm
-
Within the Opni Admin Dashboard, go to the Log Anomaly and hit
installbutton. That will setup theopni-preprocessing service,opni-drain service,opni-opensearch-update-serviceand the opni-inferencing-services forcontrol-plane,RancherandLonghorn pods. Check that these 6 pods are running. Theopni-svc-drainmay have restarted a few times but that is expected behavior. -
Setup a downstream RKE2 cluster to ship logs over to the central Opni cluster.
-
Verify that the preprocessing service is receiving logs by viewing the logs of the preprocessing services' pod. Additionally, check the logs of the control-plane inferencing service pod to ensure that control-plane logs are being properly received. Then, go into Opensearch Dashboards within the Opni UI plugin to verify that control plane log messages are being received and inferenced on.
-
On the downstream RKE2 cluster, setup Longhorn as well. Check the logs of the Longhorn inferencing service pod to ensure that Longhorn logs are being properly received and also go into Opensearch Dashboards within the Opni plugin.
-
On the downstream RKE2 cluster, setup Rancher as well. Check the logs of the Rancher inferencing service pod to ensure that Rancher logs are being properly received and also go into Opensearch Dashboards within the Opni plugin.
-
On the central Opni cluster, configure a p2.xlarge GPU node. Once the node has been setup, run
kubectl create -f https://raw.githubusercontent.com/NVIDIA/k8s-device-plugin/v0.13.0/nvidia-device-plugin.ymlto setup the NVIDIA daemon-set which will allow the GPU to be used for model training and inferencing. -
Setup the Boutique microservice on the central Opni cluster following this guide: https://github.com/rancher-sandbox/opni-demo-applications/tree/main/boutique
-
Wait a few minutes for the logs from the Boutique to begin coming through to the central Opni cluster.
-
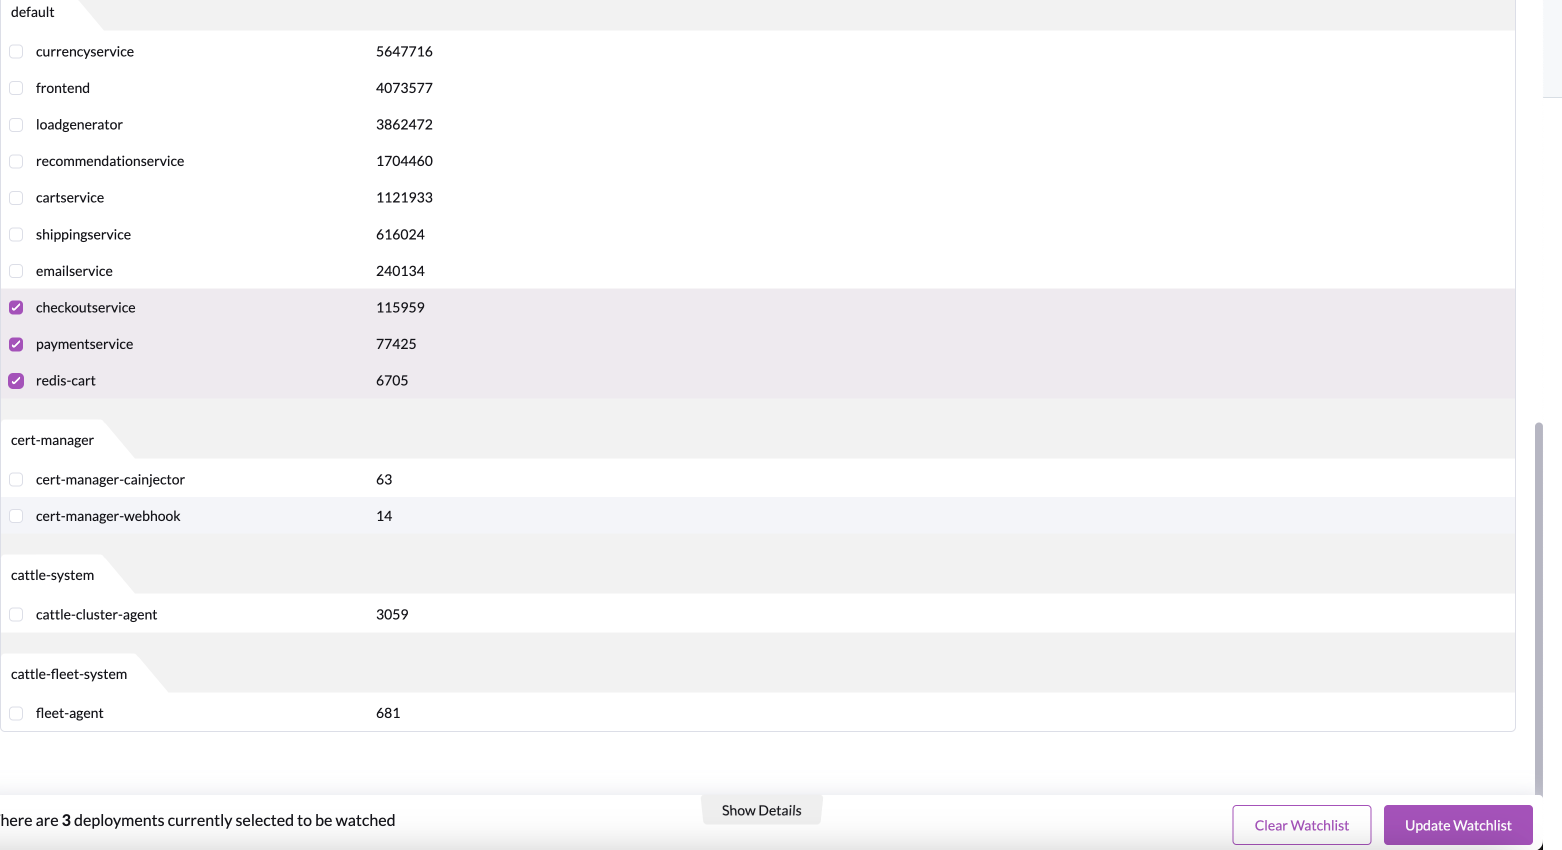
Train a model on the
checkoutservice,paymentserviceandredis-cartdeployments. Hit theUpload Watchlistbutton.
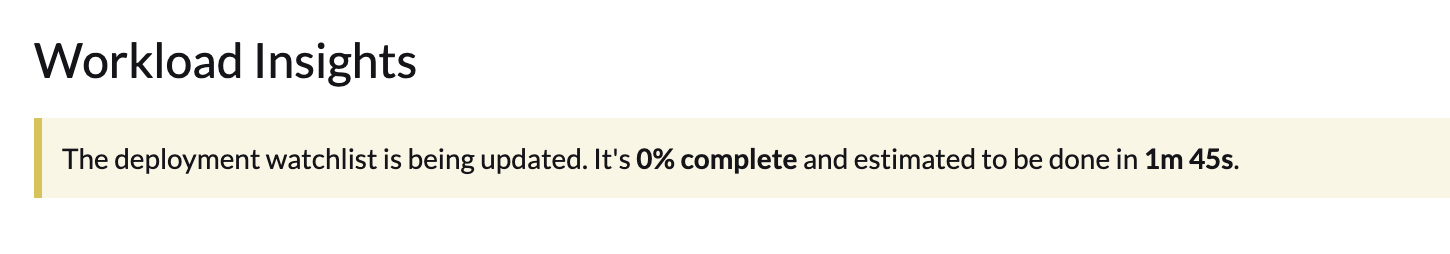
- Verify that a banner appears at the top of the watchlist signifying the amount of time estimated for training the model.
-
Also, verify that the
opni-training-controller,opni-gpu-controller,opni-inference-serviceandopni-workload-drainpods are now up and running. -
To simulate a fault, scale down the deployment of the
emailserviceto 0 replicas. Then, go into the Opensearch Dashboards page and within the Opni plugin, verify that you can see anomalous log messages within thecheckoutservice -
Additionally, to test the logic that a model will not always be trained if the watchlist provided is a subset of the prior watchlist, remove the
redis-cartdeployment from the watchlist and hitUpdate Watchlist. Verify that a new model has not been trained as no new deployments were added to the watchlist. -
Hit the
Clear Watchlistbutton that will clear any watchlist and reset the model. Verify within theopni-gpu-controllerpod that the model has been reset by viewing the logs.