Home
Rodrigo Botafogo edited this page Jan 5, 2017
·
6 revisions
Welcome to the mdarray-sol wiki!
require 'mdarray-sol'

require_relative '../util/ordinal_scale'
require_relative '../util/linear_scale'

class BarChart

  attr_reader :dataset
  attr_reader :width
  attr_reader :height
  attr_reader :svg
  attr_reader :padding
  attr_reader :x_scale

  #--------------------------------------------------------------------------------------
  # Initialize the bar chart and create the main svg for the plot with the given
  # width and height and padding
  #
  # @param dataset [Array] an array of points in the form of [x, y]
  # @param width [Number] the width of the plot
  # @param height [Number] the height of the plot
  # @param padding [Number] a padding for the plot. Uses the same padding for x and y
  # dimension. Could be improved by adding different paddings for x and y
  #--------------------------------------------------------------------------------------

  def initialize(dataset, width:, height:, padding:)
    @dataset = dataset
    @width = width
    @height = height
    @padding = padding

    @svg = $d3.select("body")
           .append("svg")
           .attr("width", @width)
           .attr("height", @height)
  end

  #--------------------------------------------------------------------------------------
  # @param x_scale [OrdinalScale] the scale for the data, this is a Scale object that
  # encapsulates the scale function from d3.  scale defauts to the bar chart scale.
  # Usually this will always be the case, but we need to set it since scale is used
  # inside a block
  #--------------------------------------------------------------------------------------

  def add_data

    x_scale, y_scale, height = @x_scale, @y_scale, @height

    @svg.selectAll("rect")
      .data(@dataset) { |d| d[:key] }
      .enter(nil)
      .append("rect")
      .on("mouseover") { $d3.select(@this).attr("fill", "orange") }
      .on("mouseout") { |d| $d3.select(@this)
                          .transition(nil)
                          .duration(500)
                          .attr("fill", "rgb(0, 0, #{(d[:value] * 10).to_i})" )}
      .attr("x") { |d, i| x_scale[i]}
      .attr("y") { |d, i| height - y_scale[d[:value]] }
      .attr("width", x_scale.scale.rangeBand(nil))
      .attr("height") { |d, i| y_scale[d[:value]] }
      .attr("fill") { |d, i| "rgb(0, 0, #{(d[:value] * 10).to_i})" }

  end

  #--------------------------------------------------------------------------------------
  # Defines the style of the labels.  Although this does not make much sense, since this
  # is fixed, one could consider building the style dynamically.
  #--------------------------------------------------------------------------------------

  def style

    {"font-family" => "sans-serif",
     "font-size" => "11px",
     "fill" => "white",
     "text-anchor" => "middle"}

  end

  #--------------------------------------------------------------------------------------
  #
  #--------------------------------------------------------------------------------------

  def add_labels

    x_scale, y_scale, height = @x_scale, @y_scale, @height

    @svg.selectAll("text")
      .data(@dataset) { |d| d[:key] }
      .enter(nil)
      .append("text")
      .text { |d, i| d[:value] }
      .attr({"x"=> ->(d, i, z) {x_scale[i] + x_scale.scale.rangeBand(nil) / 2},
             "y"=> ->(d, i, z) {height - y_scale[d[:value]] + 14 }})
      .attr(style)

  end

  #--------------------------------------------------------------------------------------
  # Plots the bar chart
  #--------------------------------------------------------------------------------------

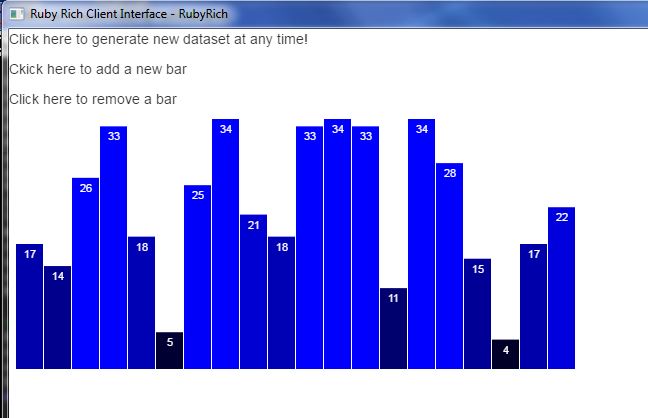
  def plot

    y_min, y_max = @dataset.minmax_by { |d| d[:value] }

    # Creates a new x and y scale for the plot
    @x_scale = OrdinalScale.new([*0..@dataset.length], @width)
    @y_scale = LinearScale.new([0, y_max[:value]], [0, @height])

    add_data
    add_labels

  end

...
  #--------------------------------------------------------------------------------------
  # updates the bars with new data
  #--------------------------------------------------------------------------------------

  def update_bars

    # correct the x scale to the new dataset
    @x_scale.domain([*0..@dataset.length])

    # correct the y scale to the new dataset
    y_min, y_max = @dataset.minmax_by { |d| d[:value] }
    @y_scale.update([0, y_max[:value]], [0, @height])

    # Set local variable to their equivalent instance variable so that they are
    # available inside blocks.  I don´t know if there is a better way of doing
    # this.  Tried googling for a better solution but without success!
    x_scale, y_scale, height = @x_scale, @y_scale, @height

    svg.selectAll("rect")
      .data(@dataset) { |d| d[:key] }
      .transition(nil)
      .delay { |d, i| i * 100 }
      .duration(100)
      .attr("x"=> ->(d, i, z) { x_scale[i] })
      .attr("y"=> ->(d, i, z) {height - y_scale[d[:value]] })
      .attr("width", x_scale.scale.rangeBand(nil))
      .attr("height"=> ->(d, i, z) {y_scale[d[:value]]})
      .attr("fill") { |d, i| "rgb(0, 0, #{(d[:value] * 10).to_i})" }

  end

  #--------------------------------------------------------------------------------------
  # updates the labels
  #--------------------------------------------------------------------------------------

  def update_labels

    x_scale, y_scale, height = @x_scale, @y_scale, @height

    svg.selectAll("text")
      .data(@dataset) { |d| d[:key] }
      .transition(nil)
      .delay { |d, i| i * 100 }
      .duration(500)
      .text { |d, i| d[:value] }
      .attr({"x"=> ->(d, i, z) {x_scale[i] + x_scale.scale.rangeBand(nil) / 2},
             "y"=> ->(d, i, z) {height - y_scale[d[:value]] + 14 }})
      .attr(style)

  end

  #--------------------------------------------------------------------------------------
  # This method is called when the dataset is updated.  This will trigger the update of
  # points, labels and axes
  #
  # @param dataset [Array] a new dataset with the same number of elements as the previous
  # dataset
  #--------------------------------------------------------------------------------------

  def update(dataset)

    @dataset = dataset

    update_bars
    update_labels

  end


  #--------------------------------------------------------------------------------------
  # Removes a bar from the plot
  #--------------------------------------------------------------------------------------

  def remove_bar

    @dataset.shift

    @svg.selectAll("rect")
      .data(@dataset) { |d| d[:key] }
      .exit(nil)
      .transition(nil)
      .duration(500)
      .remove(nil)

    @svg.selectAll("text")
      .data(@dataset) { |d| d[:key] }
      .exit(nil)
      .remove(nil)

    update_bars
    update_labels

  end
  #--------------------------------------------------------------------------------------
  # Adds a single bar to the chart. The @dataset was already updated
  #--------------------------------------------------------------------------------------

  def add_bar

    # add the new bar. No need to add attributes as the whole plot will be updated next
    @svg.selectAll("rect")
      .data(@dataset) { |d| d[:key] }
      .enter(nil)
      .append("rect")
      .on("mouseover") { $d3.select(@this).attr("fill", "orange") }
      .on("mouseout") { |d| $d3.select(@this)
                          .transition(nil)
                          .duration(500)
                          .attr("fill", "rgb(0, 0, #{(d[:value] * 10).to_i})" )}

    update_bars

    # add the new label.  Need only to add the text value as all attributes will be set
    # by update_labels
    @svg.selectAll("text")
      .data(@dataset) { |d| d[:key] }
      .enter(nil)
      .append("text")
      .text { |d, i| d[:value] }

    update_labels

  end


