used http://www.benjack.io/2016/01/02/el-capitan-biocomputing.html to install r and jupyter and numpy and other python stuff
pip install numpy
pip install --upgrade pip
pip install scipy
pip install jupyter
brew tap homebrew/science
brew install R
brew tap caskroom/cask
brew cask install rstudio
data3 = read.csv(file="~rtanglao/Dropbox/GIT/rtgram/first2000-ig-van-2015.csv", stringsAsFactors=F)map <- qmap('Vancouver,BC', zoom = 12, maptype = 'hybrid’)map + geom_point(data = data3, aes(x = long, y=lat, color=I(data3$color)), size=1)
-
map <- qmap('Vancouver,BC', zoom = 12, maptype = ‘hybrid’) -
data2 = read.csv(file="~rtanglao/Dropbox/GIT/rtgram/first20-ig-van-2015.csv", stringsAsFactors=F) -
map + geom_point(data = data2, aes(x = long, y=lat, color=color), size=1)yields:- result is here: https://www.flickr.com/photos/roland/25598368011/ bugs: markers are the wrong color! need to get rid of map chrome
-
seems to work:
qmplot(long, lat, data = data2, maptype = "toner-lite", color = I(data2$color))
make chromeless map following this:
- http://www.milanor.net/blog/maps-in-r-introduction-drawing-the-map-of-europe/
- http://www.milanor.net/blog/maps-in-r-plotting-data-points-on-a-map/˘
- read the data:
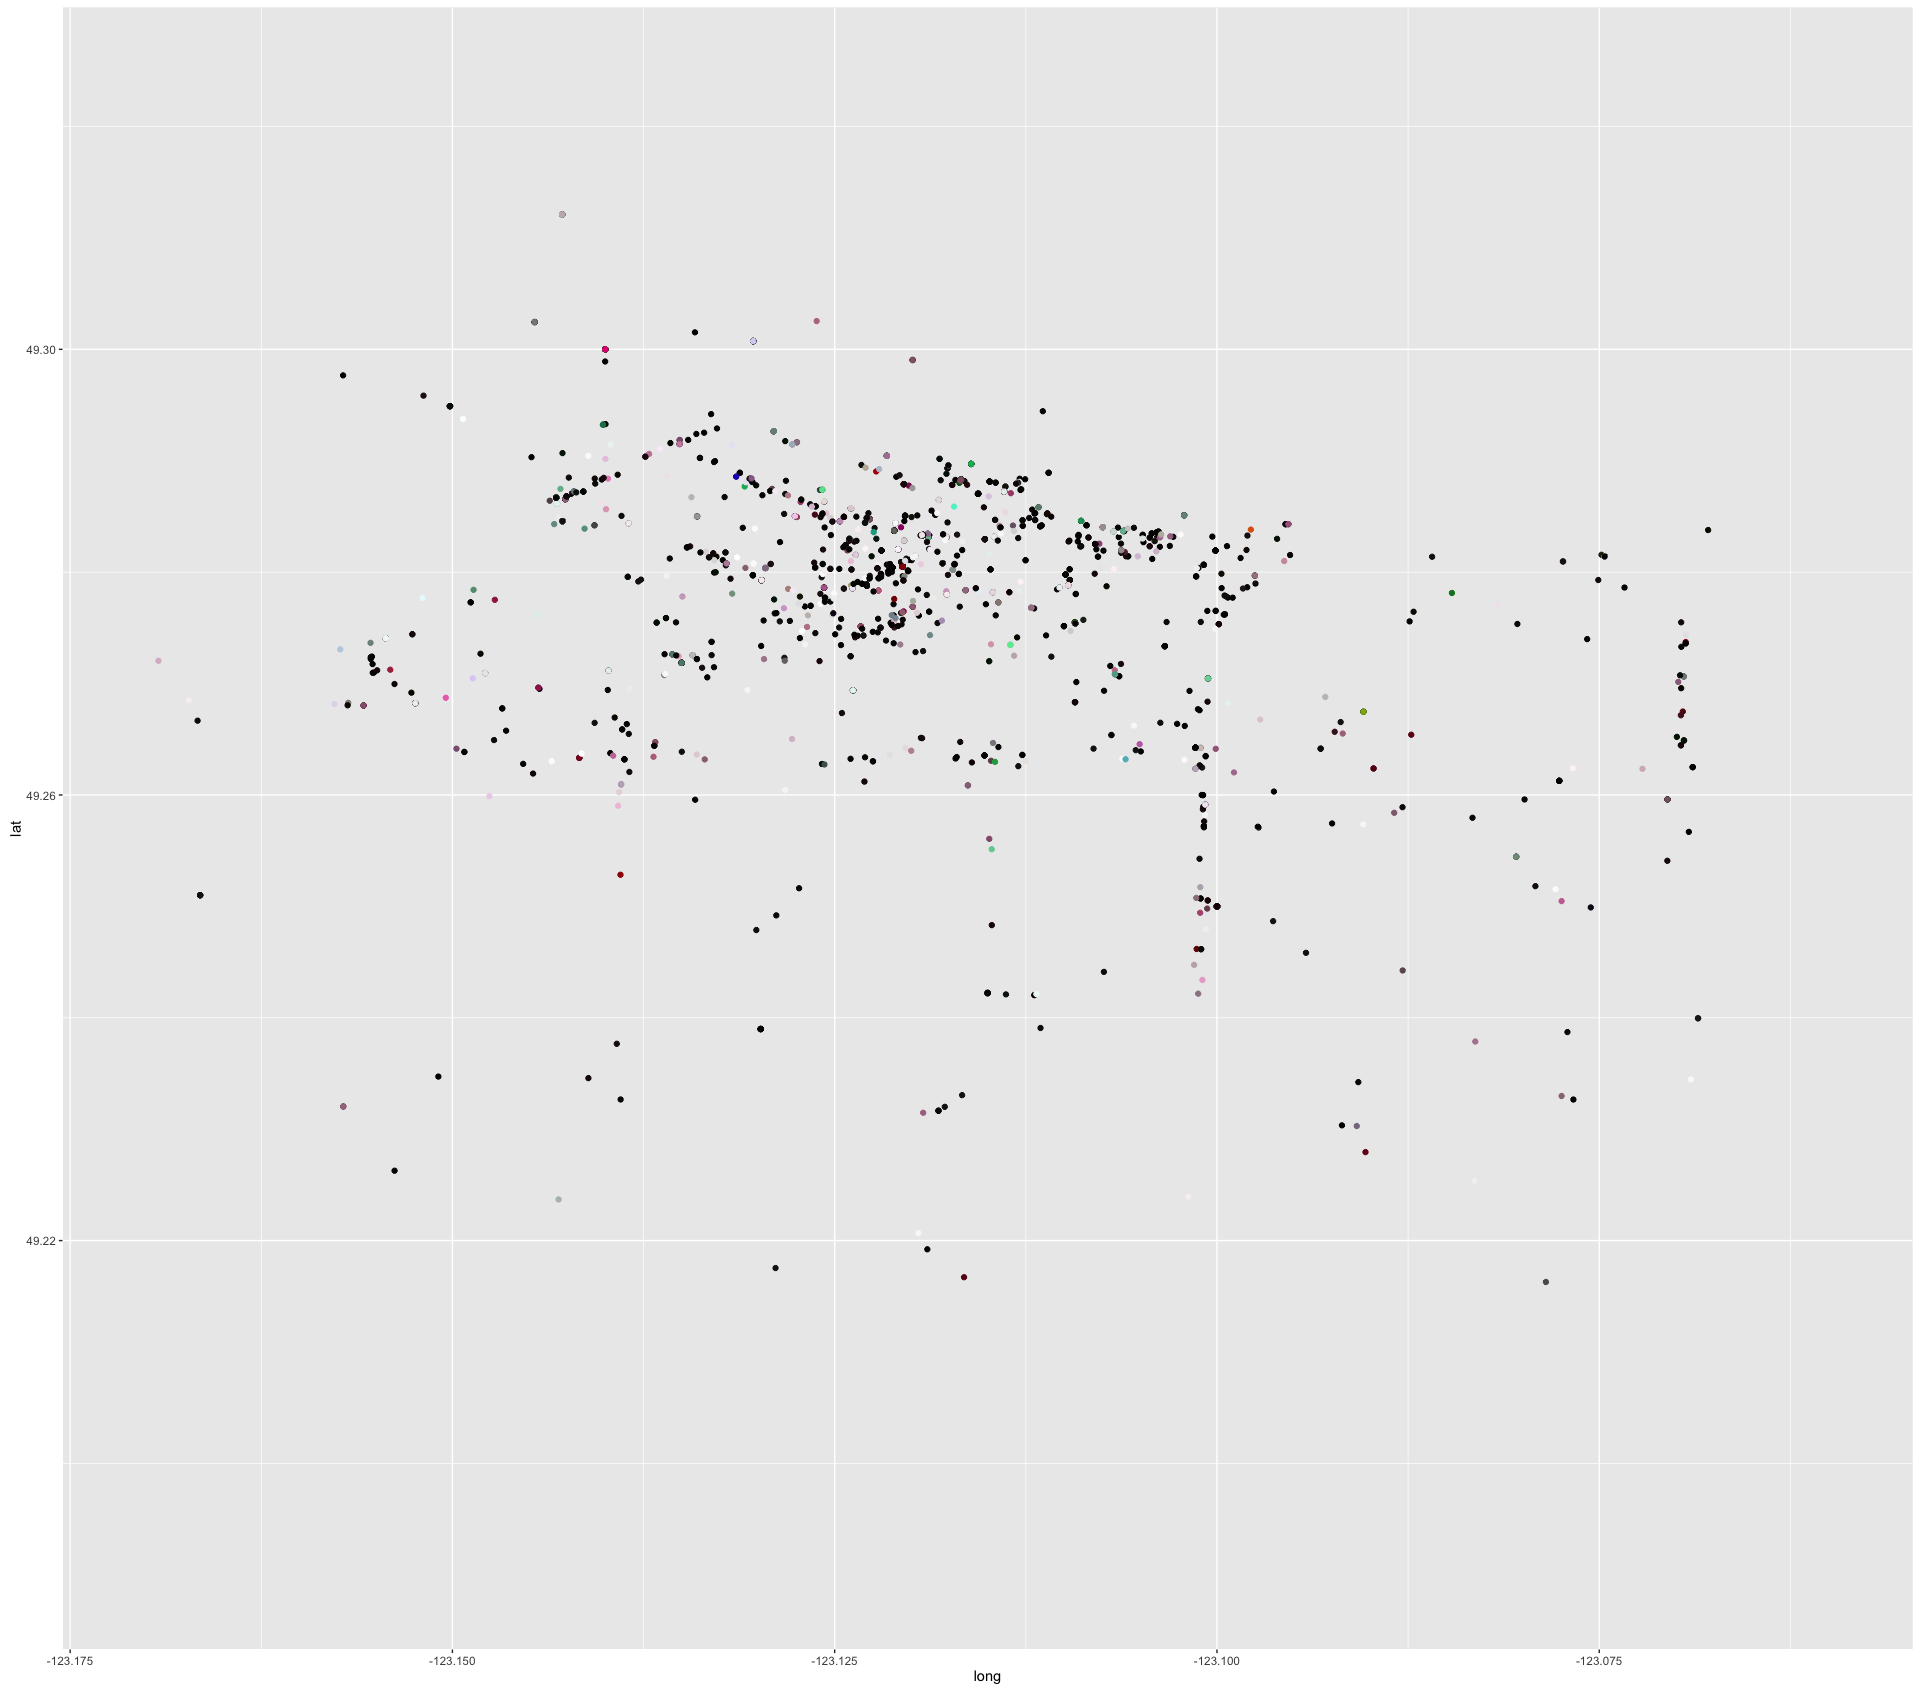
data3 = read.csv(file="~rtanglao/Dropbox/GIT/rtgram/first2000-ig-van-2015.csv", stringsAsFactors=F)- plot the data with limits, note the I() function for colours:
(p <- qplot(long, lat, geom = "point", data = data3,
color=I(data3$color), xlim=c(-123.17, -123.06),
ylim=c(49.19, 49.324)))- map:
- generate facets aka small multiples
f="~rtanglao/Dropbox/GIT/rtgram/13March2016-abbreviated-instagram-vancouver-top-colour-lat-long-date-2015.csv"
data6 = read.csv(file=f,stringsAsFactors=F)
(p <- qplot(long, lat, geom = "point", data = data6,
color=I(data6$color), xlim=c(-123.27, -123.005),
ylim=c(49.21, 49.324), size=I(1.0), alpha=I(0.4))+
facet_wrap(~date) + theme_minimal())- get dataset
./writeHexTopColourLatLonByDate.rb > 13March2016-instagram-vancouver-top-colour-lat-long-date-2015.csv- generate facets aka small multiples
f="~rtanglao/Dropbox/GIT/rtgram/13March2016-instagram-vancouver-top-colour-lat-long-date-2015.csv"
data6 = read.csv(file=f,stringsAsFactors=F)
(p <- qplot(long, lat, geom = "point", data = data6,
color=I(data6$color), xlim=c(-123.27, -123.005),
ylim=c(49.21, 49.324), size=I(1.0), alpha=I(0.4))+
facet_wrap(~date) + theme_minimal())- next up write an R script to generate a map from command line parameters for the date and then create a PNG of that file
- create 365 CSV files
mkdir CSV_FILES_FOR_GGMAP_2015
cd CSV_FILES_FOR_GGMAP_2015
../create365-CSV-files-ig-vancouver-2015-top-colour.rb- Create 365 maps
mkdir 1920PXx1920PX_MAPS_FOR_GGMAP2015 ; cd !$
ls -1 ../CSV_FILES_FOR_GGMAP_2015/*.csv | xargs -n 1 Rscript
../plot1-day-ig-van-2015-pointsize1.0.alph0.4.Rcd /Users/rtanglao/Dropbox/GIT/ig-ggmap/1920PXx1920PX_MAPS_FOR_GGMAP2015
- create png file list
ls -1 *.png > 365pngs.txt- make montage:
gm montage -verbose -adjoin -tile 7x53 +frame +shadow \
+label -adjoin -geometry '1920x1920+0+0<' null: \
null: null: @365pngs.txt null: null: null: \
19march2016-53x7-365days-ggmap-vancouver-instagram-2015-montage.png- timelapse requires jpegs
mkdir JPEGS
cd JPEGS
ls -1 ../*_*.png > 365pngs.txt- make the jpegs and the timelapse
mogrify -path . -format jpeg @365pngs.txt Make the timelapse using timelapse assembler on mac OR imagemagick or graphicsmagick convert
"%t" is the filename (without the filetype) escape for imagemagick. note that "convert" wouldn't work easily so I switched to "mogrify" which requires "-path ." to write to the current directory.
cd /Users/rtanglao/Dropbox/GIT/ig-ggmap/1920x1080-GGMAPS
mkdir ANNOTATED_WITH_DATE_JPEGS ; cd !$
ls -1 ../*_*.png | xargs -n 1 mogrify -path . -format \
jpg  -verbose -font Times-Bold -pointsize 32 \
-fill white  -undercolor '#00000080' \
-gravity southeast -annotate +0+5 %tfilter_step2_ig_van_neighbourhood_2015 <-
ig_van_neighbourhood_2015 %>%
filter(neighbourhood != "Maywood") %>%
filter(neighbourhood != "Whistler") %>%
filter(neighbourhood != "Burnaby") %>%
filter(neighbourhood != "Vancouver") %>%
filter(neighbourhood != "North Vancouver") %>%
filter(neighbourhood != "Surrey" ) %>%
filter(neighbourhood != "Norgate" ) %>%
filter(neighbourhood != "Deep Cove" ) %>%
filter(neighbourhood != "Sea Island" ) %>%
filter(neighbourhood != "Stride Hill" ) %>%
filter(neighbourhood != "West Vancouver" ) %>%
filter(neighbourhood != "Keith-Lynn" ) %>%
filter(neighbourhood != "Laurentian Belaire" ) %>%
filter(neighbourhood != "Greater Vancouver" ) %>%
filter(neighbourhood != "Cleveland Park" ) %>%
filter(neighbourhood != "Capilano" ) %>%
filter(neighbourhood != "Park Royal" ) %>%
filter(neighbourhood != "Ubc" ) %>%
filter(neighbourhood != "Squamish-Lillooet" ) %>%
filter(neighbourhood != "Horseshoe Bay" ) %>%
filter(neighbourhood != "Golden Village" )
(p <-
qmplot(
long, lat, geom = "point", data = filter_step2_ig_van_neighbourhood_2015,
color=I(filter_step2_ig_van_neighbourhood_2015$colour), xlim=c(-123.27, -123.005),
ylim=c(49.21, 49.324), size=I(1.0), alpha=I(0.4))+
facet_wrap(~neighbourhood) + theme_minimal())
p
qmplot(long, lat, geom = "point",
size=I(1.0), alpha=I(0.4),
data = filter_step2_ig_van_neighbourhood_2015,
source = "google",
maptype = "hybrid",
color = I(filter_step2_ig_van_neighbourhood_2015$colour)) +
facet_wrap(~ neighbourhood)- next up try: https://medium.com/fastah-project/a-quick-start-to-maps-in-r-b9f221f44ff3
- and:https://ourcodingclub.github.io/2016/12/11/maps_tutorial.html
m <- get_map("Vancouver",zoom=12,maptype="terrain",source="google")
n <- get_map("Vancouver",zoom=12,maptype="toner",source="stamen")

ggmap(n) + geom_point(data = filter_step2_ig_van_neighbourhood_2015,
                      aes(long,lat,color=I(filter_step2_ig_van_neighbourhood_2015$colour)),
                      size=2,alpha=0.7) +
  facet_wrap(~ neighbourhood)+
  theme_minimal()

o <- get_map("Vancouver",zoom=12,maptype="toner-lines",source="stamen")
ggmap(o) + geom_point(data = filter_step2_ig_van_neighbourhood_2015,
                      aes(long,lat,color=I(filter_step2_ig_van_neighbourhood_2015$colour)),
                      size=I(1.0),alpha=I(0.4)) +
  facet_wrap(~ neighbourhood)+
theme_void()gastown_map <- get_map("Gastown, Vancouver",zoom=15,maptype="toner-lines",source="stamen")
gastown_ig_van_2015 <-
filter_step2_ig_van_neighbourhood_2015 %>%
filter(neighbourhood == "Gastown")
ggmap(gastown_map) + geom_point(data = gastown_ig_van_2015,
aes(long,lat,color=I(gastown_ig_van_2015$colour)),
size=I(1.0),alpha=I(0.4)) +
theme_void()gastown_labels_map <- get_map("Gastown, Vancouver",zoom=15,maptype="toner-labels",source="stamen")
ggmap(gastown_labels_map) + geom_point(data = gastown_ig_van_2015,
aes(long,lat,color=I(gastown_ig_van_2015$colour)),
size=I(2.0),alpha=I(0.4)) +
theme_void()gastown_watercolor_map <- get_map("Gastown, Vancouver",zoom=15,maptype="watercolor",source="stamen")
ggmap(gastown_watercolor_map) + geom_point(data = gastown_ig_van_2015,
aes(long,lat,color=I(gastown_ig_van_2015$colour)),
size=I(2.0),alpha=I(0.4)) +
theme_void()kcc_watercolor_map <- get_map("Kensington-Cedar Cottage, Vancouver",zoom=15,maptype="watercolor",source="stamen")
kcc_ig_van_2015 <-
filter_step2_ig_van_neighbourhood_2015 %>%
filter(neighbourhood == "Kensington-Cedar Cottage")
ggmap(kcc_watercolor_map) + geom_point(data = kcc_ig_van_2015,
aes(long,lat,color=I(kcc_ig_van_2015$colour)),
size=I(6.0),alpha=I(0.4)) +
theme_void()commercial_watercolor_map <- get_map("Commercial, Vancouver",zoom=15,maptype="watercolor",source="stamen")
commercial_ig_van_2015 <-
filter_step2_ig_van_neighbourhood_2015 %>%
filter(neighbourhood == "Commercial")
ggmap(commercial_watercolor_map) + geom_point(data = commercial_ig_van_2015,
aes(long,lat,color=I(commercial_ig_van_2015$colour)),
size=I(6.0),alpha=I(0.4)) +
theme_void()ggplot(data=commercial_ig_van_2015, aes(x=long, y = lat))+
geom_point(aes(long,lat,color=I(commercial_ig_van_2015$colour)),
size=I(6.0),alpha=I(0.4))+
theme_void()ggplot(data=gastown_ig_van_2015, aes(x=long, y = lat))+
geom_point(aes(long,lat,color=I(gastown_ig_van_2015$colour)),
size=I(6.0),alpha=I(0.4))+
theme_void()- 1. In R Studio:
setwd("/Users/rtanglao/Dropbox/GIT/ig-ggmap/WITH_NEIGHBOURHOOD_CSV_FILES_FOR_GGMAP_2015/CHROMELESS_MAPS_FOR_EACH_NEIGHBOURHOOD")
write.csv(filter_step2_ig_van_neighbourhood_2015,
          file = "filter_step2_ig_van_neighbourhood_2015.csv",
row.names=FALSE)- 2. from the command line, get the neighbourhoods and create a map for each:
tail -n +2 filter_step2_ig_van_neighbourhood_2015.csv |\
cut -d "," -f5 | sort | uniq -c | \
sort -rn > reverse_sorted_vancouver_neighbourhoods.txt
cp reverse_sorted_vancouver_neighbourhoods.txt \
only_real_vancouver-reverse-sortedwithout-counts.txt
vi !$ # remove non real vancouver neighbourhoods and the counts
cat only_real_vancouver-reverse-sortedwithout-counts.txt | \
parallel -N 1 \
Rscript ../../create-overplotted-Vancouver-neighbourhood-map.R {}