A beautiful tile grid map is only a function call away! Tile grid maps are a great way to display geographic data when you want to represent regions with equal visual space. No shapefiles required, just supply a vector of postal abbreviations and a corresponding vector of colors. Built with base graphics.
If you're unfamilar with tile grid maps, check out the examples below or see the following news articles:
install.packages("minimap")# La Patria Es Primero
library(minimap)
minimexico(mexico_abb, colorRampPalette(c("#006847", "white", "#CE1126"))(32),
estados_name_colors = rep("black", 32))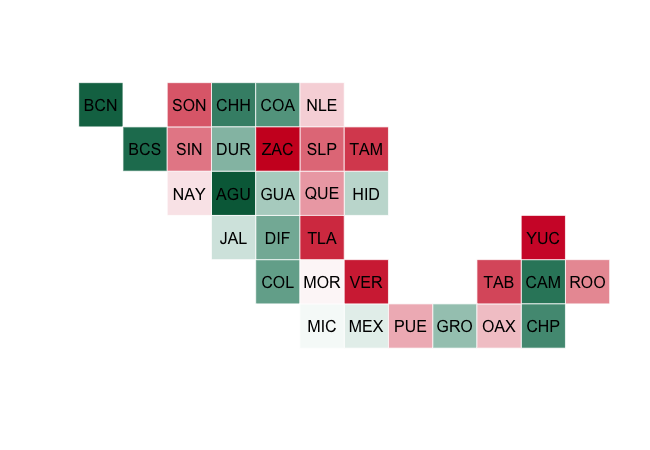
# Legal Status of Same Sex Marriage in the United States (2008)

library(minimap)

determine_color <- function(status){
  if(status == "bbs")
    "#FFE597"
  else if(status == "nl")
    "#F1F1F0"
  else if (status == "dis")
    "#D0C7B9"
  else if(status == "bbca")
    "#FDC471"
  else
    "#817972"
}

ssm$color <- as.character(sapply(ssm$Status, determine_color))
ssm_2008 <- ssm[ssm$Year == 2008,]
miniusa(ssm_2008$State, state_colors = ssm_2008$color, state_names = TRUE,
        state_name_colors = rep("white", 51))
title(main = "Legal Status of Same Sex Marriage in 2008", line = -1)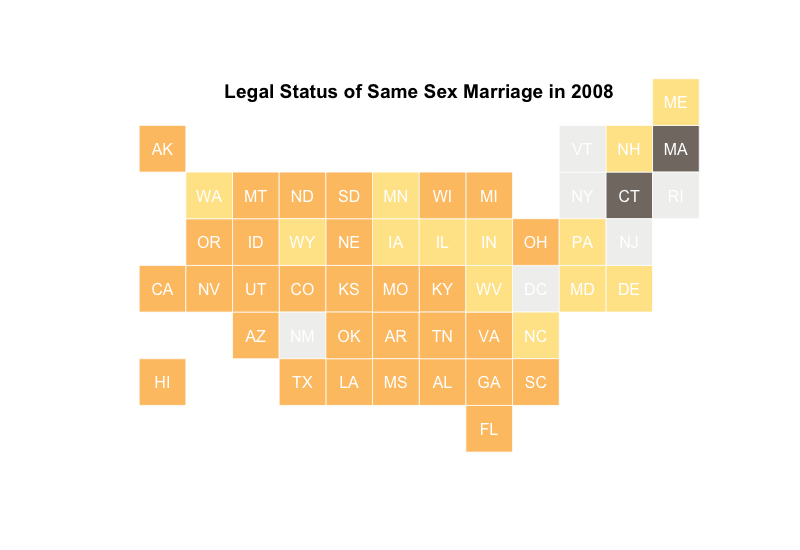
# Legal Status of Gay Marriage Over Time

library(minimap)

old_mai <- par()$mai
par(mai = c(0, 0, .75, .5), mfrow = c(2, 4))

for(i in 2008:2015){
  one_year <- ssm[ssm$Year == i,]
  miniusa(one_year$State, state_colors = one_year$color, state_names = FALSE)
  title(main = i, line = -2)
}

mtext("Legal Status of Gay Marriage Over Time", outer = TRUE, side = 3, line = -2)

par(mai = old_mai, mfrow = c(1, 1))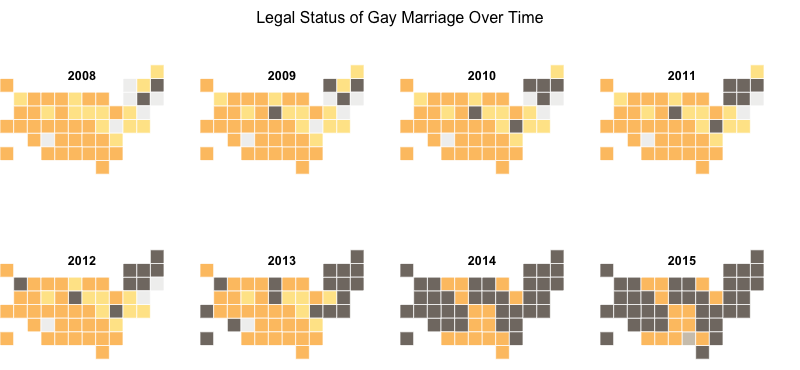
# Forty Years of Canadian Milk Production

library(minimap)
library(dplyr)
library(RColorBrewer)
library(animation)

bin <- function(x){
  qs <- as.numeric(quantile(x, seq(0, 1, .1)))
  sapply(x, function(y){
    which(abs(qs-y)==min(abs(qs-y)))
  })
}

milk_year <- milk %>%
  group_by(Region, Year) %>%
  summarise(Total_kL = sum(Kiloliters))

max_milk <- milk_year %>%
  group_by(Region) %>%
  summarise(Max = max(Total_kL))

milk_year <- milk_year %>%
  left_join(max_milk) %>%
  group_by(Region) %>%
  mutate(Bin = bin(Total_kL)) %>%
  select(Region, Year, Bin)

missing_pt <- setdiff(canada_abb, unique(milk_year$Region))

missing_milk <- data.frame(Region = rep(missing_pt, each = 40),
                           Year = rep(1976:2015, 3),
                           Bin = rep(0, 120), stringsAsFactors = FALSE)
milk_year <- rbind(milk_year, missing_milk)

milk_year$color <- sapply(milk_year$Bin, function(x){
  if(x == 0){
    "grey80"
  } else {
    brewer.pal(11, "PuOr")[x]
  }
})

ani.options(interval = 0.4, ani.width = 600, ani.height = 450)

saveGIF(
  for(i in 1976:2015){
    milkgif <- milk_year[milk_year$Year == i,]
    minicanada(milkgif$Region, pt_colors = milkgif$color, pt_name_cex = 1.5)
    title(main = paste("Canadian Milk Production in", i), line = -1)
  }
)
# Legal Status of Gay Marriage Over Time (gif)

library(minimap)
library(animation)

determine_color <- function(status){
  if(status == "bbs")
    "#FFE597"
  else if(status == "nl")
    "#F1F1F0"
  else if (status == "dis")
    "#D0C7B9"
  else if(status == "bbca")
    "#FDC471"
  else
    "#817972"
}

ssm$color <- as.character(sapply(ssm$Status, determine_color))

ani.options(interval = 0.5, ani.width = 600, ani.height = 450)

saveGIF(
  for(i in 1992:2015){
    one_year <- ssm[ssm$Year == i,]
    miniusa(one_year$State, state_colors = one_year$color)
    title(main = paste("Legal Status of Same Sex Marriage in", i), line = -1)
  }
)