View cryptocurrency charts in your terminal.
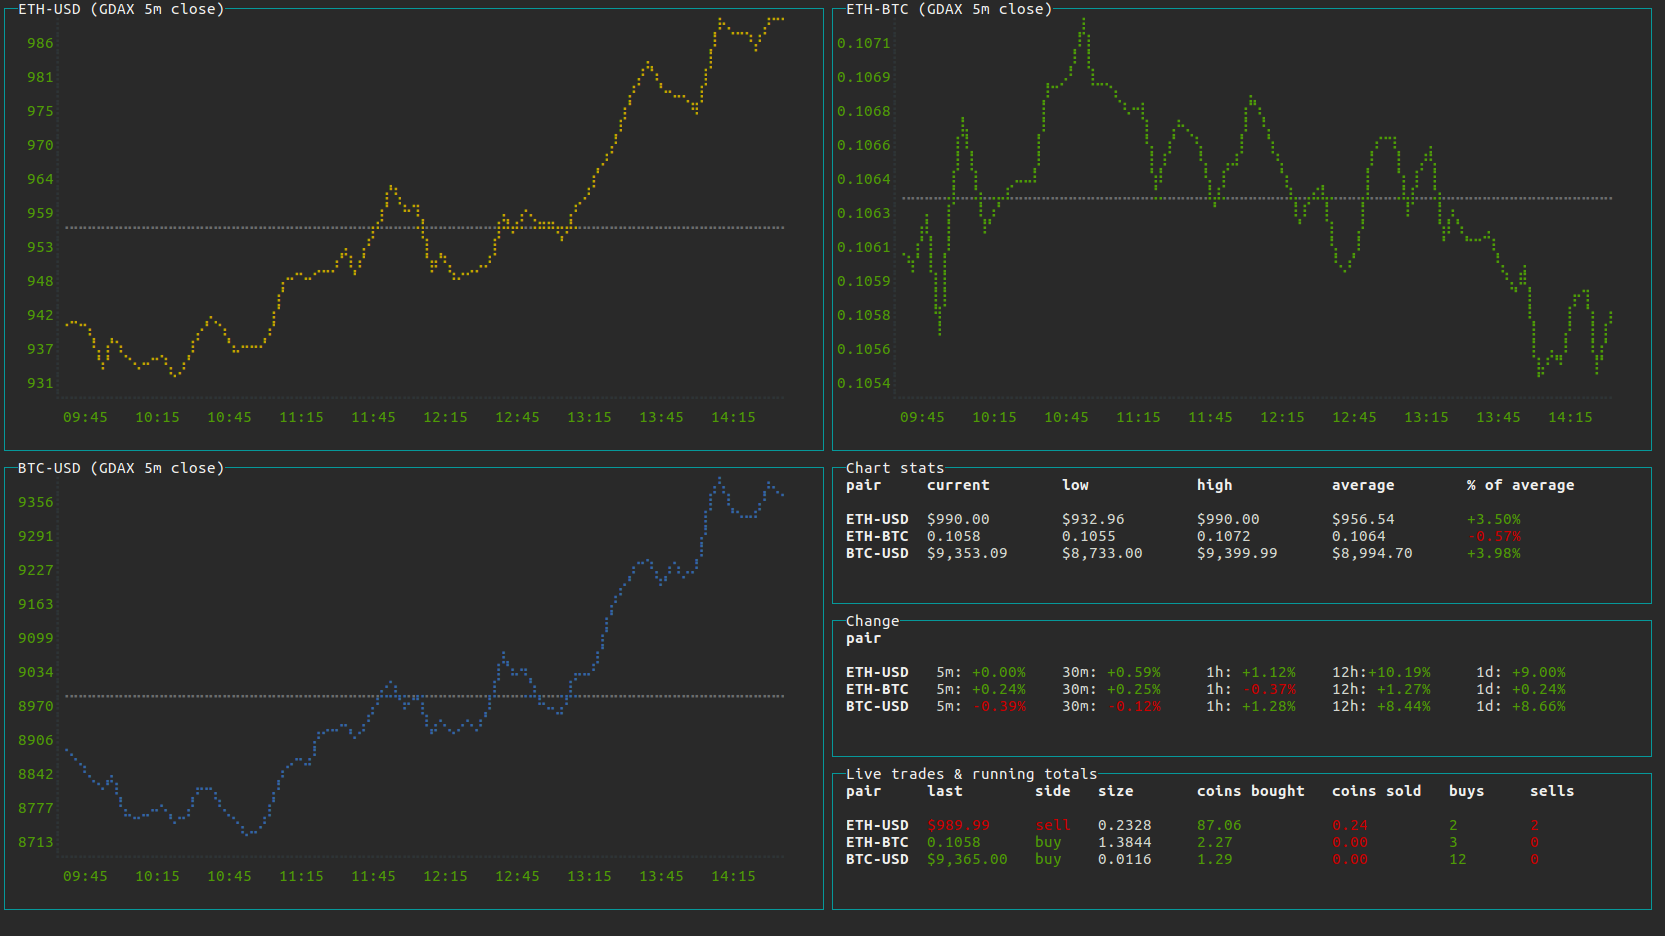
This app allows you to monitor 3 crypto trading pairs in your terminal.
Each trading pair has a corresponding line chart, price information, percentage change over time and live trading data.
Currently only supports GDAX exchange.
Node.js
Look up how to install Node.js on your system here: https://nodejs.org/en/download/package-manager/
Screen >= 22" recommended
git clone https://github.com/smoove/cli-crypto-charts.git
cd cli-crypto-charts
npm install
Edit the file config.ini in the application's directory.
Explanations can be found inside the file.
./cryptocharts.js or node cryptocharts.js
The line charts display the trading pairs you specified in the configuration. The timeframe/scale of each chart depends on the granularity setting of the corresponding pair
By default, the last candle in the chart is updated/animated using live trading data, if you don't like this behaviour, you can disable it in the configuration.
- current: Current exchange rate of the pair (rate of the last candle).
- low: Lowest exchange rate in the chart's timeframe.
- high: Highest exchange rate in the chart's timeframe.
- average: Average exchange rate in the chart's timeframe.
- % of average: Current exchange rate in relation to average exchange rate.
Displays percentage change in multiple timeframes. The timeframes shown depend on the granularity setting of each chart/pair.
Displays the latest trade for each pair and keeps track of running totals.
- last: Price of latest trade.
- side: Whether the latest trade was a buy order or sell.
- size: Amount of coins exchanged in latest trade.
- coins bought: The running total of coins bought during the app's runtime.
- coins sold: The running total of coins sold during the app's runtime.
- buys: The running total of buy side trades during the app's runtime.
- sells: The running total of sell side trades during the app's runtime.
- The main chart line's color bleeds into the average line when they get close or cross due to the way blessed renders charts. Ignore the colored parts of the average lines.
- Resizing the terminal window messes up chart rendering. Please resize the terminal window before starting the application.
- If either your internet connection drops, or GDAX's websocket goes down, the app currently does not reconnect, thus stopping the live trade updates until the app is restarted.
This application is licensed under the MIT License