Project Development KPIs monitors quantitative key performance indicators (KPIs) of product development teams. It exports project development KPIs from Jira and Github to prometheus for monitoring in metrics services such as Grafana. The current list of metrics provided is listed below.
- Lead & Cycle time based on a 5 issue rolling average.
- Counts of unresolved issues in your backlog by issue type and status. This enables the measures below.
- Tracking the number of
BugsandTechnical Debtissues in the project over time - Ratio of items in WIP to number of developers
- Number of products in WIP
- Cumulative flow diagrams
- Tracking the number of
- Sums of additions and commits in open pull requests in your repositories on Github representing "inventory."
A fundamental part performing as a development team is to deliver quickly with few errors. We aspire to 'move fast and break nothing.'
Engineers love quantitative measures of performance on goals. Lead and Cycle time measure how fast a team is moving. Measures of technical debt and bugs measure how many imperfections they are responsible for. Measures of inventory give visibility into how code moves through the development pipeline.
To build and test the project locally simply run the following commands.
$ make
$ make testA docker-compose configuration is included in this repository to make getting started with the project as simple as possible. To use it, follow the following steps.
Using the sample environment as a base, fill in your Jira and GitHub credentials. You can ignore JIRA_CONTROL_SECRET and JIRA_CONTROL_PATH for now.
$ cp config/sample.env config/production.env
$ vim config/production.envTo add your project for export, create a configuration JSON file.
$ cp config/sample_projects.json config/projects.json
$ vim config/projects.json
There you must specify the fields shown below.
project_nameis the prometheus label of your project.project_name_synonymsare any other synonymous labels for your group that can be found inmanifest.jsonfiles.project_idis the jira acronym of your project. It is the prefix of your issues before the-.product_granularityis theissuetypein Jira that maps to a product being delivered. Current granularity levels are 'Story' and 'Epic'.planning_workflow_statusesis an ordered list of workflow statuses an issue on your board goes through before reaching theIn Progressstatus.wip_workflow_statusesis an ordered list of workflow statuses an issue on your board goes through starting withIn Progressuntil, but not including, yourcompleted_state.completed_statusis your workflow's status for issues when the work has been successfully completed.
config/sample_projects.json provides a sample of this configuration.
To view your jira workflow, click 'View Workflow' next to the status indicator on any issue page. To check for the correct capitalization of each status check the transitions for an issue that can transition into the state your are interested as show below. Replace ORG_SUBDOMAIN with the jira subdomain of your organization and ISSUE_KEY with the key of the issue.
https://ORG_SUBDOMAIN.atlassian.net/rest/api/2/issue/ISSUE_KEY/transitions
To run with your newly configured environment, execute the following.
$ PDK_ENV=$(pwd)/config/production.env PDK_PROJECTS_CONFIG=$(pwd)/config/projects.json ./compose-ctl upBy default, a grafana instance preloaded with templated dashboards will be started. Use your browser to view http://localhost:3000. The default username is admin and default password is admin. The dasboards are then accessible under the 'Home' tab.
Please note that it takes ~20 minutes for data to start showing up on the dashboards. You may need to change the timescales.
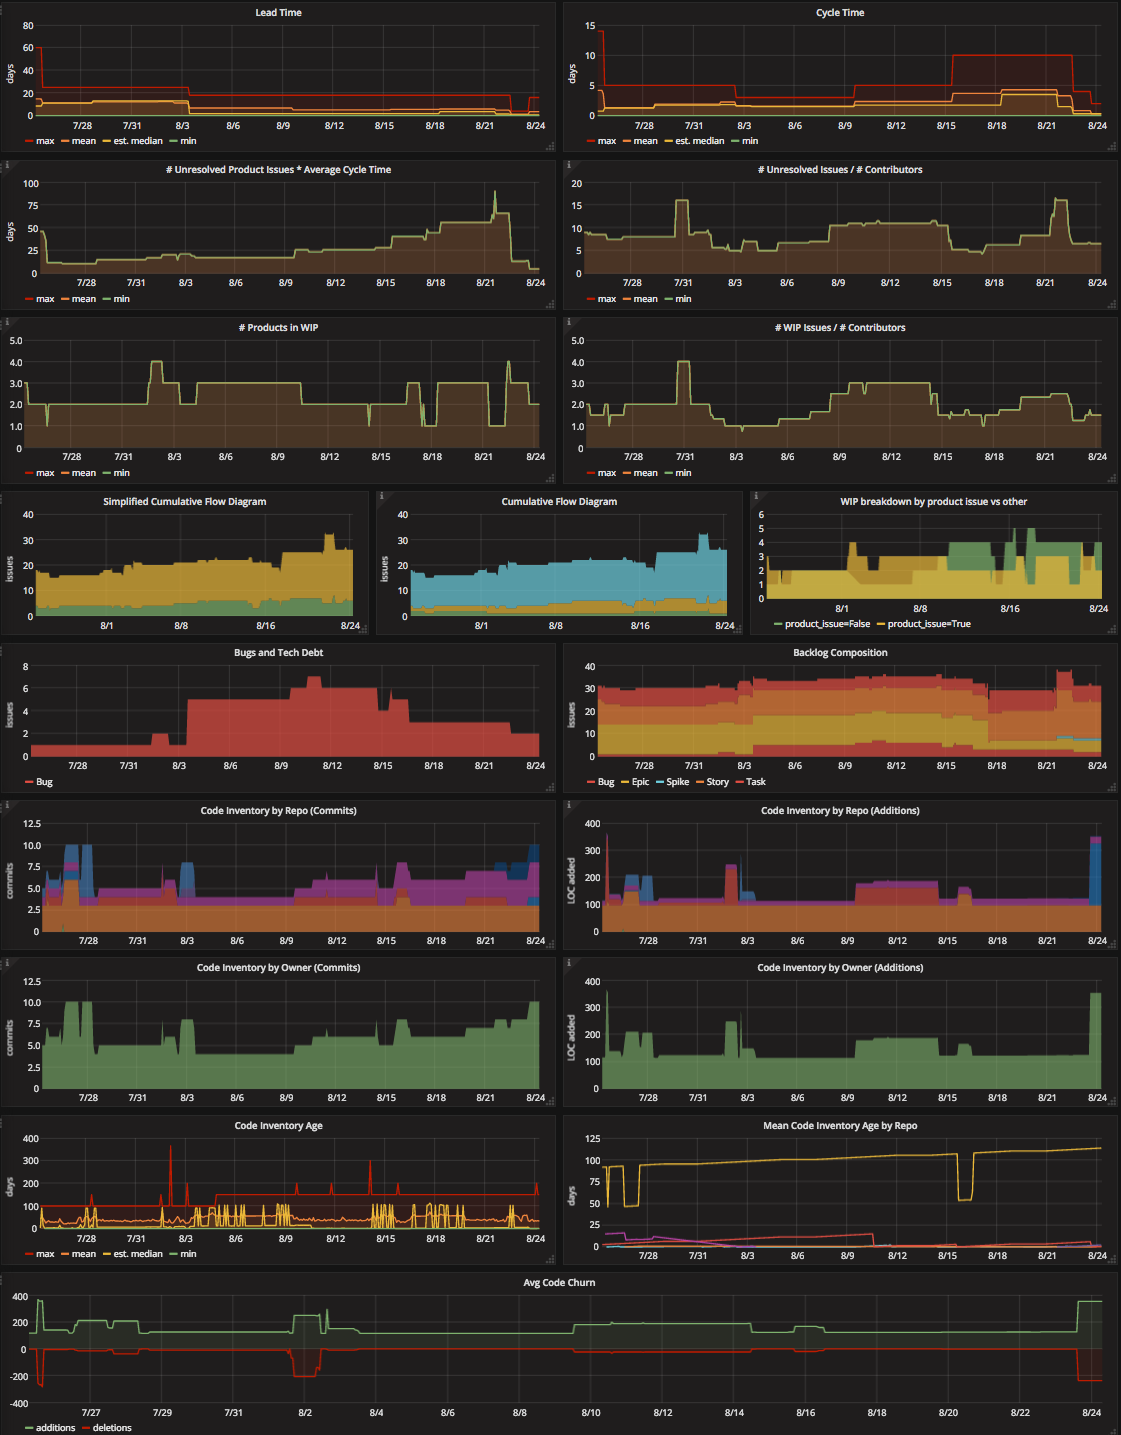
The files under dashboards/*.json contain two sample grafana dashboards described below.
The Project Development KPIs dashboard presents all metrics in detail and is meant for finer-grained analytics. See an image of the dasboard with data below.
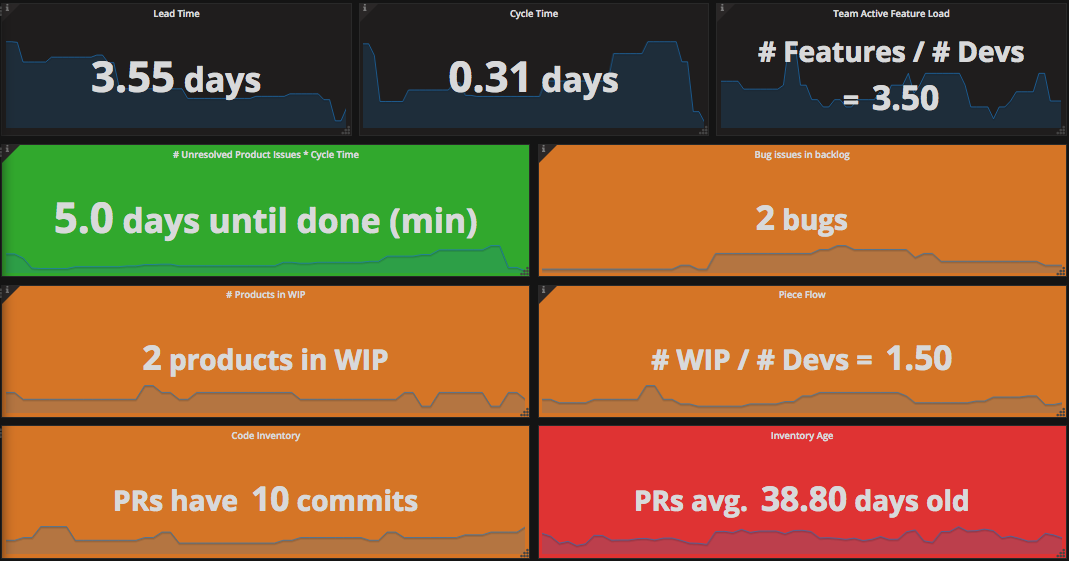
The Project Development KPIs | Summary dashboard is meant to be displayed in a team area as a simple visual control. It's color coded stats recommend actions for maximizing flow.
If you want to contribute to the project please read CONTRIBUTING.md.
Copyright (c) 2017 SoundCloud Ltd. | Process Optimization Group
See the LICENSE file for details.