| title | type | creator | ||||
|---|---|---|---|---|---|---|
Data Science Venn Diagram |
exercise |
|
This afternoon we are going to have a team-based competition. The goal is to create the best performing model on a hold-out sample of data. Simple right?
Well, there is a catch.
This will be a constrained optimization. To understand what that means, let's take a look at the Project Management Venn Diagram, below.
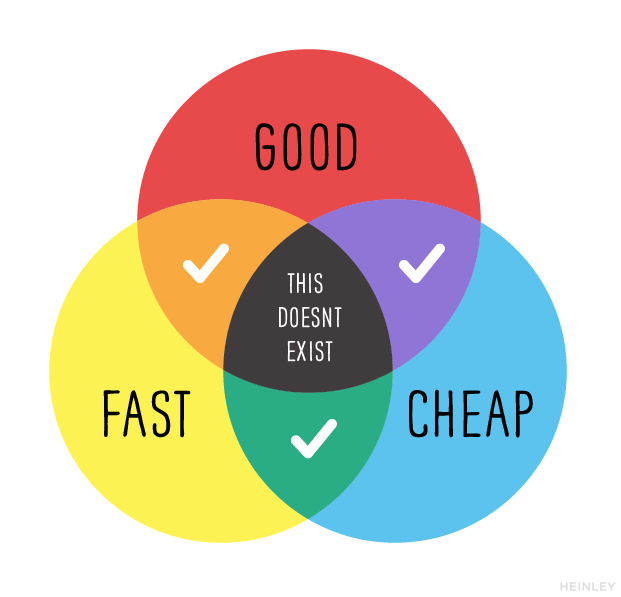
The idea is that for any project you can have any two of these. You can have good work done cheap, but it will take a long time. You can have good work done fast, but it won't be cheap. Or you can have work done fast and on the cheap, but it won't be good.
Today we will apply this concept to data science.
You will be given a dataset and teams will be randomly assigned to one constraint: samples, features or algorithm.
- Your choice of algorithm
- Your choice of features
- The class's sample constraint
- Your choice of algorithm
- The class's feature constraint
- Your choice of samples
- The class's algorithm constraint
- Your choice of features
- Your choice of samples
You should be aware that the class's constraint while not the worst-case scenario, will be highly unfavorable to you.
Your team will have until 5:30pm to build the best model possible under those constraints.

The feature data can be downloaded here and the target can be downloaded here. Descriptions of the data can be found here and here.
At 5:10, you will be given a holdout test set, you should return via Slack (@adam.blomberg) your predictions for each row in that set. This will simply be a csv with a single column of 1s and 0s without a header.
The task is to predict if a person's income is in excess of $50,000 given certain profile information.
Good luck!