This github repo is designed as a place to store/reference the data, code, and sources behind my 'Everything is Seasonal' talk at OpenVisConf.
The presentation itself can be found here
If your data includes change over time, take seasonality into account.
Seaonality are patterns that repeat over known, fixed periods of time -Wikipedia.
Assume that your metric has a seasonal cycle.
- Consider the seasonality of causal factors
- Aggregate to time periods that make sense for your data
- Sometimes seasonality is the story
- Adust for seasonality when estimating the impact of an event ('causal analysis')
- The seasonality that matters most might be in a subset of your data
- Seaonal patterns vary by place, culture, and lifestyle
Introduction to Time Series Decomposition
Blog post about seasonal adjustment with this package
Online interactive seasonal adjustment with R's seaonal package
Original 1990 article on STL decomposition.
STL in R. Note that STL operates on an object of the "ts", or time series" class. So, you'll need to convert data to this format first.

Google Blog Post describing Kay H. Brodersen's Causal Impact package
Inferring causal impact using Bayesian structural time-series models
Kim Larsen, of the Stitch Fix technology team, wrote a blog post describing their implementation of these methods: Making Causal Impact Analysis Easy
Check out Hyndman's work
Analyzing Functional Time Series The curves/functions/components that drive machine learning might also have seasonality. "Recent advances in computer recording and storing technology have tremendously increased the presence of functional data, whose graphical representation can be infinite-dimensional curve, image, or shape. When the same functional object is observed over a period of time, such data are known as functional time series."
C02 data at Mauna Loa, Hawaii observatory. Source. Filename: c02-maunaloa.
Daily data from Google's Big Query sample data. Based on data from the CDC.
CDC Vital Stats for minute of day data - see here for details to replicate
Described here
Aki on Gelman's blog. Chris Mulligan shared on Gelman's blog and Chris' work as he presents it.
Prison Sentences - not included in presentation as data was about # of cases a judge reviewed since previous break, but there is a relationship to time of day. In short, if you're going up for parole, hope that your case is first thing in the morning or right after a snack/lunch break.
Pathogen seasonality - also not included in presentation, but shows seasonality for different illnesses
Some Techniques for Visualizing Seaonality data
Flickr Flow by Fernanda Viégas and Martin Wattenberg
[Weather Circles by Zan Armstrong](http://weather.zanarmstrong.com/#city=NEW YORK&metric=normalTemperature&colored=1)
Ville Vivante by Interactive Things and the City of Geneva with Data Processing by the Near Future Laboratory, data from Swisscom, collaboration with the Lift Conference.
20 hours of Boston Traffic by Andy Woodruff using a script from Alyson Hurt. Project and analysis described by Andy on his blog.
Gun Sales Soar After Obama Calls for New Restrictions. Gregor describes the process and source data on his blog.
Why People Visit the Emergency Room by Nathan Yau of FlowingData
Visualizing MBTA Data by Mike Barry and Brian Card
Traffic accidents by Nadieh Bremer
...
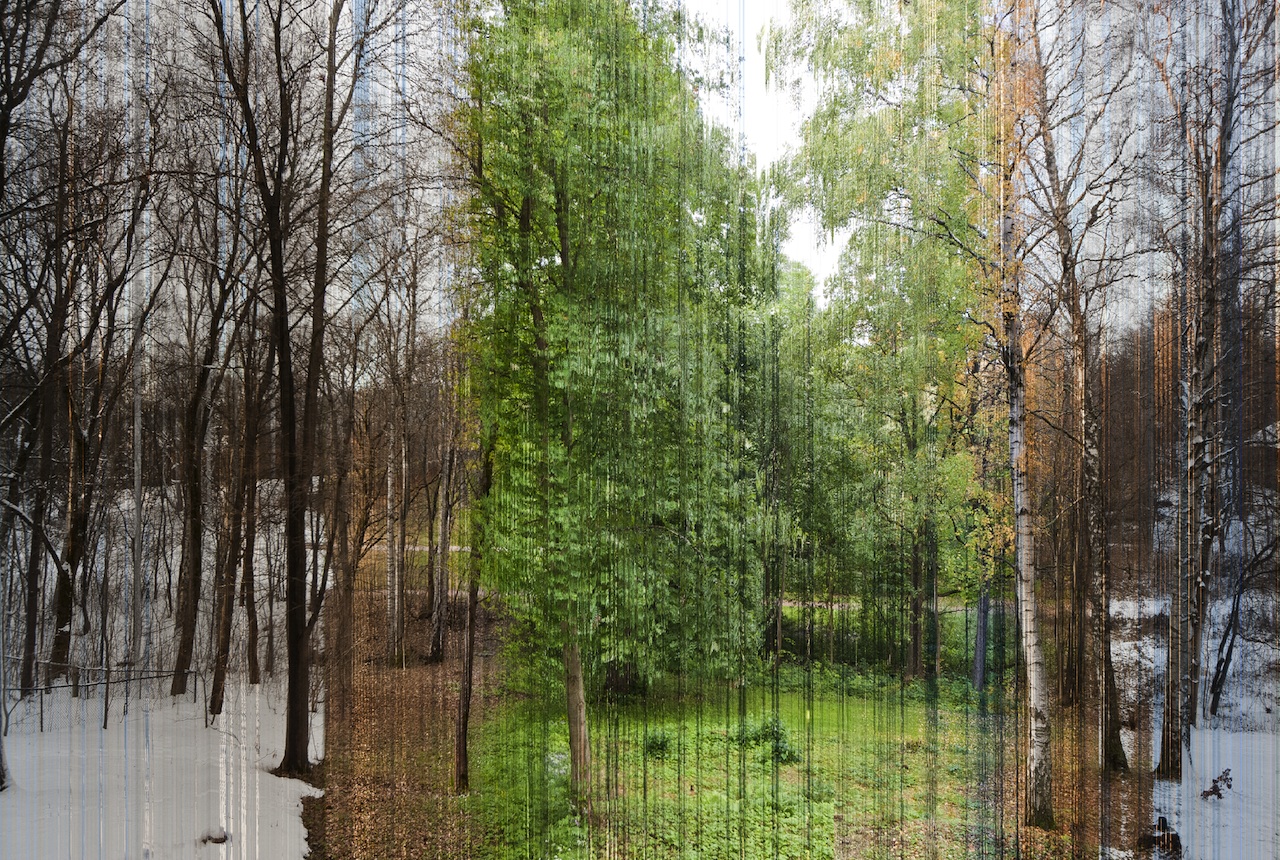
By Eirik Solheim: One Year in One Image

Mauna Loa Observatory(http://www.ncdc.noaa.gov/wdc/)

Time is a Dimension: Fong Qi Wei http://fqwimages.com/time-dimension/
Other images are from Pixabay. "All images and videos on Pixabay are released free of copyrights under Creative Commons CC0. You may download, modify, distribute, and use them royalty-free for anything you like, even in commercial applications. Attribution is not required."