- 1. Demographic Profile of an Account (resume-liked)
- 2. Demographic of Transaction
- 3. Set of Address
- 4. Token Summary
- 5. Exchange Flow Indicator
- 6. On-chain Flow Indicators CryptoQuant
- 7. Miner Index
- 8. Spot Market Indicator
- Background
- source (LT-BP)
- destination (LT-FP)
- Core Network Graph
- Most Significant Transaction Parties (Relevance)
- Timestamp of Significant Change
- Annotated Features
- Retention Rate
- Num of Transactions
- Total Received
- Total Sent
- Final Balance
- Transactions
- Fee
- BTC
- (17.704 sat/B - 7.025 sat/WU - 223 bytes)
- (28.000 sat/vByte - 141 virtual bytes)
- Hash
- Block
- Time 2022-07-17 05:03:04
- Size 113 (bytes)
- Total Input 0.00014639 BTC
- Total Output 0.00010691 BTC
- Fees 0.00003948 BTC
https://studio.glassnode.com/metrics?a=BTC&m=addresses.ActiveCount
1.1. Active Addresses
- Definition: The number of unique addresses that were active in the network either as a sender or receiver. Only addresses that were active in successful transactions are counted.
- GlassNode: https://studio.glassnode.com/metrics?a=BTC&category=Addresses&m=addresses.ActiveCount&s=1444561590&u=1445478418&zoom= 1.2. Sending Addresses
- Definition: The number of unique addresses that were active as a sender of funds. Only addresses that were active as a sender in successful non-zero transfers are counted.
- GlassNode: https://studio.glassnode.com/metrics?a=BTC&category=Addresses&m=addresses.SendingCount&s=1444561590&u=1445478418&zoom= 1.3. Receiving Addresses
- Definition: The number of unique addresses that were active as a receiver of funds. Only addresses that were active as a receiver in successful non-zero transfers are counted.
- GlassNode: https://studio.glassnode.com/metrics?a=BTC&category=Addresses&m=addresses.ReceivingCount&s=1444561590&u=1445478418&zoom=
GlassNode: https://studio.glassnode.com/metrics?a=BTC&category=Addresses&m=addresses.Min1UsdCount&s=1444561590&u=1445478418&zoom=
2.1. With Non-zero Balance
2.2. Balance ≥ 0.01
2.3. Balance ≥ 0.1
2.4. Balance ≥ 1
2.5. Balance ≥10
2.6. Balance≥100
2.7. Balance≥1k
2.8 Balance≥10k
GlassNode: https://studio.glassnode.com/metrics?a=BTC&category=Addresses&m=addresses.Min1UsdCount&s=1444561590&u=1445478418&zoom=
3.1. Balance ≥ $1
3.2. Balance ≥ $10
3.3. Balance ≥ $100
3.4. Balance ≥ $1k
3.5. Balance ≥ $10k
3.6. Balance ≥ $100k
3.7. Balance ≥ $1M
GlassNode: https://studio.glassnode.com/metrics?a=BTC&category=Addresses&m=addresses.NewNonZeroCount&s=1444561590&u=1445478418&zoom= 4.1. New Addresses:
- Definition:
- The number of unique addresses that appeared for the first time in a transaction of the native coin in the network.
- GlassNode: https://studio.glassnode.com/metrics?a=BTC&category=Addresses&m=addresses.NewNonZeroCount&s=1444561590&u=1445478418&zoom=
4.2. Total Addresses
- Definition:
- The total number of unique addresses that ever appeared in a transaction of the native coin in the network.
- GlassNode: https://studio.glassnode.com/metrics?a=BTC&category=Addresses&m=addresses.Count&s=1444561590&u=1445478418&zoom=
5.1. Address Supply Distribution
5.2. Supply Held by Addresses with Balance < 0.001
5.3. Supply Held by Addresses with Balance 0.001 - 0.01
5.4. Supply Held by Addresses with Balance 0.01-0.1 5.5. Supply Held by Addresses with Balance 0.1-1
5.6. Supply Held by Addresses with Balance 1-10
5.7. Supply Held by Addresses with Balance 10-100
5.8. Supply Held by Addresses with Balance 100-1k
5.9. Supply Held by Addresses with Balance 1k-10k
5.10. Supply Held by Addresses with Balance 10k-100k
5.11. Supply Held by Addresses with Balance >100k
6.1. Percent Addresses in Profit 6.2. Addresses in Profit - Definition: - The number of unique addresses whose funds have an average buy price that is lower than the current price. - "Buy price" is here defined as the price at the time coins were transferred into an address. 6.3. Addresses in Loss - Definition: - The number of unique addresses whose funds have an average buy price that is higher than the current price. - "Buy price" is here defined as the price at the time coins were transferred into an address.
7.1. Number of Addresses Depositing to Exchanges - Definition: - The number of unique addresses that appeared as a sender in a transaction sending funds to exchanges. 7.2. Number of Addresses Withdrawing from Exchanges - Definition: - The number of unique addresses that appeared as a receiver in a transaction receiving funds from an exchanges.
8.1. Accumulation Addresses - have at least 2 incoming non-dust transfers and have never spent funds. Exchange addresses and addresses receiving from coinbase transactions (miner addresses) are discarded. To account for lost coins, addresses that were last active more than 7 years ago are omitted as well. - Bitcoin dust is a series of trace amounts of bitcoins that individually are less valuable than the computing power or fee that is required to process them; as a result, the transaction is impossible to process. - The cost of the fee to process a bitcoin transaction fluctuates based on the volume of transactions on the network. - While Bitcoin dust can slow down network transactions, attempting to clean up Bitcoin dust can create a privacy problem, especially for small users.
8.2. Accumulation Addresses [BTC] - The total amount of funds held in accumulation addresses. - Accumulation addresses are defined as addresses that have at least 2 incoming non-dust transfers and have never spent funds. - Exchange addresses and addresses receiving from coinbase transactions (miner addresses) are discarded. To account for lost coins, addresses that were last active more than 7 years ago are omitted as well.
-
Holders Making Money at Current Price
- Definition:
- For any addresses with a balance of tokens, ITB identifies the average cost at which those tokens were purchased and compares it to current price.
- If Current Price > Average Cost
- address is in the Money
- If Current Price < Average Cost
- address is Out of Money
- More: https://resources.intotheblock.com/blockchain-analytics/token-summary#holders-making-money-at-current-price
- Definition:
-
Concentration by Large Holders
- Definition: This indicator aggregates the percentage of circulating supply held by whales (addresses holding over 1% of supply) and investors (addresses holding between 0.1%-1%). The sum of these two is the total concentration by large holders.
- Input: the percentage of circulating supply held by
- whales (addresses holding over 1% of supply)
- investors (addresses holding between 0.1%-1%)
- Calculation
- sum of these two is the total concentration by large holders.
- More: https://resources.intotheblock.com/blockchain-analytics/token-summary#concentration-by-large-holders
-
Price Correlation with Bitcoin
- Definition:
- 30-day price correlation with BTC
- More: https://resources.intotheblock.com/blockchain-analytics/token-summary#price-correlation-with-bitcoin
- Definition:
-
Holders' Composition by Time Held
- Defintion:
- Classification of addresses according to their weighted average holding period of the token
- More: https://resources.intotheblock.com/blockchain-analytics/token-summary#holders-composition-by-time-held
- Defintion:
-
Transactions Greater than $100K
- Definition:
- Number of transactions each value is greater than $100K
- More: https://resources.intotheblock.com/blockchain-analytics/token-summary#transactions-greater-than-usd-100-k
- Definition:
-
Transactions Demographics
- Defintion:
- Num of transactions that occur during Western trading times (10AM to 10PM UTC) vs those that occur during Eastern trading times (10PM to 10AM UTC) for the last 14 days
- More: https://resources.intotheblock.com/blockchain-analytics/token-summary#total-exchanges-inflows
- Defintion:
-
Total Exchanges Inflows
- Definition:
- Total amount (in $ or tokens) entering exchange(s) deposit wallets
- More: https://resources.intotheblock.com/blockchain-analytics/token-summary#total-exchanges-outflows
- Definition:
-
Total Exchanges Outflows
- Total amount (in $ or tokens) entering exchange(s) withdrawal wallets
-
Net Network Growth
- Definition: This signal measures the change in the total number of addresses for a particular crypto-asset.
- Specifically, it tracks the variation relative to the previous week’s total addresses, optimizing the thresholds considered bullish or bearish to each asset’s nature.
- More: https://resources.intotheblock.com/blockchain-analytics/actionable-signals/on-chain-signals#net-network-growth
- Definition: This signal measures the change in the total number of addresses for a particular crypto-asset.
-
In-the-money
- Interpretation:
- Using IntoTheBlock’s In/Out of the Money indicator, we are able to estimate the volume of tokens that are in the money, or profiting for a particular crypto-asset at a given price level. This model follows the 7-day moving average in the total volume of supply in the money and compares it to the value from the previous day.
- Interpretation:
-
Concentration
- Input: addresses that hold over 1% of circulating supply, and investors, addresses that hold between 0.1% and 1% of supply.
- Definition: The concentration signal measures daily changes in the positions of whales, addresses that hold over 1% of circulating supply, and investors, addresses that hold between 0.1% and 1% of supply.
- Interpretation:
- If whales and investors are adding to their positions it is generally bullish, though the specific thresholds vary by crypto-asset.
- More: https://resources.intotheblock.com/blockchain-analytics/actionable-signals/on-chain-signals#concentration
-
Large Transactions
- Interpretation: Based on IntoTheBlock’s large transactions metric, this signal analyzes shifts in the number of transactions of over $100,000, and acts as a proxy to institutional investors’ and high net-worth individuals’ activity. The model is optimised by tracking the convergence/divergence between the 21-day exponential moving average (EMA) and the 30-day EMA for large transactions. More: https://resources.intotheblock.com/blockchain-analytics/actionable-signals/on-chain-signals#concentration
- Smart Price
- Defintion:
- A variation of the mid price where the average of the bid and ask prices is weighted according to their inverse volume (i.e.,
- the bid is weighted with the volume posted at the ask, and
- the ask is weighted with the volume posted at the bid
- A variation of the mid price where the average of the bid and ask prices is weighted according to their inverse volume (i.e.,
- More: https://app.intotheblock.com/coin/BTC
- Defintion:
- Bid-Ask Volume Imbalance
- Definition:
- Volume at the bid price - Volume at the ask price
- More: https://app.intotheblock.com/coin/BTC
- Definition:
- Futures Market Premium
- Definition:
- Signal combining futures price, volume and open interest assessing bullish or bearish momentum
- More: https://app.intotheblock.com/coin/BTC
- Definition:
On-chain flows display how crypto assets are moving to and from exchanges. Data could be subject to change as IntoTheBlock's models evolve over time.
- View Group Chart: https://app.intotheblock.com/coin/BTC/deep-dive?group=exchanges&subgroup=on-chain-flows&chart=all
-
On-chain Flows
- Definition: Total amount (in $ or tokens) entering exchange(s) deposit wallets. "All Exchanges" refers to all supported exchange
-
Inflow Transaction Count
- Definition: Total number of deposit transactions
- Changes: in Percentage %
- 24h Change, 7-Day Change, 30-Day Change
-
Outflow Volume
- Definition: Total amount (in $ or tokens) leaving exchange(s) withdrawal wallets.
- Changes: in Percentage %
- 24h Change, 7-Day Change, 30-Day Change
-
Outflow Transaction Count
- Definition: Total number of withdrawal transactions
- Changes: in Percentage %
- 24h Change, 7-Day Change, 30-Day Change
-
Netflows
- Definition: Netflows show the difference between tokens entering an exchange - those leaving exchanges
- Changes: in BTC
- 24h Change, 7-Day Change, 30-Day Change
-
Total Flows
- Definition: Sum of amount entering an exchange plus the amount leaving an exchange
- Changes: in Percentage %
- 24h Change, 7-Day Change, 30-Day Change
A money flow of Bitcoin transferred to and from exchange wallets to evaluate investors' behavior. Group Chart: https://cryptoquant.com/asset/btc/chart/exchange-flows
- Definition: The total number of coins held in the exchange.
- Input: (same as Definition)
- Description:
- As the values continue to rise in reserve, it indicates higher selling pressure and has shown an opposite trend in price in general.
- For stablecoin, value rise indicates buying pressure
- For derivative exchange, since coins could be used to open both long/short, a rise in reserve values indicates possible high volatility.
- View: https://cryptoquant.com/asset/btc/chart/exchange-flows/exchange-reserve?exchange=all_exchange&window=DAY&sma=0&ema=0&priceScale=log&metricScale=linear&chartStyle=line
- User Guide: https://dataguide.cryptoquant.com/exchange-flows-indicators/exchange-reserve-1
- API: https://cryptoquant.com/docs#operation/BTCgetReserve
- Transactions Count:
- Definition: This endpoint returns the number of transactions flowing in/out of Bitcoin exchanges.
- API: https://cryptoquant.com/docs#operation/BTCgetTransactionsCountEF
- Addresses Count:
- Definition: This endpoint returns the number of addresses involved in inflow/outflow transactions
- API: https://cryptoquant.com/docs#operation/BTCgetAddressesCountEF
- Netflow
- Definition: https://cryptoquant.com/docs#operation/BTCgetExchangeNetflow
- The difference between coins flowing into and out of the exchange. (Inflow - Outflow = Netflow)
- Positive value indicates reserve in increasing.
- For spot exchange, high value indicates increasing selling pressure.
- For derivative exchange, high value indicates possible high volatility.
- View: https://cryptoquant.com/asset/btc/chart/exchange-flows/exchange-netflow-total?exchange=all_exchange&window=DAY&sma=0&ema=0&priceScale=log&metricScale=linear&chartStyle=column
- User Guide: https://dataguide.cryptoquant.com/exchange-flows-indicators/exchange-in-outflow-and-netflow
- API: https://cryptoquant.com/docs#operation/BTCgetExchangeNetflow
- Definition: https://cryptoquant.com/docs#operation/BTCgetExchangeNetflow
- Inflow
- API: https://cryptoquant.com/docs#operation/BTCgetInflow
- Inflow (Total)
- Definition: The total amount of coins transferred to the exchange.
- Description:
- High value indicates higher selling pressure in the spot exchange. (For stablecoin, value rise indicates buying pressure)
- For derivative exchange, since coins could be used to open both long/short, rise in inflows indicates possible high volatility.
- Inflow (Mean, MA7)
- Definition: The 7 days moving average of mean coins inflow to the exchange.
- Description:
- Higher value indicates investors who deposited a lot at once are increasing recently.
- It could indicate higher selling pressure and future price drop. (For stablecoin, value rise indicates buying pressure)
- Outflow
- API: https://cryptoquant.com/docs#operation/BTCgetOutflow
- Outflow (Total)
- Definition: The total amount of coins transferred from the exchange.
- Description: High value indicates decreasing selling pressure in the spot exchange.
- Outflow (Mean, MA7)
- Definition: The 7 days moving average of mean coins outflow from the exchange.
- Description:
- High value indicates investors who withdrew a lot at once are increasing recently.
- It could indicate decreasing selling pressure.
- Definition: The total number of withdrawals count from the exchange.
- Description:
- High value indicates more transactions were made for long-term holding in high possibility.
- For derivative exchange, it could indicate the number of withdrawals increased to participate less in derivative trades.
- More: https://dataguide.cryptoquant.com/exchange-flows-indicators/exchange-addresses-count
- API: https://cryptoquant.com/docs#operation/BTCgetAddressesCountEF
- Definition: The total amount of coins circulated within the exchange's wallets.
- View: https://cryptoquant.com/asset/btc/chart/exchange-flows/exchange-in-house-transactions?exchange=all_exchange&window=DAY&sma=0&ema=0&priceScale=log&metricScale=linear&chartStyle=line
- API: https://cryptoquant.com/docs#operation/BTCgetInHouseFlow
Flow Indicator: on on-chain models to signal possible price movements by assessing the value of Bitcoin and allow investors and traders to operate with confidence.
- On-chain models to signal possible price movements by assessing the value of Bitcoin and allow investors and traders to operate with confidence.
-
Miners' Position Index (MPI)
- Definition: the ratio of total miner outflow (USD) to its one-year moving average of total miner outflow (USD).
- Description:
- Higher value shows that miners are sending more coins than usual which indicates possible selling.
- If miners send some proportion of their reserve at the same time, it could trigger a price drop.
- Details:
- MPI(Miners’ Position Index) is a z score of a specific period. The period range must be 2 days or more and if not, it will return an error.
mpiis an index to understand miners’ behavior by examining the total outflow of miners. It highlights periods where the value of Bitcoin’s outflow by miners on a daily basis has historically been extremely high or low. - MPI values above 2 indicate that most of the miners are selling Bitcoin.
- MPI values under 0 indicate that there is less selling pressure by miners.
- MPI(Miners’ Position Index) is a z score of a specific period. The period range must be 2 days or more and if not, it will return an error.
- Guide: https://dataguide.cryptoquant.com/miner-flows-indicators/miners-position-index
- API
-
Exchange Whale Ratio
- Definition: The ratio of the top 10 inflows to the total inflows of the exchange.
- Description:
- High values indicate whales are using the exchanges in large amount.
-
Exchange Inflow CDD Coin Days Destroyed (CDD) of coins destroyed by flowing into exchanges.
-
Fund Flow Ratio
- Definition: The ratio of coins transfers involving the exchange to the overall coins transfers network-wide.
- Description:
- High values indicate investors are actively using the exchanges.
-
Exchange Stablecoins Ratio USD
- Definition: Coins reserve(USD) divided by all stablecoins reserve held by the exchange.
- Description:
- Low values mean buying power which leads to possible price rise.
-
Exchange Stablecoins Ratio
- Definition: Coins reserve divided by all stablecoins reserve held by the exchange.
- Description:
- Low values mean buying power which leads to possible price rise.
-
- Definition: If there's no outflow from the exchange, the value is 1, otherwise 0.
Continuous appearance of '1' indicates exchange withdrawal system is not functioning. - Description:
- Stay Ahead of Exchange Hacks. See hacks as they happen by identifying sudden increases and become zero in exchange outflows and hedge against potential risk.
- API: https://cryptoquant.com/docs#operation/getExchangeShutdownIndex
- Definition: If there's no outflow from the exchange, the value is 1, otherwise 0.
-
- Inflow CDD
- Definition: Coin Days Destroyed (CDD) of coins destroyed by flowing into exchanges.
High values indicate that more long-term holders moved their coins for the purpose of possible selling.
This indicator is a noise-removed version of CDD with respect to exchange dumping signal.
- Definition: Coin Days Destroyed (CDD) of coins destroyed by flowing into exchanges.
source: https://app.intotheblock.com/coin/BTC/deep-dive?group=mining&chart=all
-
Miner Reserves Balances of addresses belonging to mining pools 7-Day Change, 30-Day Change, 90-Day Change
-
Miner Inflows (BTC/USD)
- Definition:
- Volume (in $ or crypto terms) flowing into mining pools' addresses
- Type: - 7-Day Change, 30-Day Change, 90-Day Change
- Guide:
- Miner Outflows (BTC/USD)
- Definition: Volume (in $ or crypto terms) flowing out of mining pools' addresses
- Type:
- 7-Day Change, 30-Day Change, 90-Day Change
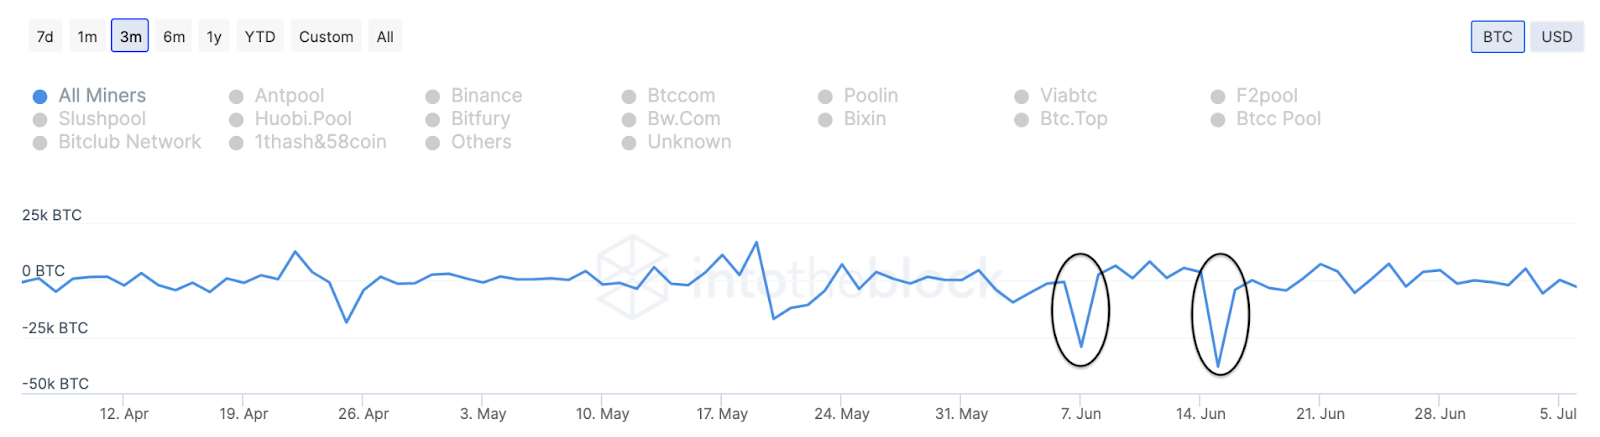
- Interpretation:
- Since miners have been accumulating crypto since the early days, Miner Outflows can show valuable patterns of how they manage it. In the graph above, there are two or three spikes in miner outflows.
- Miner outflows can suggest miners are transferring out part of their crypto holdings into exchanges to sell. In this case, one spike occurred right before the first announcement of the Chinese crackdown on mining on May 19, hinting at the possibility that some miners may have been aware of the regulations coming.
- Then on June 7 and 15, miner outflows spiked again as the mining ban went into effect. This pattern points to miners selling part of their Bitcoin holdings in light of the crackdown. Given that sending miner equipment internationally can be expensive, it is likely that the spike in miner outflows was due to miners covering these costs by selling their positions.
- Miner Netflows
- Interpretation:
- Miner Netflows is one of the most useful indicators to fully understand the behavior of miners. Since miner inflows and outflows tend to move in tandem, the difference between them is more valuable than either separately.
- ⭐️ Quick Tip: By analyzing miner netflows, users can gauge if overall miners are accumulating or selling; high positive values point to accumulation, while negative numbers indicate net selling.
- In the example above, we can clearly see two sharp drops in miner netflows.
- This means that the amount leaving miners’ addresses was much higher than the amount entering them. In other words, miner rewards and acquisitions were meager relative to miner outflows. Ultimately, this suggests strong selling activity from miners in light of the Chinese mining crackdown.
- Interpretation:
- Miner Total Flows
- Interpretation:
- Miner Total Flows are helpful to understand the total amount of miner activity taking place.
- In the graph above, we can see that total miner activity had been trending downwards, up until mid-May as uncertainty regarding Chinese mining migration arised.
- Interpretation:
- Miner Flows Volume Share
- Definition: The percentage that miners' total flows make out of the total on-chain volume on a given day
- Description: divides Miners’ Total Flows by the total on-chain transaction volume. The result represents the share that miner activity makes out of all transaction volume.
- Interpretation:
- The Miner Flows Volume Share indicator is helpful to put miner activity relative to the total amount of on-chain volume.
- As seen above, the significance of miner activity has been decreasing significantly, particularly after every halving as signalled by the arrows on top of the graph.
- Overall, this is valuable information to consider.
- Particularly in periods like during the May-June 2021 Chinese mining migration, it is worth pointing out that although miners do manage high Bitcoin reserves, they represent a small fraction of the total activity happening on the blockchain.
- Hash Rate
- Definition: speed at which a mining machine is operating to solve the mathematical puzzle that “solves” and essentially validates a block.
- Description:
- The Hash Rate is a measure of the aggregate computing power provided by miners in a Proof of Work (PoW) blockchain. In the case of Bitcoin, the hash rate is the total power allocated to solving the cryptographic problem SHA-256
- measure of the aggregate computing power provided by miners in a proof of work blockchain.
- In the case of Bitcoin, the hash rate is the total power allocated to solving the cryptographic problem SHA-256 through which consensus is reached between all nodes, publicly validating transactions in the blockchain.
- A blockchain ’s hash rate is often associated with its security.
- This is the case as more computing power allocated to validate transactions make it more expensive to attempt to attack the blockchain.
- Therefore, increases in hash rate can be interpreted as improvements in the underlying blockchain security.
- Interpretation: (Bitcoin’s long-term hash rate)
- By securing the network, the hash rate is a prevalent indicator of the blockchain’s health. Large decreases in the hash rate are important to note as they make the underlying network more vulnerable to 51% attacks. This is the case as less computing power would be required to attack the network, thus making it less costly. On the other hand, increases in hash rate make it more costly to attack a blockchain.
- Another important factor of the hash rate is how it relates to miner profitability. When mining rewards drop in Bitcoin’s well-known halvings, miner profitability also drops proportionally. As a result, the hash rate often drops right after halvings, though this has typically been temporary.
- Willingness to keep mining despite smaller profit margins can be interpreted as a sign of optimism among miners. Hence, Bitcoin’s increasing hash rate despite the May 2020 halving could signal positive expectations from miners in regards to the crypto-asset’s price, which can potentially be interpreted as bullish sentiment from miners.
- Types:
- 30-Day Average, 30-Day High, 30-Day Low
- Hash Rate Distribution
- Definition: Concentration of hash rate by mining pool
- Description:
- measure of the aggregate computing power provided by miners in a Proof of Work (PoW) blockchain. The distribution of hash rate points out how the contribution of computing resources is split across mining pools.
- Interpretation:
- The hash rate distribution metric is valuable to assess the dominance of particular mining pools and their concentration. In theory, having multiple mining pools where each pool has a small percentage of the hash rate suggests high decentralization, and therefore greater censorship-resistance for a blockchain.
- Although miners globally can participate in virtually any mining pool, they do tend to follow local patterns. This became apparent with the Chinese crypto mining migration, which led to a decrease of 30% and 60% in the Binance and Huobi pools (which have large propositions of Chinese miners).
- Miner Rewards
- Definition: Rewards paid out to miners in the form of issuance (block subsidy) and transaction fees
- Interpretation:
- Miner rewards are useful to understand how much value is being created by miners, at least in terms of how much they are earning. This indicator also provides insights into the activity of a blockchain.
- An increase in transaction fee revenues indicates high blockchain activity from the part of users. When blockchain activity is low, the proportion of mining revenue coming from transaction fees declines.
- Miner Rewards Volume Share
- Definition: The percentage that mining rewards represent out of the total on-chain volume on a given day.
- Description:
- Miner Rewards Volume Share puts miner activity in context to the total volume. In this case, the indicator measures only mining revenues as a percentage of daily on-chain transaction volume.
- Interpretation:
- gauge the marginal effect from additional crypto being mined.
- Since inflation rate has decreased significantly amongst most proof of work blockchains, the percentage that daily mining rewards make out of the total volume has decreased to become almost negligible.
- It is worth keeping this indicator in mind to contextualize the selling pressure created from each additional day of mining.
- While the marginal impact is quite small, higher selling pressure tends to come from existing miner reserves.
The SOPR (Spent Output Profit Ratio) indicator provides insight into macro market sentiment, profitability and losses taken over a particular time-frame. It reflects the degree of realised profit for all coins moved on-chain.
SOPR is measured by considering only coins moved the timescale considered (daily, hourly etc), and taking the ratio between the fiat value at the time of UTXO creation, and the fiat value when the UTXO is spent.
The SOPR indicator can be considered within the following framework:
- SOPR values greater than 1 implies that the coins moved that day are, on average, selling at a profit (price sold is greater than the price paid).
- SOPR value less than 1 implies that the coins moved that day are, on average, selling at a loss (price sold is less than the price paid)
- SOPR value of exactly 1 implies that the coins moved that day are, on average, selling coins at break even.
- SOPR trending higher implies profits are being realised with potential for previously illiquid supply being returned to liquid circulation
- SOPR trending lower implies losses are being realised and/or profitable coins are not being spent.

- Estimated Levarage Ratio (ELR)
- Definition: The ratio of open interest divided by the reserve of an exchange.
- Interpretation
- Estimated Leverage Ratio indicates how much leverage is used by users on average.
- ELR for a derivative exchange tells us how much leverage is used by users on average. This information measures traders' sentiment whether they take a high risk or low risk.
- By value itself as the degree of leverage of the market
- High: Over Leveraged Market+ Possible Volatility
- Low: Low Leveraged Market
- By examining trend as the sentiment or tendency of total investors' urge to use leverage.
- Increasing trend: Holding More Leverage
- Increasing in values indicates more investors are taking high leverage risk in the derivatives trade.
- Also, if ELR value is high compared to the last couple of days, it indicates traders are quite confident in their positions.
- Decreasing trend: Taking off Leverage
- Decreasing in values indicates more investors are taking off leverage risk in the derivatives trade.
- Also, if ELR value is low compared to the last couple of days, it indicates traders are changing their views or finishing their positions.
- Increasing trend: Holding More Leverage
- Short Term Holder SOPR
-
Definition: evaluates the profit ratio of the whole market participants by comparing the value of outputs at the spent time to created time.
- In a simple way, you can estimate the distribution of spent transaction output is in profit or not. SOPR is calculated as the USD value of spent outputs at the spent time(realized value) divided by the USD value of spent outputs at the created time(value at creation).
-
Steps:
- UTXO is transferred now
- CryptoQuant locates the USD Value of the spent period and divide them by the USD Value at the created time Simply put, SOPR = Now value/ Past value
- Categorize and put some figures separately by span time to conclude more specific meanings
-
Interpretation:
- By Value itself
- SOPR value greater than 1 ( SOPR > 1 ): It implies that the coins moved in a certain timescale are, on average, selling at a profit.
- SOPR value of exactly 1 ( SOPR =1 ): It implies that the coins moved in a certain timescale are, on average, selling coins at break even.
- SOPR value less than 1 ( SOPR < 1): It implies that the coins moved in a certain timescale are, on average, selling at a loss.
- By Value itself
-
By examining trend
- SOPR Trending Higher implies profits are being realized and coins that were in profit are being transferred to others. Also, it could be implied that investors who sell their coins in profit are increasing their sell or market condition for sellers are getting more profitable.
- SOPR Trending Lower implies losses are being realized and coins that were in loss are being transferred to others. Also, it could be implied that investors who sell their coins in loss are increasing their sell or market condition for sellers are getting less profitable
-
-
Investing Applied Scenario:
- Historically, in the middle of bull sentiment, the market correction begins right before the bull run begins and making SOPR drop below '1'. This could be the right time to buy before the bull run starts.
- Historically, in the middle of bear sentiment, the market correction begins right before the bear market starts making SOPR rise above '1'. This could be the right time to sell before the bear market starts.
-
Why are some indicators modified?
-
- Can less than an hour long aged UTXO mean significance?(aSOPR)
- aSOPR stands for adjusted SOPR( Spent Output Profit Ratio) .
- It derived from the standard SOPR by excluding UTXOs that has input-output span that are aged less than an hour long.
- If there are too many UTXO that are being generated recently, the indicator's value will be made equal to the number of 1 which would mean that many UTXO are at even.
- Can less than an hour long aged UTXO mean significance?(aSOPR)
-
- What if long/short aged UTXO specifically suffer from loss? (LTH-SOPR, STH-SOPR)
- LTH-SOPR stands for Long Term Holder - SOPR ( Spent Output Profit Ratio). It derived from the standard SOPR by leaving only the UTXO that are aged more than 155 days.
- STH-SOPR stands for Short Term Holder - SOPR ( Spent Output Profit Ratio). It derived from the standard SOPR by leaving only the UTXO that are aged less than 155 days and more than an hour alive.
-
-
Long Term Holder SOPR
-
Adjusted SOPR (aSOPR)
-
SOPR Ratio (LTH-SOPR/STH-SOPR)
-
Spent Output profit Ratio
-
MVRV Ratio (three halvings)
- Definition: MVRV (Market Value to Realized Value) ratio is defined as an asset's market capitalization divided by realized capitalization.
- Interpretation:
- By comparing two valuation methods, the MVRV ratio can tell us to get a sense of whether the price is fair or not, which means it is useful to get market tops and bottoms.
- It is important to note that historically, it has been an outstanding indicator to spot market top/bottom or local top/bottom that occurred through three halvings.
-
Stablecoin Supply Ratio (SSR)
- Definition: ratio of the Market Cap of BTC divided by the Market Cap of all Stablecoins.
- ![[Pasted image 20220722162029.png]]
- Interpretation
- In understanding SSR, understanding the function of stablecoin and its assumption should be done.
- First, stablecoins play an important role in the cryptocurrency market as a fiat currency like USD in the regulated market. This is because fiat currencies like USD as a supplier of liquidity have a lot of regulation issues.
- Second, SSR is easy to understand when there is an assumption that the market is a closed system containing only cryptocurrencies and stablecoins.
- The relationship between BTC and Stablecoins is like seasaw and provide valuable insight on who has more weight at the moment.
- By value itself
- It shows comparative power status between BTC and Stablecoin by comparing market cap
- High : Low Potential Buying Pressure - Bearish
- High values mean Low Stablecoin supply compared to the market cap of BTC indicating potential low buying pressure and possible price drop.
- Low : High Potential Buying Pressure - Bullish
- Low values mean high Stablecoin supply compared to the market cap of BTC indicating potential buying pressure and possible price rise.
- By examining trend
- It shows the level of Exchange Activeness & Volatility
- Increasing trend : Slowing down status of stablecoin's buying power - Bearish or sideways sentiment
- Decreasing trend : Rising status of stablecoin's buying power - Bullish NoteAdditional stablecoins could be minted anytime disrupting the assumption that crypto market is a closed system. However, as crypto market continues to expand, additional mint would gradually lose its impact on the model. As time passes, the degree of values' meaning could differ on level.
-
Realized Price
- Definition: Realized Cap divided by the total coin supply. It measures the average price weighted by the supply of what the entire market participants paid for their coins. It can be interpreted as the on-chain support or resistance price.
-
Realized Price - UTXO Age Bands
- Definition: a set of realized prices along with age bands. The metrics help us to overview each cohort’s holding behavior by overlaying a set of different realized prices. Realized price is calculated as Realized Cap divided by the total supply.
measure movements within exchanges to provide a near real-time view of trading activity. Each indicator refreshes every 1 minutes
-
Bid-Ask Spread (refresh every 1min, display last 12 hours activity)
- Definition: a measure of liquidity calculating the difference between the ask price and bid price in a limit order book.
-
Exchange-Onchain Market Depth
- Definition: numbers of open buy and sell orders at difference prices and on-chain positions at those price ranges (circles on top graph)
-
Trades per Side
- Definition:
- Measure the number (or volume) of trades where the buyers "crossed the spread" and bought at the Ask price vs the number (or volume) of trades where sellers "crossed the spread" and sold at Bid price, per minute.
- Types of Buyer - Seller Trades Difference
- 1 minute, 10 minutes, 30 minutes, 1 hour, 3 hours, 6 hours, 12 hours
- Definition:
-
Net Unrealized Profit/Loss (NUPL)
- Definition:
- Net Unrealized Profit and Loss (NUPL) is the difference between market cap and realized cap divided by market cap.
- Description:
- Assuming that the latest coin movement is the result of a purchase, NUPL indicates the total amount of profit/loss in all the coins represented as a ratio.
- It could be interpreted as the ratio of investors who are in profit.
- Values over '0' indicate investors are in profit and an increasing trend in value means more investors are beginning to be in profit.
- This phase indicates the increasing reason to take profit which leads to an increase in sell pressure.
- More: https://dataguide.cryptoquant.com/utxo-data-indicators/net-unrealized-profit-and-loss-nupl
- API: https://cryptoquant.com/docs#operation/getNUPL
- Definition:
-
Net Unrealized Profit (NUP)
- Definition:
- Net Unrealized Profit (NUP) is the sum of products of UTXO's value and the price difference between created and destroyed only in profit, divided by market_cap.
- Description:
- Assuming that the latest coin movement is a result of a purchase, it shows the total number of UTXOs that are in profit.
- An increasing trend in value means more investors are beginning to be in profit resulting increase in sell pressure.
- More: https://dataguide.cryptoquant.com/utxo-data-indicators/net-unrealized-profit-and-loss-nupl
- API: https://cryptoquant.com/docs#operation/getNUPL
- Definition:
-
Net Unrealized Loss
- Definition: Net Unrealized Loss (NUL) is the sum of products of UTXO's value and the price difference between created and destroyed only in loss, divided by market_cap.
- Description:
- Assuming that the latest coin movement is a result of a purchase, it shows the total number of UTXOs that are in loss.
- An increasing trend in value means more investors are beginning to be in loss indicating “possible bottom”.
- More: https://dataguide.cryptoquant.com/utxo-data-indicators/net-unrealized-profit-and-loss-nupl
- API: https://cryptoquant.com/docs#operation/getNUPL
When UTXO is destroyed, Coin Days Destroyed (CDD) is calculated as the sum value of the number of days between created and spent multiplied by UTXO amount.
This indicator gives more weight to the longer-lived UTXO making the indicator sensitive to long-term holders' movement.
CDD provides the sentiment of long-term holders and behavior.
High values indicate long-term holders moved their coins for the purpose of possible selling.'
- Coin Days Destroyed (CDD)
- Definition:
- Coin Days evaluates the number of coins that are not being spent, which gives more weight to estimate long-term-holder(LTH) position.
- Description:
- When that coin is spent, the coin is considered "destroyed," and is being updated on Coin Days Destroyed(CDD) metric. CDD is the sum of products of spent transaction output alive days and its value.
- Interpretation:
- By value itself
- High: Long-held coins are moving in great amounts -Volatility Risk or Possible Trend Reversal
- A large number of alive days are destroyed which indicates that long-term holders' coins are exposed to selling. Since coins held long have a huge impact on the market,
- Low: Long-held coins are moving in less amount
- By examining trend
- Increasing trend: Increasing selling pressure: Long term holders' coins are continuously being sold
- Decreasing trend: Decreasing selling pressure: Long term holders' coins are slowing down in movement
- Note on CDD
- CDD gives more weight to
- longer-lived UTXO
- Amount of UTXO is holding BTC. Weighting more on these makes the indicator sensitive to long-term holders’ movement and show sentiment & behavior.
- CDD gives more weight to
- Explanation on creation and destruction of UTXO(s): For every coin that has not been spent on that day, it accumulates one "Coin Day." To understand the concept of "Coin Day" better, check the examples below.
- A UTXO for 1 BTC that has not been spent for 10-days has accumulated 10 coin days.
- A UTXO for 0.5 BTC that has not been spent for 100-days has accumulated 50 coin days.
- A UTXO for 8 BTC that has not been spent for 6-hours (1/4 day) has accumulated 2 coin days.
- When that coin is spent, the coin is considered "destroyed," and is being updated on CDD metric.
- CDD: An indicator reflects market participants who have been in the bitcoin on-chain for longer.
- Supply Adjusted CDD: Normalized CDD by supply total.
- Average Supply Adjusted CDD: Average value of Supply-Adjusted CDD since genesis block.
- Binary CDD: Signal whether the current Supply-Adjusted CDD is larger than its average or not.
- By value itself
- More: https://cryptoquant.com/asset/btc/chart/network-indicator/supply-adjusted-cdd?window=DAY&sma=0&ema=0&priceScale=log&metricScale=linear&chartStyle=line
- API: https://cryptoquant.com/docs#operation/getCDD
-
Supply-Adjusted CDD
- Definition: CDD value adjusted by supply. It is calculated as the value of CDD divided by total supply.
- Description:
- It is adjusted CDD for better tracking of long-term holders.
- High values indicate long-term holders sold more proportional to indicator's values.
- More: https://cryptoquant.com/asset/btc/chart/network-indicator/supply-adjusted-cdd?window=DAY&sma=0&ema=0&priceScale=log&metricScale=linear&chartStyle=line
- API: https://cryptoquant.com/docs#operation/getCDD
-
Average Supply-Adjusted CDD
- Definition: The historical average value of Supply-Adjusted CDD after generation block.
- Description:
- It indicates how much long-term holders' activeness of movement was higher or lower than average.
- More: https://cryptoquant.com/asset/btc/chart/network-indicator/average-supply-adjusted-cdd?window=DAY&sma=0&ema=0&priceScale=log&metricScale=linear&chartStyle=line
- API: https://cryptoquant.com/docs#operation/getCDD
-
Binary CDD
- Definition: binary value and if Supply Adjusted Coin Days Destroyed (Supply-Adjusted CDD) is larger than average Supply-Adjusted CDD, Binary Coin Days points to '1' and points to '0' if not.
- Description:
- It shows whether long-term holders' movements are higher or lower than average.
- High density of value pointing '1' indicates long-term holders moved their coins for possible selling.
-
Supply Adjusted Dormancy
- Definition: supply adjusted average number of destroyed days of moved coins.
- Description:
- It is calculated by dividing Average Dormacy by the total amount of supplies.
- Adjustment was made due to increasing supply of coins.
- Its value increase when long-term holders move or possibly sell their coins indicating possible price drop.
- Details:
- (average_dormancy) is the average number of days destroyed per coin transacted.
- Supply-Adjusted Average Dormancy (sa_average_dormancy) is the average dormancy normalized by supply total, where supply total increases as more blocks mined.
- API: https://cryptoquant.com/docs#operation/getPNLSupply
-
Average Dormancy
- Definition: The average number of destroyed days of moved coins.
- Description:
- It is calculated by dividing CDD by the total amount of movement of coins.
- Its value increase when long-term holders move or possibly sell their coins indicating possible price drop.
- Input:
- CDD;
- total amount of movement of coins.
- API: https://cryptoquant.com/docs#operation/getDormancy
-
NVT Golden Cross
- Definition: Modified index of Network Value to Transaction(NVT) that provides local tops/bottoms.
- Description:
- Values over '2.2' indicate overbuying (possible top)
- under '-1.6' indicate overselling (possible bottom).
- API: https://cryptoquant.com/docs#operation/getNVTGoldenCross
-
Puell Multiple
- Definition:
- The ratio of the daily value of the issued coin in USD divided by 365 days moving average of the daily value of issued coins in USD.
- ![[Pasted image 20220722141529.png]]
- Description:
- Predicting Price Tops and Bottoms
- Values over ‘4’ : Short Signal
- If Puell multiple rises, it indicates that price=Miner's revenue is increasing significantly compared to the cost they put in. In this phase, bitcoin soared to point where Miner's revenue far exceeds the cost they put in. If we put regard bitcoin's true value with miners' cost (POW) and hashrate, this could indicate that bitcoin is overpriced.
- In other words, this could indicate that price is overvalued along with the increasing miner's motive to sell.
- Values under ‘0.5’ : Long Signal
- If Puell multiple decreases, it indicates that price=Miner's revenue is decreasing significantly compared to the cost they put in. In this phase, bitcoin prices plunged to the point where miners can't handle the cost of electricity making some miners stop their mining action.
- In other words, this could indicate that price is undervalued along with the increasing miner's motive to hold their bitcoin reserve.
- Values over ‘4’ : Short Signal
- By examining trend, it shows miners' short-term revenues relative to long-term profits.
- Increasing trend : Marketcap(Price) is heating up compared to miners' cost
- Decreasing trend : Marketcap(Price) is cooling down compared to miners' cost
- Predicting Price Tops and Bottoms
- Definition:
-
NVT Ratio
- Definition: NVT Golden Cross (NVT_GC) is a Bollinger-band-like signaling indicator based on NVT, defined as the following equation. - ![[Pasted image 20220722142139.png]]
- Description
- NVT Golden Cross targets to generate short or long signals by comparing the short-term trend of NVT and the long-term trend of NVT.
- This leading indicator predicts the appearances of local tops and bottoms, which helps traders to take their short or long positions.
- Predicting Local Tops and Bottoms
- Values over ‘2.2’ : Short Signal: If the short-term trend is way greater than the long-term trend is, the network can be interpreted as overpriced and will soon revert to mean value, meaning short signal.
- Values under ‘-1.6’ : Long Signal: If the long-term trend is way greater than the short-term trend is, the network can be interpreted as under-priced and will soon revert to mean value, meaning long signal.
- comparative trend difference between long-term and short-term.
- Increasing trend : Marketcap(Price) is heating up compared to transaction volume
- Decreasing trend : Marketcap(Price) is cooling down compared to transaction volume
Bollinger Bands: display a graphical band (the envelope maximum and minimum of moving averages, similar to Keltner or Donchian channels) and volatility (expressed by the width of the envelope) in one two-dimensional chart. Two input parameters chosen independently by the user govern how a given chart summarizes the known historical price data, allowing the user to vary the response of the chart to the magnitude and frequency of price changes, similar to parametric equations in signal processing or control systems. Bollinger Bands consist of an N-period moving average (MA), an upper band at K times an N-period standard deviation above the moving average (MA + Kσ), and a lower band at K times an N-period standard deviation below the moving average (MA − Kσ). The chart thus expresses arbitrary choices or assumptions of the user, and is not strictly about the price data alone.
-
Network Value to Metcalfe Ratio(NVM)
- Definition: the ratio of the log of market capitalization divided by the log of the square of daily active addresses in the specified window.
- ![[Pasted image 20220722144815.png]]
- Description:
- evaluates the fair value of the blockchain network by applying Metcalfe's Law where the law claims that the value of the network is proportional to the square of the number of active users.
- High values : Overvalued network The network is overvalued by the interpretation where the price is too high compared to the low number of active addresses
- Low values : Undervalued network The network is undervalued by the interpretation where the price is too low compared to the high number of active addresses
- Use Case: RSI based market spotting local tops and bottoms
- measuring the relative strength of an upward trend and downward trend. We apply RSI to NVM for spotting the market's local tops and bottoms by thresholding. As you can see in the figure below, RSI of NVM quite correctly spots local tops and bottoms in a robust way.
- ![[Pasted image 20220722145156.png|300]]
- Definition: the ratio of the log of market capitalization divided by the log of the square of daily active addresses in the specified window.
-
Stock-to-Flow Ratio
- Definition: ratio of currently circulating coins divided by newly supplied coins.
- Interpretation:
- SF ratio assumes that the scarcity of the coin drives the price of the coin. The analysis on SF ratio is first presented by a pseudonymous Dutch institutional investor who operates under the Twitter account “PlanB”. By looking at SF ratio as a chart, we can spot where the market regime is.
- ![[Pasted image 20220722150016.png|200]]
- If Newly supplied coins decrease, SF Ratio rises.
- If circulating coins rises, SF Ratio rises.
- Use Case: Statistical analysis on SF ratio
- The log of SF ratio is in a linear relationship with the log of the price. We reproduce the results of what they claim and as a result, shown in the figure below, SF ratio and price are in a linear relationship (not perfectly but in some sense) with significant statistics (p-value under 0.01, R-square over 90%).
- Following the above linear statistics (trend and intercept), we can plot how closely they are related in a time-series manner. With this graph, we can recognize that the current price is in what regime recently.
-
Stock to Flow Reversion
- Definition: ratio of the price of BTC divided by SF ratio.
- Formula: ![[Pasted image 20220722150521.png]]
- Interpretation:
- measures the relative difference between the market price and SF ratio. SF ratio so far correctly estimates the price trend, which means the price deviation from SF ratio can be an opportunity to bet.
- If SF reversion is too high compared to the price, the market price would be corrected soon, meaning a bearish moment.
- Use Case: Predicting market
- 1st build a linear regression model of SF reversion to the price to align two variables.
- After aligning both in a single graph shown below, we can clearly see the deviations of SF reversion to the price and those points clearly indicate bullish (green boxes) and bearish (red boxes) regimes respectively.
- ![[Pasted image 20220722151539.png|300]]
-
MCA (Mean Coin Age)
- Definition: the mean value of products of coin unspent transaction output (UTxO) alive days and its value.
- ![[Pasted image 20220722151820.png]]
- Interpretation
- MCA is similar to CDD but focuses more on unspent transaction output. Mean Coin Dollar Age is the sum value of products of
- coin unspent transaction output alive days, value, and the price at the created time. This indicator enables estimating the Long-Term Holders' portion.
- MCA is the average age of UTxO. MCA drop implies the massive move of Bitcoin UTxOs that haven't moved for a long time.
- MCDA is an indicator weighted by UTxO created price(USD) to the MCA.
- MCA is similar to CDD but focuses more on unspent transaction output. Mean Coin Dollar Age is the sum value of products of
-
Mean Coin Dollar Age
- Definition: the mean value of products of coins unspent transaction output alive days, value, and price (Unit: USD) at the created time.
- Description:
- 'Alive days' means the days certain coins was kept in a single wallet.
- Sudden decrease in values indicate coins that were dormant moved in mass.